Als PDF, PPTX herunterladen


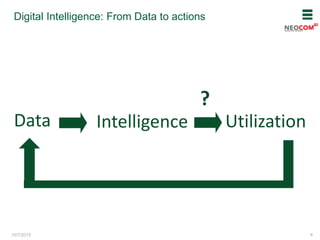


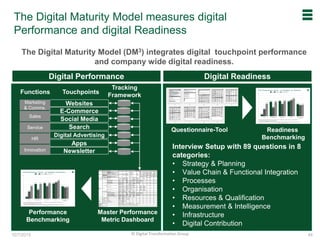


Das Dokument untersucht die Rolle der digitalen Intelligenz als entscheidender Faktor für den Erfolg im Omni-Channel-E-Commerce, insbesondere durch effektives Customer Journey Management und Rating-Management. Es werden Strategien zur Kundengewinnung, Umsatzsteigerung und Kostenreduktion durch den Einsatz von Daten und digitalen Tools vorgestellt. Ein Digital Maturity Model wird als Benchmark zur Bewertung der digitalen Reife von Unternehmen im Handel durchgeführt.


