Als PDF, PPTX herunterladen


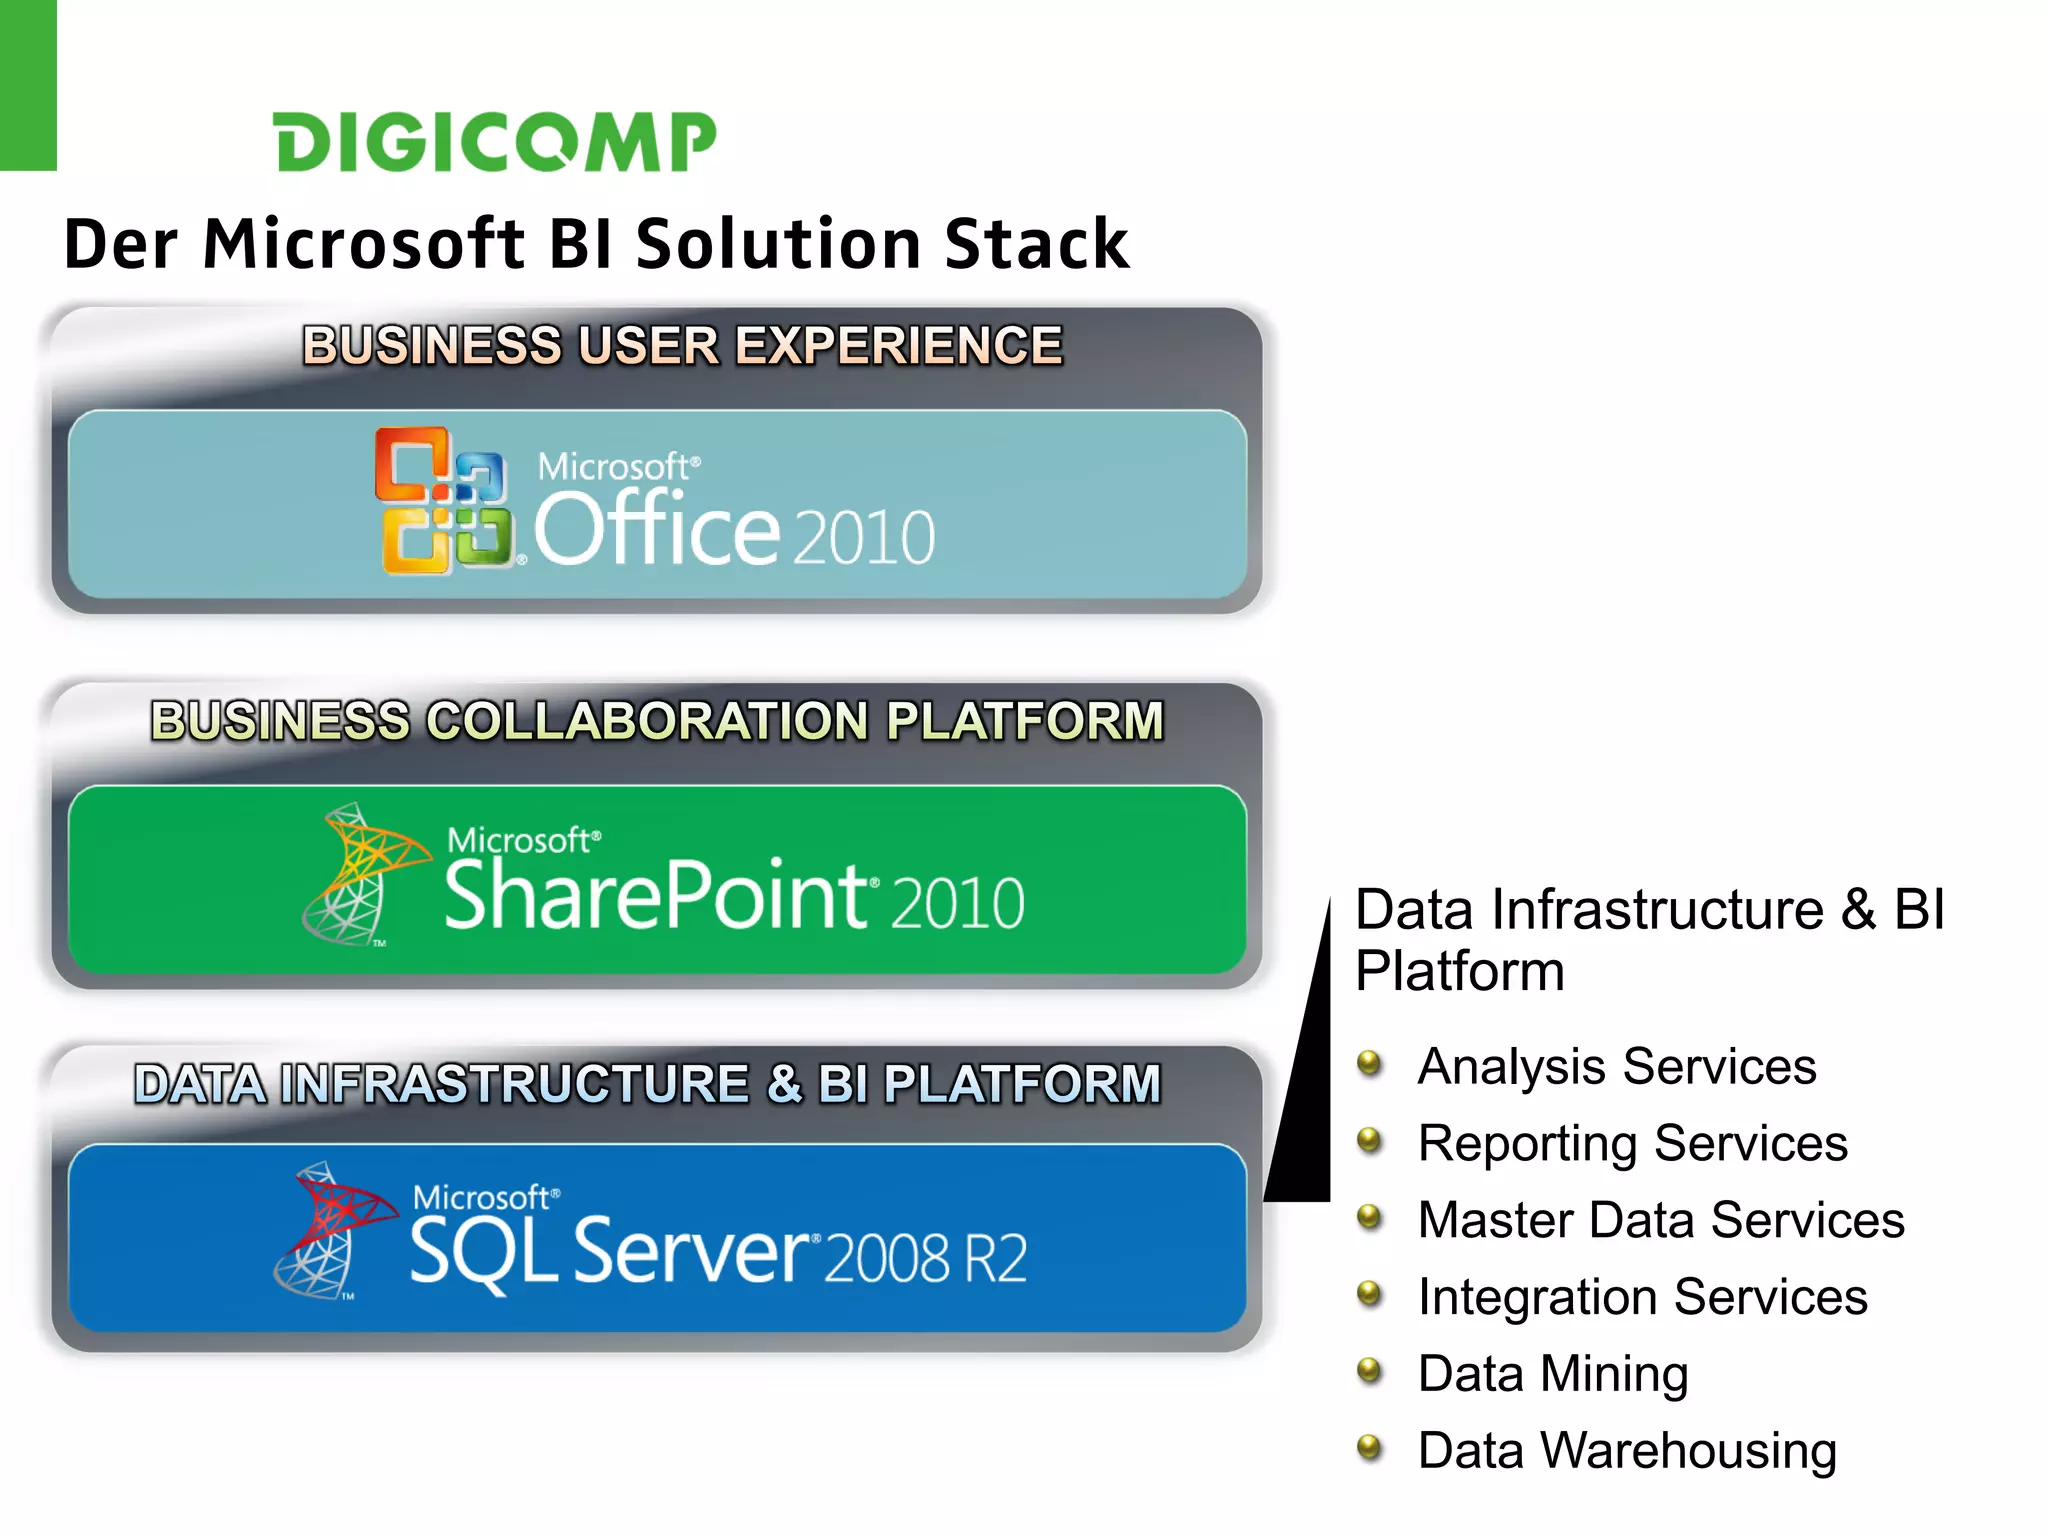
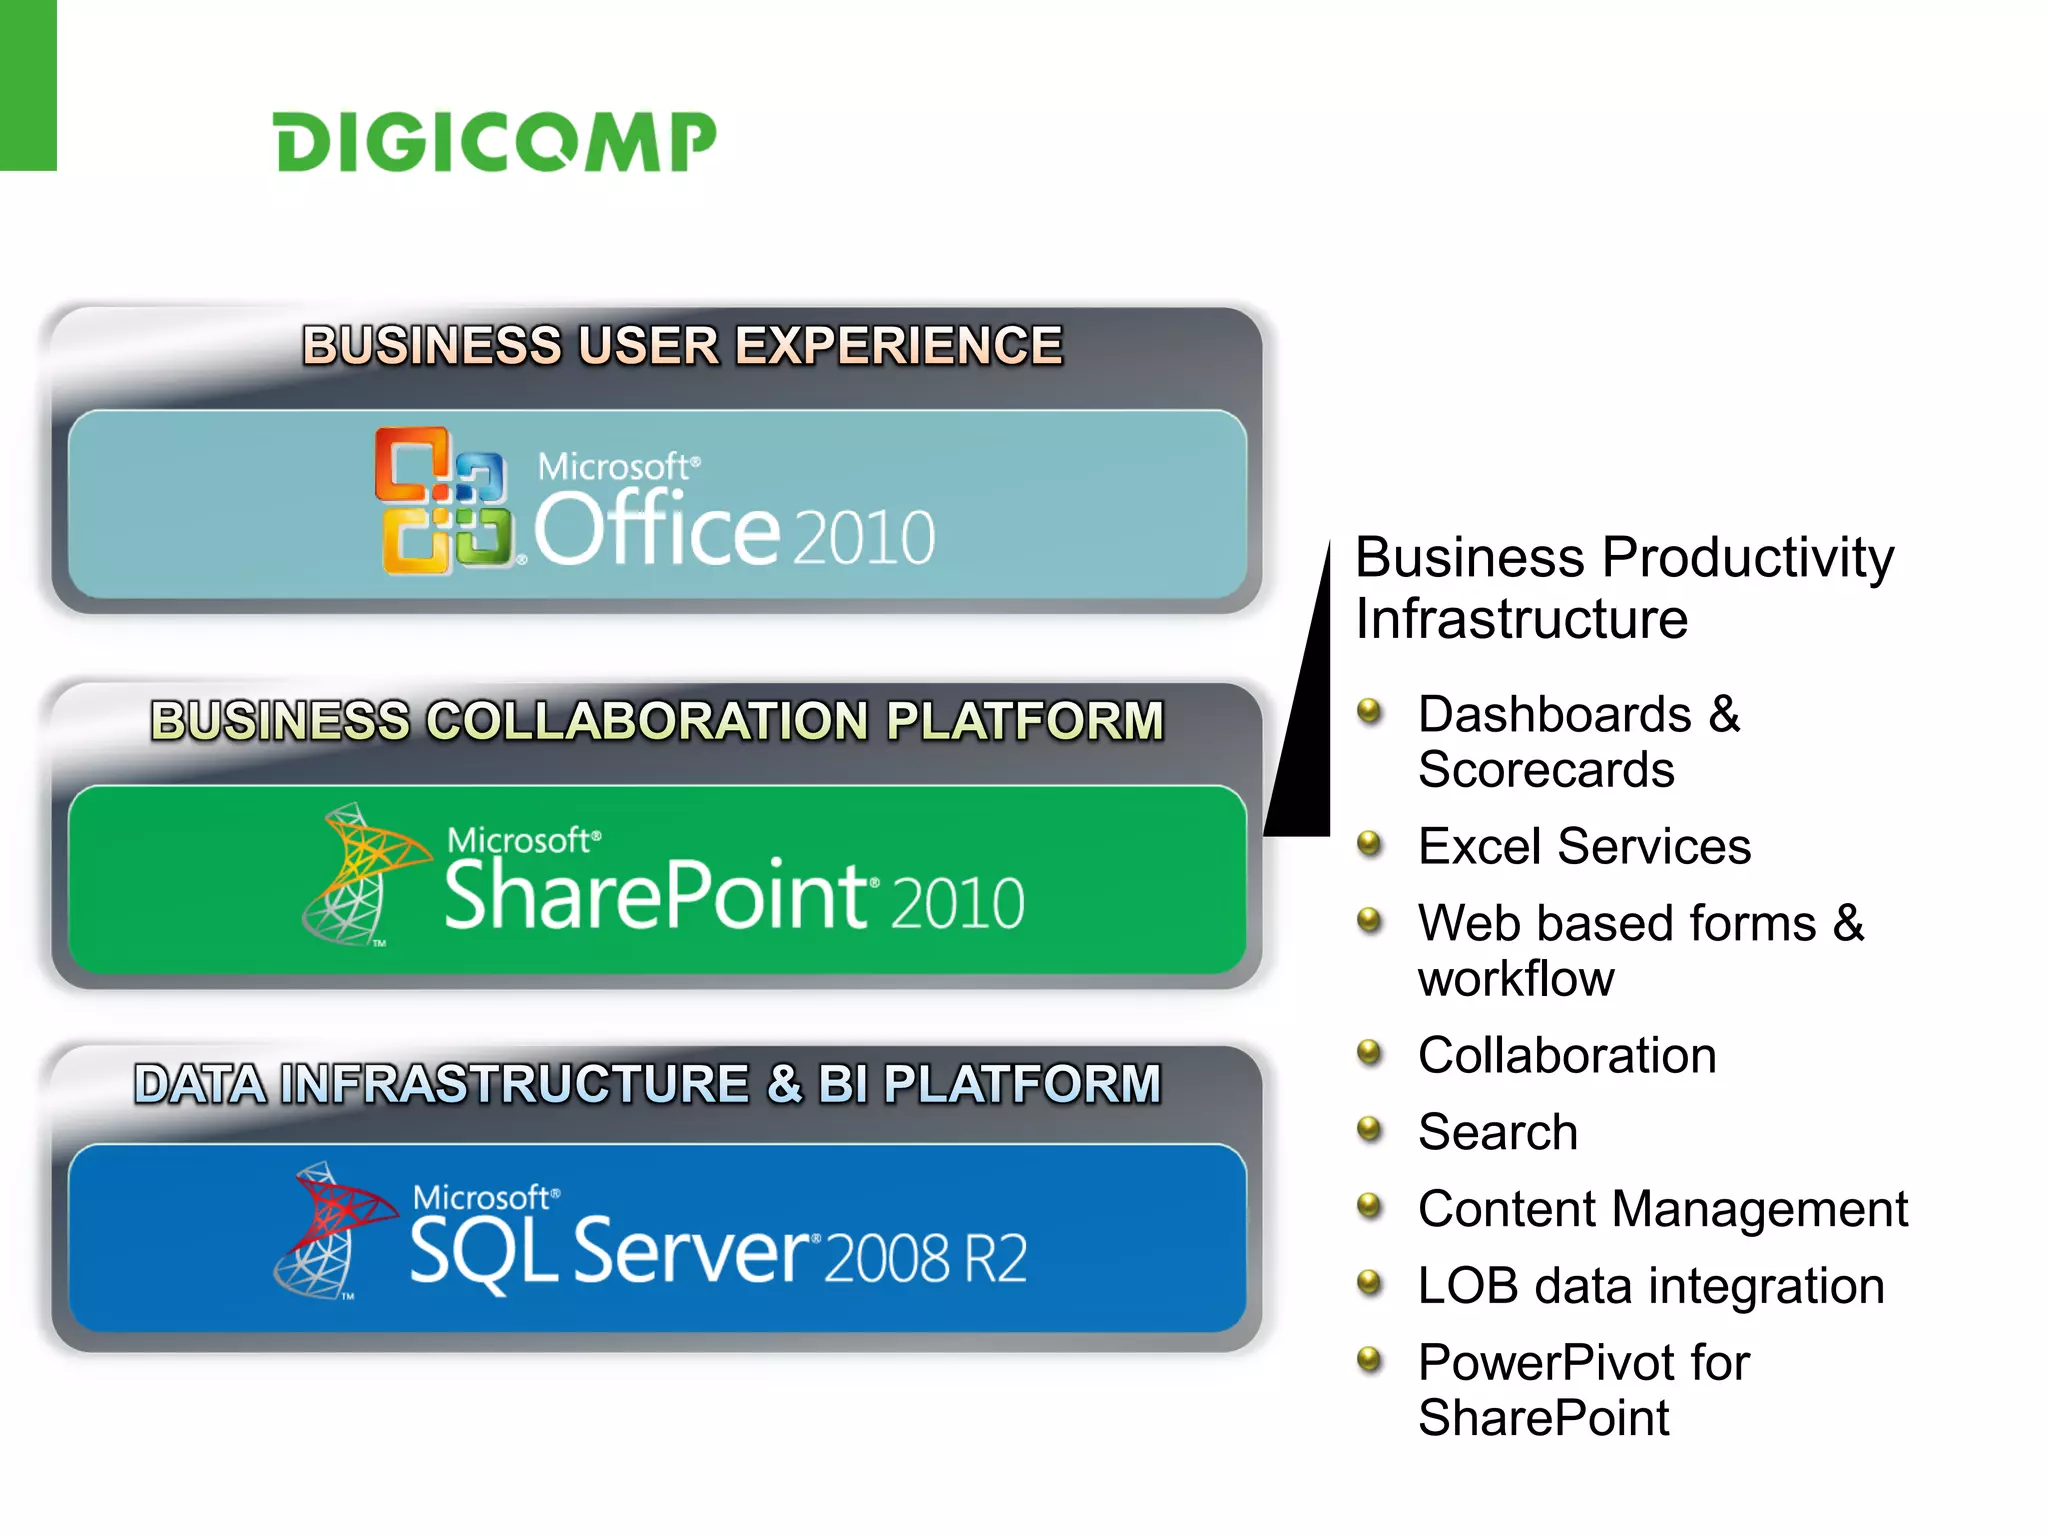
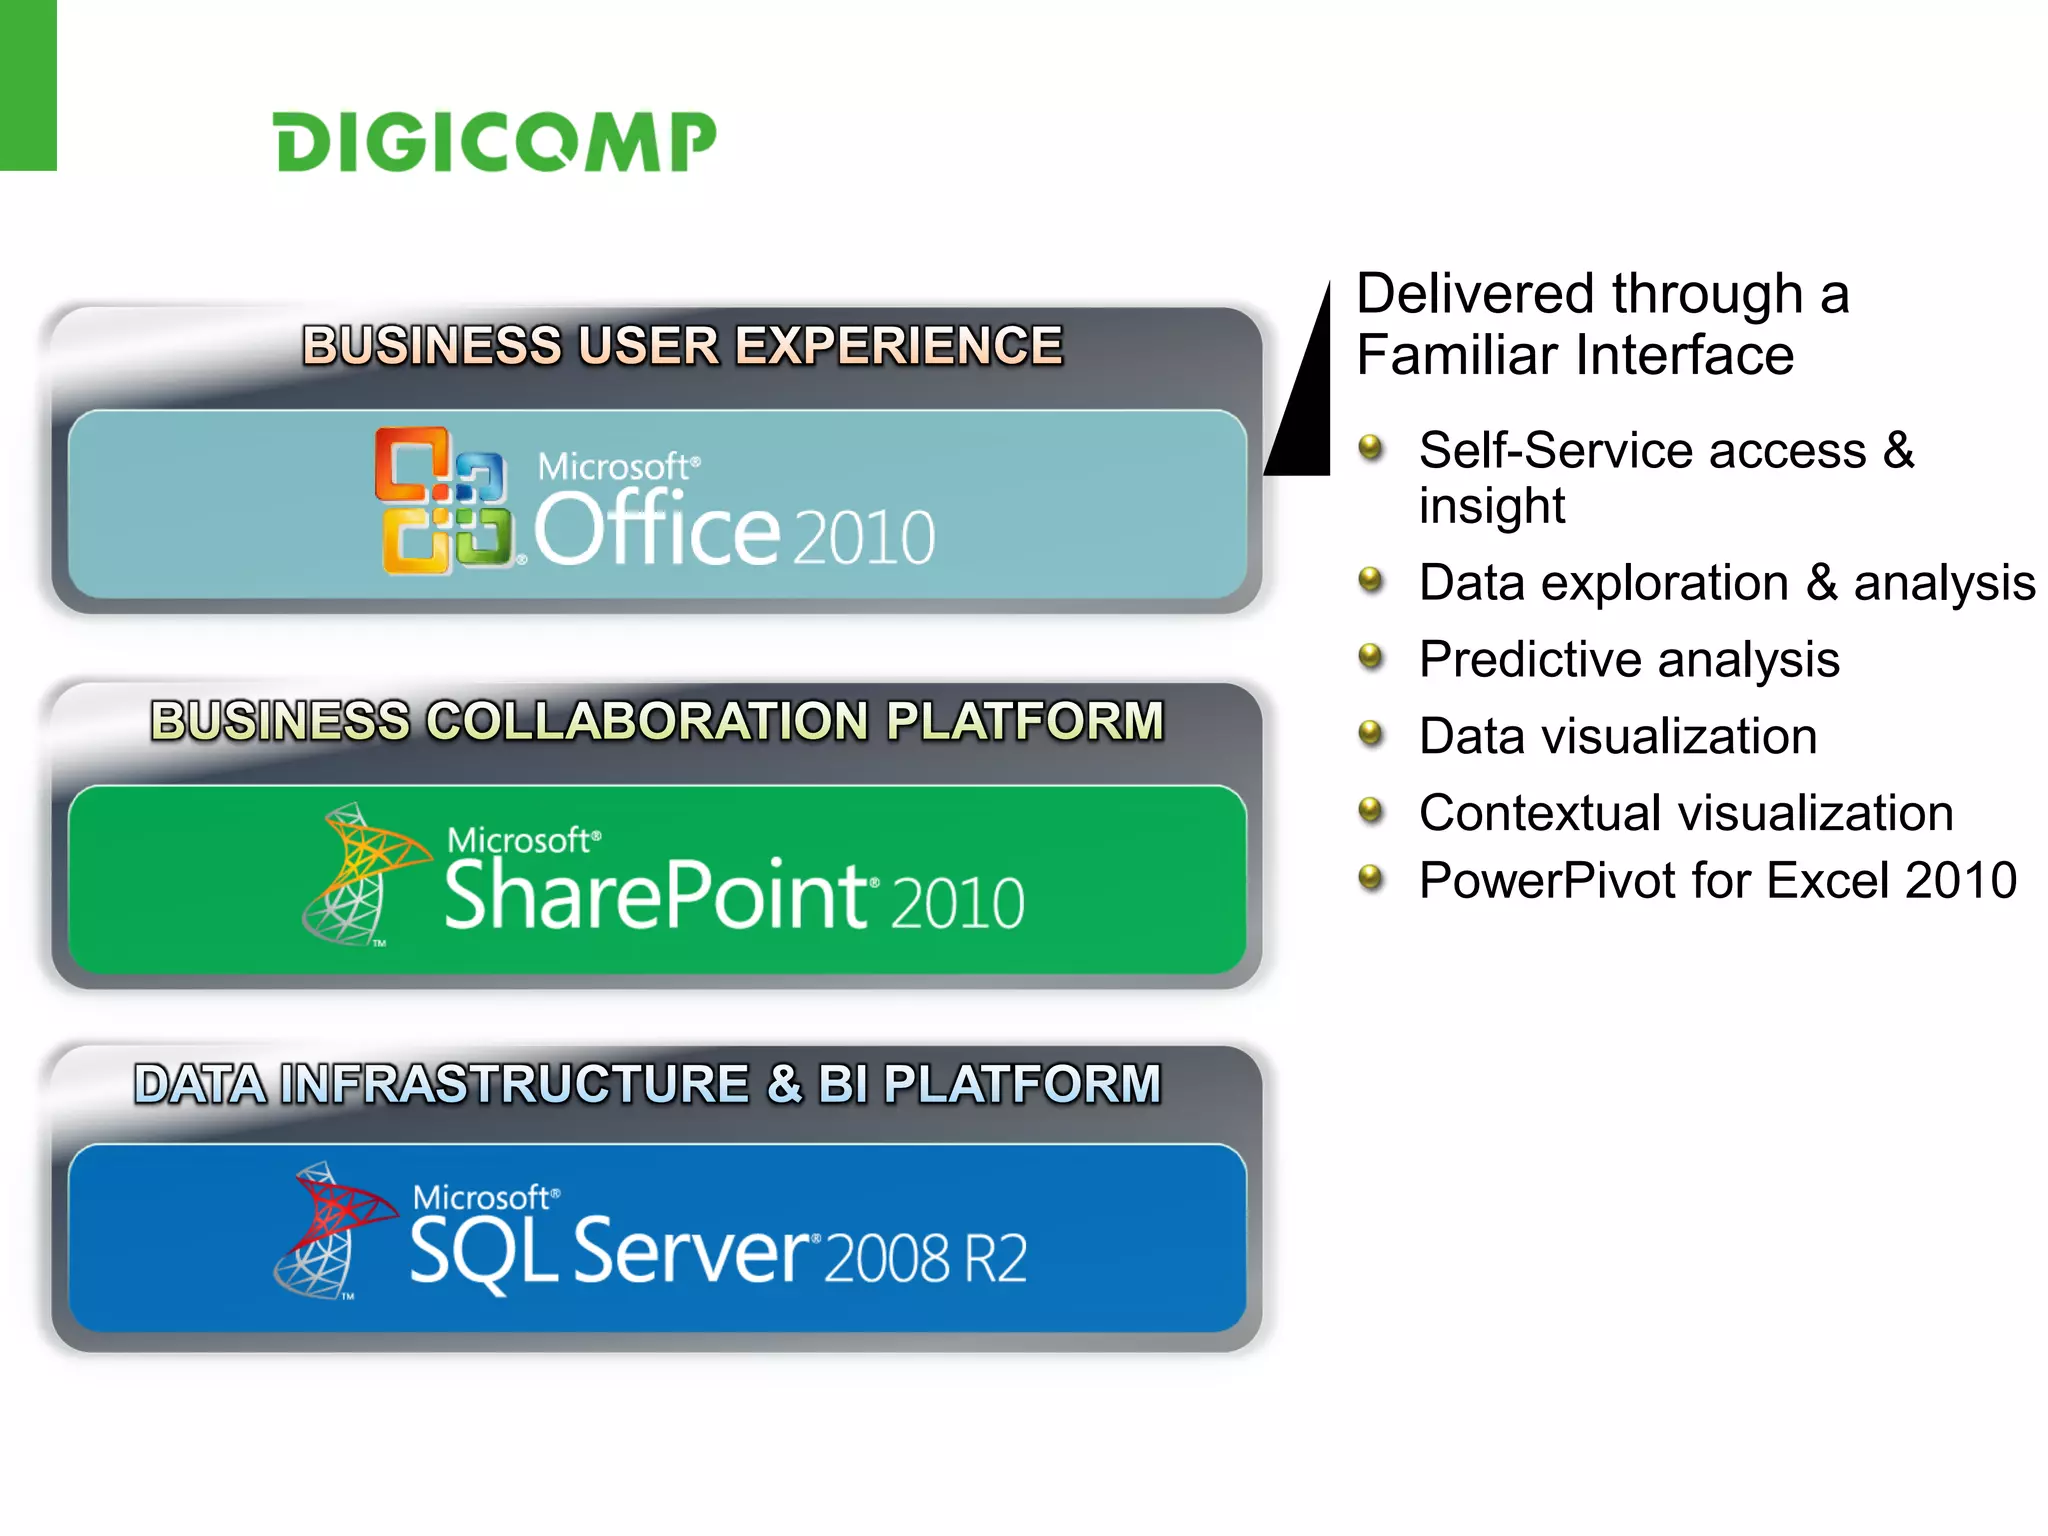


Das Dokument präsentiert den Microsoft BI-Stack und bietet einen Überblick über verschiedene Tools wie Excel Services, PowerPivot und Reporting Services. Es enthält auch Demonstrationen zu den Funktionalitäten dieser Tools und gibt Empfehlungen, wann welches Werkzeug eingesetzt werden sollte. Ziel ist es, effiziente Datenanalyse und -visualisierung zu ermöglichen.


