Downloaden Sie, um offline zu lesen

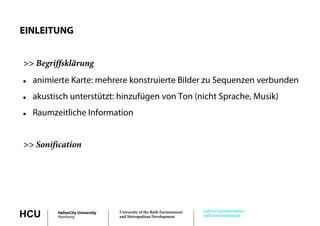
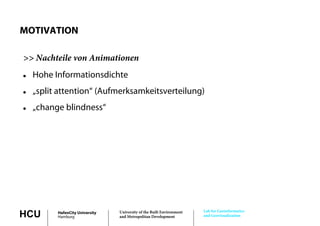
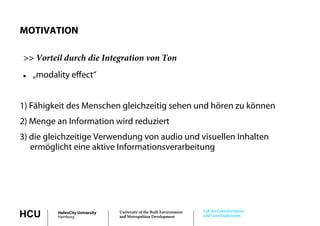
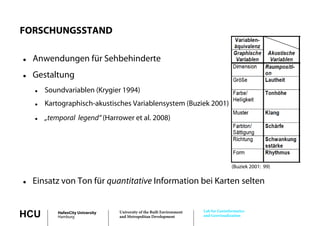
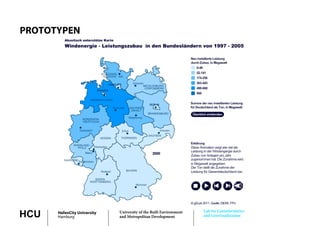
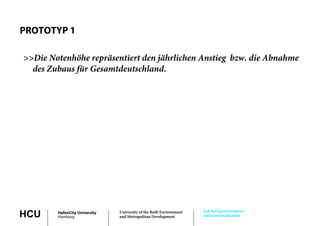
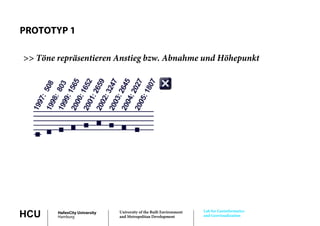
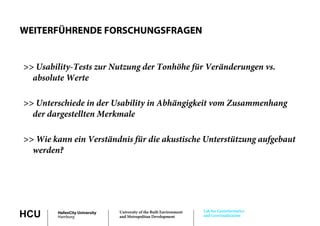
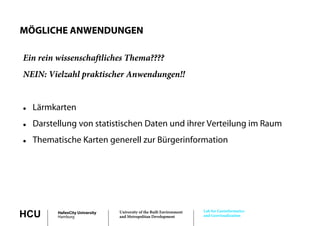

Das Dokument behandelt die Konzeption von akustisch unterstützten, animierten Karten zur Präsentation raumzeitlicher Informationen, mit dem Ziel, die Informationsverarbeitung zu verbessern. Es wird erwähnt, dass die Integration von Ton das Benutzerverständnis fördern und die Nachteile der Animationen verringern kann. Zudem werden Prototypen und praktische Anwendungen dieser Technologie in unterschiedlichen Bereichen skizziert.


