Downloaden Sie, um offline zu lesen


![Energieverbrauch [GWh] 14157
KFZ Bestand 2016 700.000
Fahrleistung / Jahr [km] 7 Milliarden
Blick auf 2050
Szenario 1 (busines
as usual)
Szenario 2
(optimistisch)
Einwohnerzahl (Millionen) 2,2 2,2
elektrische Fahrzeuge 0
88.000 (+143.000
autonome Fahrzeuge)
konventionelle Fahrzeuge
220.000 (+ 143.000
autonome Fahrzeuge) 22.000
Fahrleistung/Jahr [km] (konventionell)
2,2 Mrd. (+17 Mrd.
autonome Fahrzeuge) 1,1 Mrd.
Millionen tCO2 1,92 0,176
Tabelle 2: Ausblick auf die Rolle autonomer Fahrzeuge in 2050
E-mobility and autonomous cars in 2050?](https://image.slidesharecdn.com/uitp-sdossberger11052017-150-170511211458/85/Space-Efficiency-and-Effective-Life-through-Urban-Transport-in-Vienna-11-320.jpg)
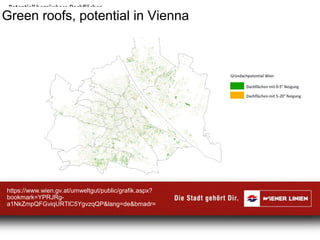
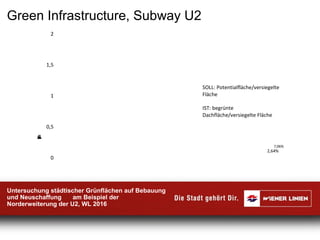
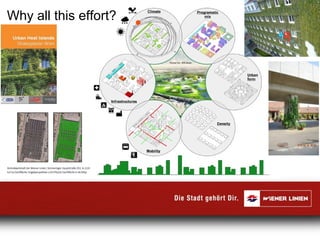

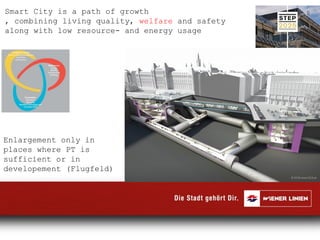
Das Dokument behandelt die Effizienz des urbanen Transports und die Auswirkungen auf den ökologischen Fußabdruck in Wien. Es werden verschiedene Verkehrsszenarien bis 2050 skizziert, einschließlich der Integration autonomer und elektrischer Fahrzeuge sowie der damit verbundenen Veränderungen in der Energieeffizienz und CO2-Emissionen. Zudem wird die Bedeutung von grüner Infrastruktur und Nachhaltigkeit im urbanen Raum betont.


