Downloaden Sie, um offline zu lesen


![Abgeleitete Attribute
11
I 1
v (a)
v (b)
v (c)
v (…)
I 2
v (a)
v (b)
v (c)
v (…)
I 3
v (a)
v (b)
v (c)
v (…)
I …
v (a)
v (b)
v (c)
v (…)
Analyse
[OBJECTID, Shape, LINK_ID, NAME1, NAME2, FROM_NODE, TO_NODE, SPEED_TOW_CAR, SPEED_BKW_CAR,
SPEED_TOW_TRUCK, SPEED_BKW_TRUCK, MAXSPEED_TOW_CAR, MAXSPEED_BKW_CAR, MAXSPEED_TOW_TRUCK,
MAXSPEED_BKW_TRUCK, ACCESS_TOW_PEDESTRIAN, ACCESS_TOW_BIKE, ACCESS_TOW_CAR, ACCESS_BKW_PEDESTRIAN,
ACCESS_BKW_BIKE, ACCESS_BKW_CAR, LENGTH_LINK, FUNCROADCLASS, CAP_TOW, CAP_BKW, LANES_TOW, LANES_BKW,
FORMOFWAY, BRUNNEL, MAXHEIGHT, MAXWIDTH, MAXPRESSURE, ABUTTER_CAR, ABUTTER_LORRY, U_TURN, SLOPE_LINK,
URBAN, WIDTH_LINK, LEVEL, BAUSTATUS, PTV_TYPENO, SUBNET_ID, ONEWAY_LINK, BLT, BLB, EDGE_ID, STREETCAT,
AGG_TYP, USE_ID, COUNT_LINKUSE, OFFSET, WIDTH_LINKUSE, MINWIDTH, FROM_PERCENT, TO_PERCENT, BASETYPE,
BIKEENVIRONMENT, BIKEQUALITYTOW, BIKEQUALITYBKW, BIKEDIRECTTOW, BIKEDIRECTBKW, BIKESIGNEDTOW,
BIKESIGNEDBKW, BIKERECOMMTOW, BIKERECOMMBKW, BIKEWITHFOOTTOW, BIKEWITHFOOTBKW, BIKEFEATURETOW,
BIKEFEATUREBKW]](https://image.slidesharecdn.com/2015-07-09praesentationloidl-150713083930-lva1-app6892/85/AGIT-2015-Qualitatssicherungs-und-Modellierungsroutinen-bei-der-Verwendung-von-GIP-Daten-11-320.jpg)
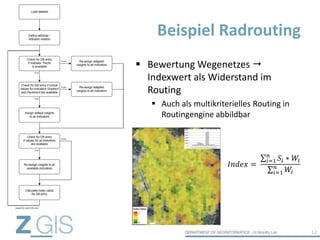

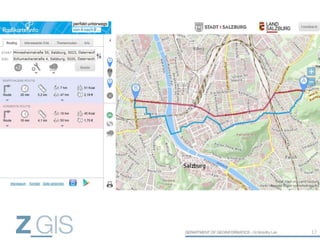


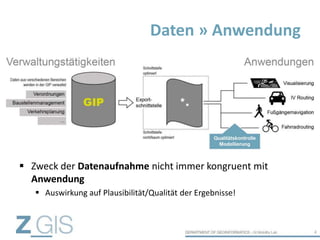
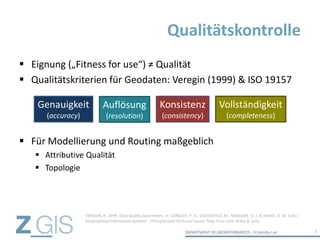
Das Dokument beschreibt die Implementierung systematischer Qualitätssicherungs- und Modellierungsroutinen für Geodaten im Kontext der GIP (Geoinformationsplattform) in Österreich. Es betont die Wichtigkeit der Datenqualität, die durch verschiedene Kriterien wie Genauigkeit, Konsistenz und Vollständigkeit bestimmt wird, und unterstreicht die Notwendigkeit, den ursprünglichen Zweck der Datenerhebung von dem der Anwendung zu unterscheiden. Durch Qualitätskontrollen und gezielte Modellierung sollen die Anwendbarkeit sowie die spezifischen Anforderungen besser erfüllt werden.


