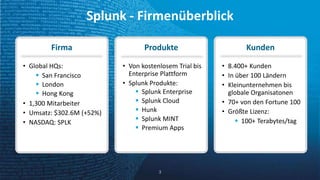
Analyse von Applikationslogs und Querylogs: Datenbanken, Hadoop oder Splunk?KurtStockinger
Applikationen und Datenbanken generieren Logfiles, deren Inhalte wichtige Aussagen über Zugriffsmuster enthalten. So kann ermittelt werden, welche Produkte am häufigsten abgefragt werden oder welche Kundentrends sich abzeichnen. In diesem Vortrag beleuchten wir zunächst die Problematik anhand von praktischen Use Cases. Danach zeigen wir, wie sich die Probleme mit einem herkömmlichen Datenbankansatz, mit Hadoop und mit Splunk lösen lassen.
Scaling your logging infrastructure using syslog-ngPeter Czanik
This talk was presented at All Things Open: https://allthingsopen.org/talk/scaling-your-logging-infrastructure/
Event logging is important not only for IT security and operations, but also for business decisions. The syslog-ng application is an enhanced logging daemon, with a focus on central log collection. It collects logs from many different sources, processes and filters them and finally it stores them or routes them for further analysis.
From this session you will learn (using examples from syslog-ng) why and how to parse important information from incoming messages, and how to route logs, feeding downstream systems using arbitrary formats. We will also discuss how the client – relay – server architecture can solve scalability problems. Also, I will present some of the recently introduced “Big Data” destinations of syslog-ng, which can help to scale your infrastructure even further.
RightScale News November 2013: Launch of Cloud AnalyticsRightScale
On November 7, 2013 RightScale announced Cloud Analytics, a new enterprise-grade cost management solution that provides sophisticated cloud usage and cost analysis as well as forecasting and scenario planning across major public and private clouds. Cloud Analytics is integrated with the RightScale Cloud Management platform, providing a mechanism for enterprises to quickly execute optimizations to their cloud portfolio.
Post Google I/O 2016, an exploration of Google's open source strategy as a feeder to their cloud strategy. Focus on Kubernetes, TensorFlow and Parsey McParseface (sigh)
RightScale Webinar: Considerations For Choosing Cloud ProvidersRightScale
RightScale has deep experience with a wide range of cloud providers, so customers often ask us for advice on which public and private clouds are right for their use cases. While there is no one right answer, we share an evaluation framework for selecting a portfolio of clouds that meets your strategic needs.
We provide an in-depth look at how to align your cloud infrastructure selection with your technical and business requirements.
1. How many clouds will you need?
2. How should you build a cloud portfolio?
3. Public, private, or hybrid? Which type is best for each use case
4. Six considerations for selecting the right cloud
Didn't get a chance to stop by the Cloud Services demo booth? No worries! You can download our presentation materials here. See how our Salesforce advisors can help you maximize your Salesforce investment with key Cloud Services offerings, including Accelerators, Premier Success Plans, Advisory Services and Strategic Projects.
Check out our website to learn more about all of our Cloud Services offerings:
http://sforce.co/1ZuutDV
SolarWinds Federal User Group 2016 - SolarWinds Cloud ProductsSolarWinds
In this 2016 online Federal User Group presentation Joel Dolisy, CIO, SolarWinds introduces federal customers to SolarWinds Cloud products, including our Pingdom, Papertrail, and Librato offerings.
A brief overview of IBM Cloud security in three slides – SaaS, IaaS and PaaS, and the others providing a snapshot of IBM's current set of SaaS, IaaS and PaaS offerings.
(BDT209) Launch: Amazon Elasticsearch For Real-Time Data AnalyticsAmazon Web Services
Organizations are collecting an ever-increasing amount of data from numerous sources such as log systems, click streams, and connected devices. Launched in 2009, Elasticsearch —an open-source analytics and search engine— has emerged as a popular tool for real-time analytics and visualization of data. Some of the most common use cases include risk assessment, error detection, and sentiment analysis. However, as data volumes and applications grow, managing Elasticsearch clusters can consume significant IT resources while adding little or no differentiated value to the organization. Amazon Elasticsearch Service (Amazon ES) is a managed service that makes it easy to deploy, operate, and scale Elasticsearch clusters in the AWS Cloud. Amazon ES offers the benefits of a managed service, including cluster provisioning, easy configuration, replication for high availability, scaling options, data durability, security, and node monitoring. This session presents a technical deep dive on Amazon ES. Attendees learn: Common challenges with real-time data analytics and visualization and how to address them; the benefits, reference architecture, and best practices for using Amazon ES; and data ingestion options with Amazon DynamoDB, AWS Lambda, and Amazon Kinesis.
Présentation de l'épicerie fine Carré des Saveurs. Véritable lieu d'échange pour tous les gourmets. Nos producteurs ont été sélectionné par un comité de dégustation présidé par frédéric simonin
Alle reden über Microservices - Wie haben wir es bei LeanIX gemacht @ EA Conn...LeanIX GmbH
Präsentation von LeanIX (André Christ) vom 2. EA Connect Day in Berlin zum Thema: Alle reden über Microservices - Wie haben wir es bei LeanIX gemacht?
===
LeanIX offers an innovative software-as-a-service solution for Enterprise Architecture Management (EAM), based either in a public cloud or the client’s data center.
Companies like Adidas, Axel Springer, Helvetia, RWE, Trusted Shops and Zalando use LeanIX Enterprise Architecture Management tool.
Free Trial: http://bit.ly/LeanIXDemoS
Steinzeit war gestern! Wege der cloud-nativen EvolutionQAware GmbH
IT-Tage 2018, Frankfurt: Vortrag von Mario-Leander Reimer (@LeanderReimer, Cheftechnologe bei QAware)
=== Dokument bitte herunterladen, falls unscharf! Please download slides if blurred! ===
Abstract:
Jahrzehnte lang haben wir mehr oder weniger erfolgreich monolithische Enterprise Applikationen gebaut. Leider können diese Systeme und deren Betriebsmodelle den hohen Anforderungen moderner Geschäftsmodelle nur noch schwer genügen. Kurze Release-Zyklen, Antifragilität und Hyperscale scheinen unerreichbar zu sein. Was also tun? Muss man diese Systeme alle neu bauen? Das ist sicherlich kein besonders ökonomischer und sinnvoller Weg. Dieser Vortrag zeigt mögliche Wege der Cloud-nativen Evolution von Bestandssystemen und berichtet aus der Praxis.
In ihrer Präsentation "Event Driven Architecture" zeigen Torsten Winterberg (Direktor Strategie & Innovation bei OPITZ CONSULTING) und Guido Schmutz (Technology Manager bei Trivadis) den Nutzen von EDA für moderne Anwendungslandschaften auf.
IoT-X Platform von prodot - Daten sammeln, analysieren und auswertenprodot GmbH
Eine Lösung für alle Daten: Die prodot IoT-X Platform
ermöglicht das Sammeln, Verknüpfen, Analysieren und
Auswerten von Daten aus Tausenden von Sensoren oder
Geräten an einer zentralen Stelle – herstellerunabhängig,
übergreifend und weltweit. Das trägt zur Reduzierung
des Ressourcenaufwands und zur Optimierung in vielen
Bereichen bei und erhöht so die Wettbewerbsfähigkeit.
So hilft ein Enterprise Service Bus, Ordnung in Schnittstellen und Daten zu b...Andrej Radonic
Der Enterprise Service Bus QBus verbindet Inseln im Unternehmen: ERP, CRM, PIM, Online-Shop und Logistik können darüber nahtlos Daten synchronisieren.
Schnittstellen-Probleme, Mehrfacherfassung und -speicherung von Daten, unterschiedliche Datenstände werden durch den Enterprise Service Bus eliminiert. Durch eine hochgradige Automatisierung von Schnittstellen und Datenübertragung sparen Sie Zeit, Geld und Aufwand.
Der Datenconnector QBus der interSales AG ist die komplette Schnittstellenlösung für die Digitalisierung Ihrer Prozesse und Daten.
Steinzeit war gestern! Wege der Cloud-nativen Evolution.QAware GmbH
JCON 2018, Düsseldorf: Vortrag von Mario-Leander Reimer (@LeanderReimer, Cheftechnologe bei QAware)
Abstract:
Jahrzehnte lang haben wir mehr oder weniger erfolgreich monolithische Enterprise Applikationen gebaut. Leider können diese Systeme und deren Betriebsmodelle den hohen Anforderungen moderner Geschäftsmodelle nur noch schwer genügen. Kurze Release-Zyklen, Antifragilität und Hyperscale scheinen unerreichbar zu sein. Was also tun? Muss man diese Systeme alle neu bauen? Das ist sicherlich kein besonders ökonomischer und sinnvoller Weg. Dieser Vortrag zeigt mögliche Wege der Cloud-nativen Evolution von Bestandssystemen und berichtet aus der Praxis.
Die Herausforderungen der Digitalen Transformation im Öffentlichen Sektor. Chancen und Risiken in der Umsetzung neuer Geschäftsmodelle. – Karl Heinz Mayer (Hewlett Packard Enterprise)
Anwender-Case Karl Storz GmbH & Co. KG auf OpenText Basisnetmedianer GmbH
Intentive und netmedia berichteten gemeinsam am Beispiel des Kunden Karl Storz am 22. Januar 2013 über Erfahrungen & Herangehensweisen bei Migration und Betrieb des OpenText Web Site Management.
Cloud Wars – what‘s the smartest data platform? Vergleich Microsoft Azure, Am...inovex GmbH
Die großen Public-Cloud-Anbieter locken inzwischen mit vielversprechenden Platform-as-a-Service-Angeboten um Daten jeglicher Art performant und kosteneffizient zu speichern und zu verarbeiten. Neben unterschiedlichen Datenbanken gibt es dazu Dienste für Batch- und Realtime-Processing. In diesem Vortrag werden einige der wichtigen Data Driven Services anhand eines typischen IoT-Szenarios aus der Praxis beleuchtet. Dazu gehen drei Schwergewichte des Cloud Business ins Rennen: Microsoft Azure vs. Amazon Web Services vs. Google Cloud Platform.
Event: inovex Meetup: "Let's talk about the Cloud!", 22.06.2016
Speaker: Thomas Neureuther, Stefan Kirner, inovex GmbH
Mehr Technologie-Vorträge: https://www.inovex.de/de/content-pool/vortraege/
Ähnlich wie Splunk Webinar: Splunk for Microsoft Exchange (20)
Webinar Big Data zur Echtzeit-Betrugserkennung im eBanking nutzen mit Splunk ...Georg Knon
In diesem Webinar zeigen wir Ihnen, wie Fraud Detection in diesem Umfeld funktioniert:
- Echtzeit-Überwachungsservice
- Neue Einblicke in die Geschäftstätigkeit
- Offene Schnittstelle für interne und externe Systeme
- Automatisierte Reaktion auf Unregelmässigkeiten
- Verdächtige IP Adressen können blockiert werden
- Betroffene Transaktionen umgehend stornieren
- Betroffene Konten sowie Transaktionen können gesperrt und der Endkunde über den Vorfall informiert werden
2. Agenda
2
Jürgen Magiera
Senior Sales Engineer
jmagiera@splunk.com
Thomas Huber
Major Account Manager
thuber@splunk.com
1. Splunk – Überblick
1. Splunk App für Microsoft Exchange
• Exchange in der IT
• Live Demo
• Service Uptime
• Capacity Planning
• Message Tracking
• Access to Intelligence
2. Q&A
3. Splunk - Firmenüberblick
3
Firma
• Global HQs:
San Francisco
London
Hong Kong
• 1,300 Mitarbeiter
• Umsatz: $302.6M (+52%)
• NASDAQ: SPLK
Produkte
• Von kostenlosem Trial bis
Enterprise Plattform
• Splunk Produkte:
Splunk Enterprise
Splunk Cloud
Hunk
Splunk MINT
Premium Apps
Kunden
• 8.400+ Kunden
• In über 100 Ländern
• Kleinunternehmen bis
globale Organisatonen
• 70+ von den Fortune 100
• Größte Lizenz:
100+ Terabytes/tag
5. Führende Plattform für Maschinendaten
Operative Intelligenz
Entwickler-plattform
Kunden-ansichten
Überwachung
und
Alarmierung
Ad hoc
Suchen
Berichte
und
Analysen
Jegliche Maschinendaten
Online
Services Web
Services
Servers
Security GPS
Location
Storage
Desktops
Networks
Packaged
Applications
Custom
Messaging Applications
Telecoms
Online
Shopping
Cart
Web
Clickstreams
Databases
Energy
Meters
Call Detail
Records
Smartphones
and Devices
RFID
HA Indexer
und Storage
Standard-systeme
5
6. Führende Plattform für Maschinendaten
Operative Intelligenz
Entwickler-plattform
Kunden-ansichten
Überwachung
und
In jeder Anzahl, aus jeder Alarmierung
Lokation und Quelle
Ad hoc
Suchen
Berichte
und
Analysen
Jegliche Maschinendaten
Online
Services Web
Services
Servers
Security GPS
Location
Storage
Desktops
Networks
Packaged
Applications
Custom
Messaging Applications
Telecoms
Online
Shopping
Cart
Web
Clickstreams
Databases
Energy
Meters
Call Detail
Records
Smartphones
and Devices
RFID
HA Indexer
und Storage
Standard-systeme
6
Schema-on-the-
fly
Universelles
Weiterleiten
Kein RDBMS
im
Hintergrund
Keine
Notwendigkeit
Daten zu
filtern
7. Mehrwerte für die IT und das Business
IT
Operations
Application
Delivery
Business
Analytics
Security,
Compliance
and Fraud
Developer Platform (REST API, SDKs)
Industrial Data
and Internet of
Things
7
8. Fertige Dashboards & Reports
Web Intelligence
SDKs UI
API
8
Server, Storage,
Network
Server
Virtualization
Operating
Systems
Custom
Applications
Business
Applications
Cloud
Services
Mobile
Applications
App Performance
Ticketing/Other Monitoring
11. Maschinendaten bieten kritische Einsichten
Customer ID Order ID
Customer’s Tweet
Time Waiting On Hold
Twitter ID
Product ID
Company’s Twitter ID
Order ID Customer ID
Customer ID
Sources
Order Processing
Middleware
Error
Care IVR
Twitter
11
12. Maschinendaten bieten kritische Einsichten
Order ID
Customer’s Tweet
Time Waiting On Hold
Product ID
Company’s Twitter ID
Order ID
Customer ID
Twitter ID
Customer ID
Customer ID
Sources
Order Processing
Middleware
Error
Care IVR
Twitter
12
13. End-To-End Monitoring & Korrelation
Exchange
Admin
13
Linux/Win
Admin
Network Admin
Applications
Admin
Line of
Business User
Application
Support
VMware/Linux/
Win Admin
Security
Admin
Storage Admin IT
Management
14. Ein Messaging Service = Multiple Komponenten
14
Verschiedene
Proxys/Firewalls
Microsoft Exchange
2007
Microsoft Exchange
2010
Email Provider BYOD
Active Directory
Identity
Management
10’s oder 100’s
von Servern
1000’s
von Mailboxes
15. Wie sieht die Realität aus?
Windows Server
Event Logs
15
Performance
Monitoring Data
Firewall Logs
User
Information
Active Directory
Logs
16. Microsoft Exchange Service Prioritäten
16
Service
Verfügbarkeit
Exchange
Administratoren
brauchen flexible
Lösungen um Exchange
zu verwalten
Kapazitäts-
Plannung
Es ist wichtig zu Wissen,
welche Ressourcen
wirklich verwendet
werden
“Was ist der Zustand von
Exchange”
“Welche Ressourcen
werden von wem
verwendete ”
Message
Tracking
Teams brauchen die
Möglichkeit Emails zu
tracken sowohl Inbound
& Outbound
“Wo sind die Emails”
Operational
Analytics
Admin Teams brauchen
schnell Informationen
über Ihre Exchange
Umgebung
“Ich brauche
Auswertungen über
meine Email Umgebung
ASAP”
17. Was leistet die Splunk App For MS Exchange?
Intelligence
17
Operations
reporting
Message
Tracking
Client
Behavior
Logfiles
Configs
Message
Data
Alerts
Metrics
Scripts
Changes
Client Access
Servers
Mailbox
Stores
Hub & Edge
Transports
Reputation
Monitoring
Capacity
Planning
18. Vorteile der Splunk App for Exchange
18
Service
Verfügbarkeit
Sofortige Einblicke in
den Zustand der
kompletten Exchange
Infrastruktur
Kapazitäts-
Plannung
Verschiedene Reports
über Kapazitäts-auslastung,
Anomalien
& Trends
“Ich weiss at-a-glance
wenn Exchange Problem
hat”
“Ich weiss was, wie und
vom wem Exchange
verwendet wird”
Message
Tracking
End-to-End Sichtbarkeit
über den Message Flow
“Ich weiss wenn eine
Nachricht nicht richtig
versendet wird”
Operational
Analytics
Security Event
Reporting, Threat
Detection, Reputation
Monitoring, Change
Tracking, User Behavior
“Ich haben eine große
Anzahl von Report-möglichkeiten
über mein
Exchange Umgebung”
19. Vorteile der Splunk App for Exchange
19
Service
Verfügbarkeit
Sofortige Einblicke in
den Zustand der
kompletten Exchange
Infrastruktur
Kapazitäts-
Plannung
Verschiedene Reports
über Kapazitäts-auslastung,
Anomalien
& Trends
“Ich weiss at-a-glance
wenn Exchange Problem
hat”
“Ich weiss was, wie und
vom wem Exchange
verwendet wird”
Message
Tracking
End-to-End Sichtbarkeit
über den Message Flow
“Ich weiss wenn eine
Nachricht nicht richtig
versendet wird”
Operational
Analytics
Security Event
Reporting, Threat
Detection, Reputation
Monitoring, Change
Tracking, User Behavior
“Ich haben eine große
Anzahl von SLA
Report-möglichkeiten
Monitoring
über mein
Exchange Umgebung”
Schnellere
MTTR
Geringere
Kosten
Gesteigerte
Verfügbar-keit
20. Splunk App für MS Exchange
Inhalte:
• Eine Kombination von Splunk den Apps: MS Exchange, Windows & Active Directory
• Beinhaltet vorgefertigte Korrelationen zwischen Exchange, Windows & AD um eine End-to-
End Betrachtung zu ermöglichen
• Eine vielzahl „Out Of The Box“ IT Management Dashboards und Reports
Vorteile:
• Verkürzte Installationszeit auf Infrastruktur- und Applikationsebene
• Schnelle Bereitstellung von Reports und Korrelation zwischen Systemzustände,
Kapazität, Sicherheit und Betriebsinformationen über den gesamten Services.
• Ausführliche Komponenten-Reports (z.B. Exchange + WS + AD, Firewalls, etc.)
Splunk App for
MS Exchange
Exchange
Content
Windows
Content
AD
Content
Splunk has more than 1200 employees worldwide, with our global headquarters in San Francisco. Our 7,900 customers in 100 countries are using Splunk software to improve service levels, reduce operations costs, mitigate security risks, enable compliance, enhance DevOps collaboration and create new product and service offerings.
Our products are designed to fit your needs and are built to be as frictionless to deploy as possible. Simple download Splunk software, point it at your data, and you’ll up and running in minutes.
Please always refer to latest company data found here: http://www.splunk.com/company.
At Splunk, our mission is to make machine data accessible, usable and valuable to everyone. And this overarching mission is what drives our company and product priorities.
Splunk ingests data, lots of it, and we structure it. Once its structured, determining outliers is a fairly simple statistical problem. Across all fields, which events have values, averages, x percentile which are a 2 standard deviations or more outside the norm? In which case, show it to you. May be false positives/negatives, but it beats trying to analyze the other 99.9% of events we discarded for you because they look normal.
Splunk is the leading platform for machine data analytics with over 6,000 organizations using Splunk – for data volumes ranging from tens of GBs to tens of TBs to over 100 TBs of data PER DAY.
Splunk software reliably collects and indexes all the streaming data from IT systems, technology devices and the Internet of Things in real-time - tens of thousands of sources in unpredictable formats and types. Splunk software is optimized for real-time, low latency and interactivity.
Both IT and business professionals can analyze machine data to get real-time visibility and operational intelligence.
With our platform for machine data, organizations can meaningfully improve their performance in a wide range of areas e.g. meet service levels, reduce costs, mitigate security risks, maintain compliance and gain insights.
A range of plugins, templates and full-fledged apps are available to help you collect, analyze and harness data from every layer of your technology stack. Even if you’re using a product that’s not listed here, Splunk still doesn’t limit you – you can still index data from that technology.
One of the key benefits of using Splunk software is the ability to correlate machine data across silos, providing visibility across the entire Application Delivery and IT Ops landscape.
Unlike traditional structured data or multi-dimensional data– for example data stored in a traditional relational database for batch reporting – machine data is non-standard, highly diverse, dynamic and high volume. You will notice that machine data events are also typically time-stamped – it is time-series data.
Take the example of purchasing a product on your tablet or smartphone: the purchase transaction fails, you call the call center and then tweet about your experience. All these events are captured - as they occur - in the machine data generated by the different systems supporting these different interactions.
Each of the underlying systems can generate millions of machine data events daily. Here we see small excerpts from just some of them.
When we look more closely at the data we see that it contains valuable information – customer id, order id, time waiting on hold, twitter id … what was tweeted.
What’s important is first of all the ability to actually see across all these disparate data sources, but then to correlate related events across disparate sources, to deliver meaningful insight.
If you can correlate and visualize related events across these disparate sources, you can build a picture of activity, behavior and experience. And what if you can do all of this in real-time? You can respond more quickly to events that matter.
For example, if an organizations captured the customers twitter ID in their customer profile this correlation would be possible. Where that didn’t exist, they could at least group by demographic with the tweets.
You can extrapolate this example to a wide range of use cases – security and fraud, transaction monitoring and analysis, web analytics, IT operations and so on.
Having said that, often times you will find yourself in a position that will talk about
Having said that, Splunk’s strength is not only in providing deep insights with granular data in siloed technologies with our Apps, our differentiator is in being able to provide visibility across these silos. While administrators can accelerate getting insights with our Apps, we don’t lock out admins in their own silos. They can get visibility into multiple tiers, coz often times that not, even though these admins care about their siloes they want that cross tier visibility. We are and will not compete against point solutions. While the Apps certainly help you address this point, the strength in our platform is to bring this cross-siloed visibility and cater to multiple roles and use-cases. While some of these Apps have definitely helped displace point solutions, we are more than a point solution. We provide something that no other solution in the market today can provide as easily as we can.
And with this, we’re able to reduce costs significantly for our customers, by consolidating tools, eliminating silos and finding root-cause faster.
Priya:
We don’t lock out admins into their own silos. Get insights into all of the technology areas they manage
The main point is that were still not looking to compete against point solutions. Helps you address a point need but supports multiple use-cases.
They achieve value and appreciate the App most when they correlate the data across multiple tiers.
Some of these Apps an displace point solutions, but the value is in positioning it with the strength that enterprise brings to the table.
Microsoft Exchange is not just comprised of a couple exchange servers. Email is a complete service. Mail comes in and out. You also have a perimeter defense systems (filtering technologies or firewalls) and different versions of the Exchange service. Ensuring email as a service runs smoothly means that systems other than just Exchange must be working properly. In this example, you can see samples of components that go into an enterprise-level implementation of Microsoft example. For example, an environment running Exchange will likely include defense appliances such as Cisco IronPoint, Exchange servers running 2007 or 2010 or 2013 versions of Exchange, SI load balances, maybe even blackberry servers. Also, multiple access devices can All of these components make it hard to scale Exchange and ensure the consistence in service. The exchange admins can in some case be managing environments may have over 300,000 users.
When a user calls up and says exchange is broken, the Service Desk has to look at some many tools and different pieces of information in order to find out what may be occurring.
As we mentioned previously, one of the major challenges for environments using exchange is correlating the data across multiple systems. When you break down all of those layers of information that we saw previously that has to be aggregated and tied together. Splunk can take in all of the machine data for cross correlation purposes, for example, from Windows Server logs, Exchange Servers logs, Blackberry, firewall logs, performance monitoring data on the host machine itself and the Exchange server, and user information – what is the user behavior? Who are the top senders.
Physical underlying hardware and how users are using the service.
A recent customer said that they wanted to create reports specific to the exec staff and the CIO (so a specific user). The exec doesn’t have time to provide information to track user (where they logged in from, what type of advice, etc, and get more proactive, especially when there are log in attempts that have been unsuccessful. Helps them maintain high level SLAs.
The key benefits are at-a-glace solve the same challenges that we discussed in Module 2.
Service uptime dashboards that allow admins to make sure service is up. They can see at-a-glance if Exchange has a problem. Instant visibility into email service health across all the infrastructure component.
Capacity planning – Now customers can see in-depth reports on capacity usage, anomalies, and trends and forecasts. They can see historical trends of how a database grew over time and what resources are being used by whom and at what rate.
Message tracking – Now they can also have end-to-end visibility into message delivery across heterogeneous email components. They can track an email through the entire delivery.
And finally Operations analytics in terms of security event reporting, threat detection and so on. They have a rich set of available reports on the entire messaging environment that will help them track their reputation, user behavior, changes, and more.
A new feature called Dashboard editor that allows them to create a quick customer report on the fly and drag and drop them into a drop zone to compare or package it up as a report as well.
Like many of the other Splunk apps, the Splunk App for Microsoft Exchange correlates information from multiple inputs and aggregates that information in one spot to provide operational intelligence.
For example, you have data sources such as Client Access Servers (how users are accessing the email service), Mailbox Stores (how is information being stored and growing and shrinking), Hub and Edge Transports (how are messages being routed) – all generating machine data in the form of logfiles, config, scripts, etc – all of this data is helpful in troubleshooting Exchange. Another important piece of data is reputation monitoring, which looks at the reputations of a specific domain. If suddenly you see massive amounts of spam coming from your domain, then the reputation of this domain will be reduced and these will start filtering our messages into junk mail. So we track the reputation monitoring aspects as well so we can see if your domain reputation is on the ugly side.
The Splunk App for Microsoft Exchange helps break down those different pieces into the form of reports and dashboards grouped according to operations, message tracking, client behavior, and capacity planning.
The key benefits are at-a-glace solve the same challenges that we discussed in Module 2.
Service uptime dashboards that allow admins to make sure service is up. They can see at-a-glance if Exchange has a problem. Instant visibility into email service health across all the infrastructure component.
Capacity planning – Now customers can see in-depth reports on capacity usage, anomalies, and trends and forecasts. They can see historical trends of how a database grew over time and what resources are being used by whom and at what rate.
Message tracking – Now they can also have end-to-end visibility into message delivery across heterogeneous email components. They can track an email through the entire delivery.
And finally Operations analytics in terms of security event reporting, threat detection and so on. They have a rich set of available reports on the entire messaging environment that will help them track their reputation, user behavior, changes, and more.
A new feature called Dashboard editor that allows them to create a quick customer report on the fly and drag and drop them into a drop zone to compare or package it up as a report as well.
With the release of the Splunk App for 3.0, our customers can see combined approach. We are extracting information from Exchange, Windows, and Active Directory into a single application workload bundlet. This allows us to provide contextual information for the holistic server from each of these elements in the Windows Stack. And as we mentioned on the last page, the app includes out-of-the-box IT management dashboards and reports (over 200 out of the box panels).
This helps them decrease install time at the infrastructure and application level. And Quickly visualize and correlate health, capacity, security and operational information for the entire email service, including ancillary components, (e.g. Exchange + WS + AD, firewalls, etc.)
Splunk 6.1 is our latest version of Splunk software – the industry-leading machine data platform.
Lets recap what Splunk Enterprise 6.1 delivers:
Enabling the Mission-critical Enterprise
Continuous availability of mission-critical machine data with expanded insights from new sources
Multi-site Clustering: Delivers continuous availability for Spunk Enterprise deployments that span sites, countries or continents by replicating raw and indexed data in a clustered configuration
Search Affinity: Provides a performance increase when using multi-site clustering by routing search and analytics requests to the nearest cluster, increasing performance and decreasing network usage.
zLinux Forwarder: Allows for application and platform data from IBM mainframes to be easily collected and indexed by Splunk Enterprise.
Data Preview with Structured Inputs: Enables previewing of massive data files to verify alignment of fields and headers before indexing improving data quality and the time it takes to discover critical insights.
Delivering Enhanced Interactive Analytics
Easier to build dashboards and more interactive visualizations.
Enhanced Dashboard Editor: Provides the ability to build advanced dashboards through the UI and without requiring advanced XML coding.
Chart Overlay: Improves data analysis by providing the ability to overlay one chart on top of another.
Contextual Drilldown: Enables more detailed insights when clicking on a dashboard panel without leaving the context of the dashboard itself.
Pan and Zoom Controls: Enables more focused analytics by providing the ability to selecting a range of interest on a chart and zooming in for deeper analysis.
Embedding Operational Intelligence
Extends Operational Intelligence to common business applications.
Embedded Reports: Enable any report, table to be embedded in third-party business applications such as salesforce.com, WordPress, Wiki Microsoft® SharePoint, and more.
Custom Alerts: Deliver alerts with embedded machine data context reducing mean-time-to-resolution (MTTR), and provide ability to customize alert templates.
Splunk 6.1 represents a significant milestone in our mission to make machine data accessible, usable and valuable by everyone.
Find out more at www.splunk.com/6