Deutsche EuroShop | Quartalsmitteilung 3M 2016
•
1 gefällt mir•349 views

Deutsche EuroShop | Quartalsmitteilung 3M 2016

Empfohlen
Weitere ähnliche Inhalte
Was ist angesagt?
Was ist angesagt? (12)
Andere mochten auch
Andere mochten auch (9)
Ähnlich wie Deutsche EuroShop | Quartalsmitteilung 3M 2016
Ähnlich wie Deutsche EuroShop | Quartalsmitteilung 3M 2016 (20)
Mehr von Deutsche EuroShop AG
Mehr von Deutsche EuroShop AG (20)
Deutsche EuroShop | Quartalsmitteilung 3M 2016
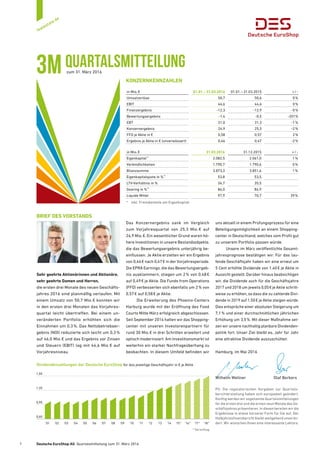
- 1. Dividendenzahlungen der Deutsche EuroShop für das jeweilige Geschäftsjahr in € je Aktie BRIEF DES VORSTANDS Sehr geehrte Aktionärinnen und Aktionäre, sehr geehrte Damen und Herren, die ersten drei Monate des neuen Geschäfts- jahres 2016 sind planmäßig verlaufen. Mit einem Umsatz von 50,7 Mio. € konnten wir in den ersten drei Monaten das Vorjahres- quartal leicht übertreffen. Bei einem un- veränderten Portfolio erhöhten sich die Einnahmen um 0,3 %. Das Nettobetriebser- gebnis (NOI) reduzierte sich leicht um 0,3 % auf 46,0 Mio. € und das Ergebnis vor Zinsen und Steuern (EBIT) lag mit 44,6 Mio. € auf Vorjahresniveau. KONZERNKENNZAHLEN in Mio. € 01.01. – 31.03.2016 01.01. – 31.03.2015 + / - Umsatzerlöse 50,7 50,6 0 % EBIT 44,6 44,6 0 % Finanzergebnis -12,3 -12,9 -5 % Bewertungsergebnis -1,4 -0,5 -201% EBT 31,0 31,3 -1 % Konzernergebnis 24,9 25,3 -2 % FFO je Aktie in € 0,58 0,57 2 % Ergebnis je Aktie in € (unverwässert) 0,46 0,47 -2 % * Vorschlag 1,50 1,20 0,90 0,60 ‘01 ‘04 ‘07 ‘10 ‘13 ‘16 *‘02 ‘05 ‘08 ‘11 ‘14 ‘17 *‘03 ‘06 ‘09 ‘12 ‘15 * ‘18 * 3M Das Konzernergebnis sank im Vergleich zum Vorjahresquartal von 25,3 Mio. € auf 24,9 Mio. €. Ein wesentlicher Grund waren hö- here Investitionen in unsere Bestandsobjekte, die das Bewertungsergebnis unterjährig be- einflussen. Je Aktie erzielten wir ein Ergebnis von 0,46 € nach 0,47 € in der Vorjahresperiode. Die EPRA Earnings, die das Bewertungsergeb- nis ausklammern, stiegen um 2 % von 0,48 € auf 0,49 € je Aktie. Die Funds from Operations (FFO) verbesserten sich ebenfalls um 2 % von 0,57 € auf 0,58 € je Aktie. Die Erweiterung des Phoenix-Centers Harburg wurde mit der Eröffnung des Food Courts Mitte März erfolgreich abgeschlossen. Seit September 2014 hatten wir das Shopping- center mit unseren Investorenpartnern für rund 30 Mio. € in drei Schritten erweitert und optisch modernisiert. Am Investitionsmarkt ist weiterhin ein starker Nachfrageüberhang zu beobachten. In diesem Umfeld befinden wir in Mio. € 31.03.2016 31.12.2015 + / - Eigenkapital * 2.082,5 2.061,0 1 % Verbindlichkeiten 1.790,7 1.790,6 0 % Bilanzsumme 3.873,3 3.851,6 1 % Eigenkapitalquote in % * 53,8 53,5 LTV-Verhältnis in % 34,7 35,5 Gearing in % * 86,0 86,9 Liquide Mittel 97,9 70,7 39 % * inkl. Fremdanteile am Eigenkapital uns aktuell in einem Prüfungsprozess für eine Beteiligungsmöglichkeit an einem Shopping- center in Deutschland, welches vom Profil gut zu unserem Portfolio passen würde. Unsere im März veröffentlichte Gesamt- jahresprognose bestätigen wir. Für das lau- fende Geschäftsjahr haben wir eine erneut um 5 Cent erhöhte Dividende von 1,40 € je Aktie in Aussicht gestellt. Darüber hinaus beabsichtigen wir, die Dividende auch für die Geschäftsjahre 2017 und 2018 um jeweils 0,05 € je Aktie schritt- weise zu erhöhen, so dass die zu zahlende Divi- dende in 2019 auf 1,50 € je Aktie steigen würde. Dies entspräche einer absoluten Steigerung um 7,1 % und einer durchschnittlichen jährlichen Erhöhung um 3,5 %. Mit dieser Maßnahme set- zen wir unsere nachhaltig planbare Dividenden- politik fort. Unser Ziel bleibt es, Jahr für Jahr eine attraktive Dividende auszuschütten Hamburg, im Mai 2016 Wilhelm Wellner Olaf Borkers PS: Die regulatorischen Vorgaben zur Quartals berichterstattung haben sich europaweit geändert. Künftig werden wir sogenannte Quartalsmitteilungen für die ersten drei und die ersten neun Monate des Ge- schäftsjahres präsentieren. In diesen bereiten wir die Ergebnisse in etwas kürzerer Form für Sie auf. Der Halbjahresfinanzbericht bleibt weitgehend unverän- dert. Wir wünschen Ihnen eine interessante Lektüre. 1 Deutsche EuroShop AG Quartalsmitteilung zum 31. März 2016 QuartalsMitteilungzum 31. März 2016 feelestate.de
- 2. Ertragslage Umsatz auf Vorjahresniveau Im Berichtszeitraum beliefen sich die Umsatz- erlöse auf 50,7 Mio. €. Dies ist auf vergleich- barer Basis ein Plus von 0,3 % gegenüber der Vorjahresperiode (50,6 Mio. €). Grundstücksbetriebs- und -verwaltungs- kosten erwartungsgemäß bei 9,4 % Die operativen Centeraufwendungen des Be- richtszeitraumes von 4,8 Mio. € haben sich gegenüber der Vorjahresperiode (4,5 Mio. €) leicht erhöht und entsprachen mit einem An- teil am Umsatz von 9,4 % den Planungen. 1,6 Mio. € sonstige betriebliche Aufwendungen Die sonstigen betrieblichen Aufwendungen betrugen 1,6 Mio. € und lagen damit 0,5 Mio. € unter dem Vorjahr (2,1 Mio. €). In der Vor- jahresperiode waren überproportional hohe Personalkosten im Zusammenhang mit dem 2015 ausgelaufenen Long-Term-Incentive- Plan enthalten. Verbesserung des Finanzergebnisses Das Finanzergebnis verbessert sich aufgrund des Rückganges des Zinsaufwandes von -12,9 Mio. € auf -12,3 Mio. €. Neben laufenden Tilgungen ist die im Sommer des Vorjahres vereinbarte günstigere Anschlussfinanzie- rung für das Forum Wetzlar ursächlich für den geringeren Zinsaufwand. Bewertungsergebnis Das Bewertungsergebnis belief sich auf -1,4 Mio. € (i. Vj. -0,5 Mio. €) und beinhaltet In- vestitionskosten, die in unseren Bestands objekten angefallen sind. Bereinigtes EBT ohne Bewertung steigt um knapp 3 % Das Ergebnis vor Steuern (EBT) lag mit 31,0 Mio. € nahezu auf Höhe der Vorjahrespe- riode (31,3 Mio. €). Bereinigt um das Bewer- tungsergebnis ergibt sich eine Steigerung von 31,8 Mio. € auf 32,7 Mio. € (+2,9 %). Steuern vom Einkommen und vom Ertrag Die Steuern vom Einkommen und Ertrag belie- fen sich auf 6,1 Mio. € (i. Vj. 6,0 Mio. €). Hiervon entfielen 1,4 Mio. € (i. Vj. 1,3 Mio. €) auf zu zah- lende Steuern und 4,7 Mio. € (i. Vj. 4,7 Mio. €) auf latente Steuern. Konzernergebnis leicht rückläufig Das Konzernergebnis lag mit 24,9 Mio. € um 0,4 Mio. € unter der Vergleichsperiode (25,3 Mio. €). Das unverwässerte Ergebnis je Aktie reduzierte sich von 0,47 € auf 0,46 € (-2 %). Die EPRA Earnings erhöhten sich um 2 % von 0,48 € auf 0,49 € je Aktie. EPRA Earnings 31.03.2016 31.03.2015 in T€ je Aktie in € in T€ je Aktie in € Konzernergebnis 24.866 0,46 25.319 0,47 Bewertungsergebnis IAS 40 1.356 0,02 451 0,01 Bewertungsergebnis at-equity-Gesellschaften 377 0,01 7 0,00 Latente Steuern -369 0,00 -74 0,00 EPRA Earnings 26.230 0,49 25.703 0,48 Gewichtete Aktienanzahl 53.945.536 53.945.536 Diluted EPRA Earnings 0,46 0,45 Gewichtete Aktienanzahl 57.105.094 57.007.385 Funds from Operations (FFO) 2 % höher Der FFO stieg von 30,7 Mio. € auf 31,6 Mio. € (+2 %) bzw. von 0,57 € auf 0,58 € je Aktie. Funds from Operations 31.03.2016 31.03.2015 in T€ je Aktie in € in T€ je Aktie in € Konzernergebnis 24.866 0,46 25.319 0,47 Aufwand Wandlungsrecht 242 0,00 289 0,00 Bewertungsergebnis 1.356 0,02 451 0,01 Bewertungsergebnis at-equity-Gesellschaften 377 0,01 7 0,00 Latente Steuern 4.713 0,09 4.675 0,09 FFO je Aktie 31.554 0,58 30.741 0,57 Umsatz in Mio. € 3M 2015 3M 2016 50,7 50,6 EBIT in Mio. € 44,6 44,6 3M 2015 3M 2016 EBT ohne Bewertung in Mio. € 32,7 31,8 3M 2015 3M 2016 FFO je Aktie in € 3M 2015 3M 2016 0,58 0,57 2 Deutsche EuroShop AG Quartalsmitteilung zum 31. März 2016 3M3M
- 3. Finanz- und Vermögenslage Vermögens- und Liquiditätssituation Die Bilanzsumme des Deutsche EuroShop- Konzerns erhöhte sich gegenüber dem letzten Bilanzstichtag um 21,7 Mio. € auf 3.873,3 Mio. €, wesentlich bedingt durch hö- here liquide Mittel (+27,2 Mio. €) und höhere Gewinnrücklagen (+21,1 Mio. €). Eigenkapitalquote bei 53,8 % Die Eigenkapitalquote (inkl. der Anteile von Fremdgesellschaftern) erhöhte sich gegen- über dem letzten Bilanzstichtag (53,5 %) um 0,3 Prozentpunkte und lag bei 53,8 %. Verbindlichkeiten Die kurz- und langfristigen Finanzverbind- lichkeiten lagen zum 31. März 2016 mit 1.403,1 Mio. € im Wesentlichen aufgrund re- gulärer Tilgungen um 4,5 Mio. € unter dem Stand zum Jahresende 2015. Die langfristi- gen passiven latenten Steuern erhöhten sich infolge weiterer Zuführungen um 3,7 Mio. € auf 313,2 Mio. €, die Abfindungsansprüche der Fremdgesellschafter erhöhten sich um rund 0,4 Mio. € auf 293,5 Mio. €. Die übrigen kurz- und langfristigen Verbindlichkeiten und Rückstellungen erhöhten sich um 0,9 Mio. €. Nachtragsbericht Zwischen dem Bilanzstichtag 31. März 2016 und dem Tag der Abschlusserstellung sind keine Ereignisse von wesentlicher Bedeutung eingetreten. Prognosebericht Erwartete Ertrags- und Finanzlage Nach einem planmäßigen Verlauf des ersten Quartals halten wir an unseren im März ver- öffentlichten Prognosen für das Geschäftsjahr 2016 fest und erwarten: • einen Umsatz von 200 bis 204 Mio. € • ein operatives Ergebnis vor Zinsen und Steuern (EBIT) von 175 bis 179 Mio. € • ein Ergebnis vor Steuern (EBT) ohne Be- wertungsergebnis von 127 bis 130 Mio. € • Funds from Operations (FFO) je Aktie zwischen 2,26 € und 2,30 € Dividendenpolitik Wir beabsichtigen, unsere nachhaltig plan bare Dividendenpolitik fortzuführen und gehen davon aus, für das Jahr 2016 eine Dividende von 1,40 € pro Aktie an unsere Aktionäre aus- schütten zu können. Risikobericht Seit Beginn des Geschäftsjahres haben sich kei- ne wesentlichen Änderungen hinsichtlich der Risiken der künftigen Geschäftsentwicklung er- geben. Wir sehen keine bestandsgefährdenden Risiken für die Gesellschaft. Es gelten daher wei- ter die im Risikobericht des Konzernabschlusses zum 31. Dezember 2015 gemachten Angaben. 2015 2016 Ziel 2,26 – 2,30 Ergebnis 2,29 Ziel 127 – 130 Ergebnis 127,0 2015 20162015 2016 Ziel 200 – 204 Ergebnis 202,9 Ziel 175 – 179 Ergebnis 176,3 2015 2016 Umsatz in Mio. € EBIT in Mio. € EBT ohne Bewertung in Mio. € FFO je Aktie in € 3 Deutsche EuroShop AG Quartalsmitteilung zum 31. März 2016 3M3M
- 4. Konzern-Gewinn- und Verlustrechnung Konzern-Gesamtergebnis rechnung Aktiva in T€ 31.03.2016 31.12.2015 VERMÖGENSWERTE Langfristige Vermögenswerte Immaterielle Vermögenswerte 7 8 Sachanlagen 351 365 Investment Properties 3.356.844 3.356.655 Nach at-equity bilanzierte Finanzanlagen 409.037 411.031 Übrige Finanzanlagen 59 59 Langfristige Vermögenswerte 3.766.298 3.768.118 Kurzfristige Vermögenswerte Forderungen aus Lieferungen und Leistungen 2.852 5.605 Sonstige kurzfristige Vermögenswerte 6.179 7.192 Liquide Mittel 97.940 70.699 Kurzfristige Vermögenswerte 106.971 83.496 SUMME AKTIVA 3.873.269 3.851.614 Passiva in T€ 31.03.2016 31.12.2015 EIGENKAPITAL UND SCHULDPOSTEN Eigenkapital und Rücklagen Gezeichnetes Kapital 53.945 53.945 Kapitalrücklage 961.970 961.970 Gewinnrücklagen 773.067 751.944 Summe Eigenkapital 1.788.982 1.767.859 Langfristige Verpflichtungen Finanzverbindlichkeiten 1.355.420 1.359.896 Passive latente Steuern 313.188 309.528 Abfindungsansprüche von Kommanditisten 293.543 293.113 Sonstige Verbindlichkeiten 56.360 52.314 Langfristige Verpflichtungen 2.018.511 2.014.851 Kurzfristige Verpflichtungen Finanzverbindlichkeiten 47.690 47.711 Verbindlichkeiten aus Lieferungen und Leistungen 1.323 621 Steuerverbindlichkeiten 561 489 Sonstige Rückstellungen 6.579 7.056 Sonstige Verbindlichkeiten 9.623 13.027 Kurzfristige Verpflichtungen 65.776 68.904 SUMME PASSIVA 3.873.269 3.851.614 in T€ 01.01. – 31.03.2016 01.01. – 31.03.2015 Umsatzerlöse 50.737 50.603 Grundstücksbetriebskosten -2.235 -1.839 Grundstücksverwaltungskosten -2.529 -2.664 Nettobetriebsergebnis (NOI) 45.973 46.100 Sonstige betriebliche Erträge 168 611 Sonstige betriebliche Aufwendungen -1.556 -2.069 Ergebnis vor Zinsen und Steuern (EBIT) 44.585 44.642 Gewinn- oder Verlustanteile von assoziierten Unternehmen und Gemeinschaftsunternehmen, die nach at-equity bilanziert werden 5.473 5.358 Kommanditisten zustehende Ergebnisanteile -4.388 -4.187 Zinsaufwendungen -13.744 -14.394 Übrige Finanzerträge und -aufwendungen 394 352 Zinserträge 13 7 Finanzergebnis -12.252 -12.864 Bewertungsergebnis -1.356 -451 Ergebnis vor Steuern (EBT) 30.977 31.327 Steuern vom Einkommen und vom Ertrag -6.111 -6.008 KONZERNERGEBNIS 24.866 25.319 Ergebnis je Aktie (€), unverwässert 0,46 0,47 Ergebnis je Aktie (€), verwässert 0,45 0,45 in T€ 01.01. – 31.03.2016 01.01. – 31.03.2015 Konzernergebnis 24.866 25.319 Posten, die unter bestimmten Bedingungen zukünftig in die Gewinn- und Verlust rechnung umgegliedert werden: Effektiver Teil der Gewinne und Verluste aus Sicherungsinstrumenten bei einer Absiche- rung von Zahlungsströmen -4.798 -3.667 Latente Steuern auf direkt mit dem Eigen kapital verrechnete Wertänderungen 1.055 816 Summe des direkt im Eigenkapital erfassten Ergebnisses -3.743 -2.851 GESAMTERGEBNIS 21.123 22.468 Anteil Konzernaktionäre 21.123 22.468 Konzernbilanz 4 Deutsche EuroShop AG Quartalsmitteilung zum 31. März 2016 3M3M
- 5. Allee-Center, Magdeburg Konzern-Eigenkapitalveränderungsrechnung Konzern-Kapitalflussrechnung in T€ Anzahl Aktien im Umlauf Grundkapital Kapital rücklage Andere Gewinn rücklagen Gesetzliche Gewinn rücklage Gewinn rücklage Available- for-Sale Gewinn- rücklage Cashflow- Hedges Summe 01.01.2015 53.945.536 53.945 961.970 544.025 2.000 -7 -37.591 1.524.342 Gesamtergebnis 0 0 25.319 0 0 -2.851 22.468 31.03.2015 53.945.536 53.945 961.970 569.344 2.000 -7 -40.442 1.546.810 01.01.2016 53.945.536 53.945 961.970 783.178 2.000 -15 -33.219 1.767.859 Gesamtergebnis 0 0 24.866 0 0 -3.743 21.123 31.03.2016 53.945.536 53.945 961.970 808.044 2.000 -15 -36.962 1.788.982 in T€ 01.01. – 31.03.2016 01.01. – 31.03.2015 Ergebnis nach Steuern 24.866 25.319 Kommanditisten zustehende Ergebnisanteile 4.205 4.184 Abschreibungen auf immaterielle Vermögenswerte und Sachanlagen 20 22 Unrealisierte Marktwertveränderungen der Investment Properties 1.539 454 Nettogewinne und Verluste aus Derivaten -394 -352 Sonstige zahlungsunwirksame Aufwendungen und Erträge 865 865 Jahresergebnisse von Gemeinschafts- und assoziierten Unternehmen -826 -1.443 Latente Steuern 4.713 4.675 Operativer Cashflow 34.988 33.724 Veränderungen der Forderungen 3.766 2.796 Veränderungen kurzfristiger Rückstellungen -405 715 Veränderungen der Verbindlichkeiten -3.058 -4.142 Cashflow aus betrieblicher Tätigkeit 35.291 33.093 Auszahlungen für Investitionen in das Sach anlagevermögen / Investment Properties -1.733 -976 Ein- / Auszahlungen in das Finanzanlagevermögen 2.820 -400 Cashflow aus Investitionstätigkeit 1.087 -1.376 Auszahlung aus der Rückzahlung von Finanzverbindlichkeiten -5.362 -5.822 Auszahlungen an Kommanditisten -3.775 -3.359 Auszahlungen an Konzernaktionäre 0 0 Cashflow aus Finanzierungstätigkeit -9.137 -9.181 Veränderungen des Finanzmittelbestandes 27.241 22.536 Finanzmittelbestand am Anfang der Periode 70.699 58.284 FINANZMITTELBESTAND AM ENDE DER PERIODE 97.940 80.820 5 Deutsche EuroShop AG Quartalsmitteilung zum 31. März 2016 3M3M
- 6. Die Shoppingcenter-Aktie Nach einem Jahresschlusskurs 2015 von 40,46 € ist die Aktie der Deut- sche EuroShop in einem etwas schwachem Marktumfeld negativ in das neue Jahr gestartet. Am 11. Februar 2016 wurde der Tiefstkurs inner- halb der ersten drei Monate des Jahres mit 35,86 € erreicht. Danach stieg die Aktie in einem positiven Trend bis zu einem Periodenhöchst- kurs von 41,46 € am 17. März 2016 und lag am Ende des Berichtszeit- raums bei einem Kurs von 41,28 € nur knapp darunter. Dies entspricht einer Performance von +2,0 %. Der MDAX verlor im selben Zeitraum 1,8 %. Die Marktkapitalisierung der Deutsche EuroShop belief sich zum Ende des 1. Quartals 2016 auf 2,2 Mrd. €. 95 100 105 95 100 105 110 115 120 125 130 135 105 100 95 90 85 Deutsche EuroShop vs. MDAX und EPRA imVergleich Januar bis Mai 2016 indexierte Darstellung, Basis 100, in % Jan. Feb. Mrz. Apr. Mai Deutsche EuroShop MDAX EPRA Kennzahlen der Aktie Branche / Industriegruppe Financial Services / Real Estate Grundkapital am 31.12.2015 53.945.536,00 € Anzahl der Aktien am 31.03.2016 (nennwertlose Namensstückaktien) 53.945.536 Dividende 2015 (Vorschlag) 1,35 € Kurs am 30.12.2015 40,46 € Kurs am 31.03.2016 41,28 € Tiefst- / Höchstkurs in der Berichtsperiode 35.84 € / 41.46 € Marktkapitalisierung am 31.03.2016 2,23 Mrd. € Prime Standard Frankfurt und Xetra Freiverkehr Berlin-Bremen, Düsseldorf, Hamburg, Hannover, München und Stuttgart Indizes MDAX, EPRA, GPR 250, EPIX 30, MSCI Small Cap, EURO STOXX, STOXX Europe 600, HASPAX, F.A.Z.-Index ISIN DE 000748 020 4 Ticker-Symbol DEQ, Reuters: DEQGn.DE Aufteilung nach geografischen Segmenten in T€ Inland Ausland Überleitung Gesamt Umsatzerlöse 47.059 3.678 0 50.737 (Vorjahreswerte) (46.687) (3.916) (0) (50.603) in T€ Inland Ausland Überleitung Gesamt EBIT 42.190 3.328 -933 44.585 (Vorjahreswerte) (42.252) (3.851) (-1.461) (44.642) in T€ Inland Ausland Überleitung Gesamt Zinsergebnis -11.882 -950 -899 -13.731 (Vorjahreswerte) (-12.524) (-964) (-899) (-14.387) in T€ Inland Ausland Überleitung Gesamt Ergebnis vor Steuern (EBT) 26.323 1.760 2.894 30.977 (Vorjahreswerte) (26.625) (2.130) (2.572) (31.327) In der Überleitung sind im Wesentlichen die Jahresergebnisse der nach at-equity bilanzierten Unternehmen in Höhe von 5.473 T€ enthalten. Davon entfallen auf das Inland 3.950 T€ und auf das Ausland 1.523 T€. in T€ Inland Ausland Gesamt Segmentvermögen 3.617.578 255.691 3.873.269 (Vorjahreswerte) (3.620.695) (230.919) (3.851.614) davon Investment Properties 3.112.166 244.678 3.356.844 (Vorjahreswerte) (3.134.987) (221.668) (3.356.655) Segmentberichterstattung Die Deutsche EuroShop AG hält als Holdinggesellschaft Beteiligungen an Einkaufszentren innerhalb der Europäischen Union. Bei den jewei- ligen Beteiligungsgesellschaften handelt es sich um reine Immobilien- Haltegesellschaften ohne eigenes Personal. Das operative Management ist an externe Dienstleister im Rahmen von Geschäftsbesorgungsver- trägen vergeben, so dass die Gesellschaften ausschließlich vermögens- verwaltend tätig sind. Aufgrund der einheitlichen Geschäftstätigkeit innerhalb einer relativ homogenen Region (Europäische Union) erfolgt gemäß IFRS 8.12 eine Segmentdifferenzierung nach Inland und Ausland. Der Vorstand der Deutsche EuroShop AG als Hauptentschei- dungsträger des Konzerns beurteilt im Wesentlichen die Leistungen der Segmente nach dem EBT vor Bewertung der einzelnen Objekt gesellschaften. Die Bewertungsgrundsätze für die Segmentbericht- erstattung entsprechen denen des Konzerns. In der Überleitung werden die Eliminierungen konzerninterner Verflechtungen zwischen den Segmenten zusammengefasst. Aufgrund der geografischen Segmentierung entfallen weitere Angaben nach IFRS 8.33. Hamburg, 12. Mai 2016 Wilhelm Wellner Olaf Borkers 6 Deutsche EuroShop AG Quartalsmitteilung zum 31. März 2016 3M
- 7. FINANZKALENDER 2016 Alle Termine im Überblick 12.05. Quartalsmitteilung 3M 2016 26.05. Kempen European Property Seminar, Amsterdam 01.06. Kepler Cheuvreux German Property Day, Paris 01.06. Roadshow Warschau, Erste Securities Polska 08.06. Deutsche Bank dbAccess German Swiss Austrian Conference, Berlin 15.06. Hauptversammlung, Hamburg 15.06. Aufsichtsratssitzung, Hamburg 01.07. ESN equinet European Conference, Frankfurt 07.07. Roadshow London, Societe Generale 07.07. Roadshow Zürich, Bankhaus Lampe 08.07. Roadshow Köln-Düsseldorf, DZ Bank 08.07. Roadshow Stuttgart, ESN equinet 12.07. DSW Anlegerforum, Frankfurt 15.08. Halbjahresfinanzbericht 2016 17.08. Roadshow Helsinki, ESN equinet 13.09. Bank of America Merrill Lynch Global Real Estate Conference, New York 14.09. UBS Best of Germany Conference, New York 19.09. Goldman Sachs Berenberg German Conference, München 20.09. Baader Investment Conference, München 23.09. Aufsichtsratssitzung, Hamburg 04. – 06.10. EXPO Real, München 10.10. Roadshow Madrid, M.M. Warburg 13.10. Roadshow Brüssel, DZ Bank 14.11. Quartalsmitteilung 9M 2016 16.11. Roadshow Amsterdam, ABN AMRO 16.11. Roadshow Genf, Kepler Cheuvreux 17.11. Roadshow Zürich, Kepler Cheuvreux 22.11. Deutsches Eigenkapitalforum, Frankfurt 29.11. Aufsichtsratssitzung, Hamburg Unser Finanzkalender wird ständig erweitert. Die neuesten Termine erfahren Sie auf unserer Internetseite unter: www.deutsche-euroshop.de/ir Sie wünschen weitere Informationen? Dann besuchen Sie uns im Internet oder rufen Sie uns an: Patrick Kiss und Nicolas Lissner Tel.: +49 (0)40 - 41 35 79 20 / -22 Fax: +49 (0)40 - 41 35 79 29 www.deutsche-euroshop.de / ir E-Mail: ir@deutsche-euroshop.de Zukunftsbezogene Aussagen Diese Quartalsmitteilung enthält zukunftsbezogene Aussagen, die auf Einschätzungen künftiger Entwicklungen seitens des Vorstands ba- sieren. Die Aussagen und Prognosen stellen Einschätzungen dar, die auf Basis aller zum jetzigen Zeitpunkt zur Verfügung stehenden Infor- mationen getroffen wurden. Sollten die den Aussagen und Prognosen zugrunde gelegten Annahmen nicht eintreffen, so können die tatsäch- lichen Ergebnisse von den zurzeit erwarteten abweichen. Rundungen und Veränderungsraten Bei Prozentangaben und Zahlen in diesem Bericht können Rundungs- differenzen auftreten. Die Vorzeichenangabe der Veränderungsraten richtet sich nach wirtschaftlichen Gesichtspunkten: Verbesserungen werden mit Plus (+) bezeichnet, Verschlechterungen mit Minus (-). fühlen sehen schmecken riechen hören sehen 7 Deutsche EuroShop AG Quartalsmitteilung zum 31. März 2016 3M