
Empfohlen
Empfohlen
Weitere ähnliche Inhalte
Was ist angesagt?
Was ist angesagt? (20)
Andere mochten auch
Andere mochten auch (16)
Ähnlich wie Pipit report
Ähnlich wie Pipit report (20)
Kürzlich hochgeladen
Kürzlich hochgeladen (20)
Pipit report
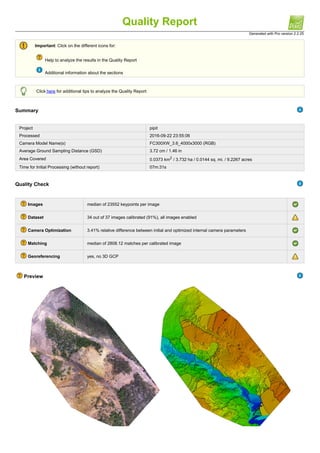
- 1. Generated with Pro version 2.2.25 Quality Report Important: Click on the different icons for: Help to analyze the results in the Quality Report Additional information about the sections Click here for additional tips to analyze the Quality Report Summary Project pipit Processed 2016-09-22 23:55:06 Camera Model Name(s) FC300XW_3.6_4000x3000 (RGB) Average Ground Sampling Distance (GSD) 3.72 cm / 1.46 in Area Covered 0.0373 km2 / 3.732 ha / 0.0144 sq. mi. / 9.2267 acres Time for Initial Processing (without report) 07m:31s Quality Check Images median of 23552 keypoints per image Dataset 34 out of 37 images calibrated (91%), all images enabled Camera Optimization 3.41% relative difference between initial and optimized internal camera parameters Matching median of 2808.12 matches per calibrated image Georeferencing yes, no 3D GCP Preview
- 3. Uncertainty ellipses 5x magnified Figure 3: Offset between initial (blue dots) and computed (green dots) image positions as well as the offset between the GCPs initial positions (blue crosses) and their computed positions (green crosses) in the top-view (XY plane), front-view (XZ plane), and side-view (YZ plane). Red dots indicate disabled or uncalibrated images. Dark green ellipses indicate the absolute position uncertainty of the bundle block adjustment result. Absolute camera position and orientation uncertainties X [m] Y [m] Z [m] Omega [degree] Phi [degree] Kappa [degree] Mean 1.331 1.331 3.307 2.977 1.810 0.755 Sigma 0.230 0.231 0.684 0.194 0.202 0.014 Overlap
- 4. Number of overlapping images: 1 2 3 4 5+ Figure 4: Number of overlapping images computed for each pixel of the orthomosaic. Red and yellow areas indicate low overlap for which poor results may be generated. Green areas indicate an overlap of over 5 images for every pixel. Good quality results will be generated as long as the number of keypoint matches is also sufficient for these areas (see Figure 5 for keypoint matches). Bundle Block Adjustment Details Number of 2D Keypoint Observations for Bundle Block Adjustment 103452 Number of 3D Points for Bundle Block Adjustment 38279 Mean Reprojection Error [pixels] 0.176 Internal Camera Parameters FC300XW_3.6_4000x3000 (RGB). Sensor Dimensions: 6.317 [mm] x 4.738 [mm] EXIF ID: FC300XW_3.6_4000x3000 Focal Length Principal Point x Principal Point y R1 R2 R3 T1 T2 Initial Values 2285.714 [pixel] 3.610 [mm] 2000.000 [pixel] 3.159 [mm] 1500.000 [pixel] 2.369 [mm] 0.000 0.000 0.000 0.000 0.000 Optimized Values 2363.775 [pixel] 3.733 [mm] 1996.614 [pixel] 3.153 [mm] 1506.984 [pixel] 2.380 [mm] -0.016 0.015 0.001 -0.000 -0.000 Uncertainties (Sigma) 23.287 [pixel] 0.037 [mm] 1.244 [pixel] 0.002 [mm] 0.733 [pixel] 0.001 [mm] 0.001 0.002 0.001 0.000 0.000
- 5. The number of Automatic Tie Points (ATPs) per pixel averaged over all images of the camera model is color coded between black and white. White indicates that, in average, more than 16 ATPs are extracted at this pixel location. Black indicates that, in average, 0 ATP has been extracted at this pixel location. Click on the image to the see the average direction and magnitude of the reprojection error for each pixel. Note that the vectors are scaled for better visualization. 2D Keypoints Table Number of 2D Keypoints per Image Number of Matched 2D Keypoints per Image Median 23552 2808 Min 23181 200 Max 24772 7950 Mean 23700 3043 3D Points from 2D Keypoint Matches Number of 3D Points Observed In 2 Images 26028 In 3 Images 6377 In 4 Images 2588 In 5 Images 1247 In 6 Images 719 In 7 Images 483 In 8 Images 323 In 9 Images 171 In 10 Images 143 In 11 Images 85 In 12 Images 50 In 13 Images 32 In 14 Images 21 In 15 Images 9 In 16 Images 1 In 17 Images 2 2D Keypoint Matches
- 6. Uncertainty ellipses 100x magnified Number of matches 25 222 444 666 888 1111 1333 1555 1777 2000 Figure 5: Computed image positions with links between matched images. The darkness of the links indicates the number of matched 2D keypoints between the images. Bright links indicate weak links and require manual tie points or more images. Dark green ellipses indicate the relative camera position uncertainty of the bundle block adjustment result. Relative camera position and orientation uncertainties X [m] Y [m] Z [m] Omega [degree] Phi [degree] Kappa [degree] Mean 0.058 0.060 0.057 0.071 0.095 0.024 Sigma 0.033 0.031 0.033 0.033 0.051 0.013 Geolocation Details
- 7. Absolute Geolocation Variance Min Error [m] Max Error [m] Geolocation Error X [%] Geolocation Error Y [%] Geolocation Error Z [%] - -15.00 0.00 0.00 0.00 -15.00 -12.00 0.00 0.00 0.00 -12.00 -9.00 0.00 0.00 0.00 -9.00 -6.00 0.00 0.00 0.00 -6.00 -3.00 0.00 0.00 2.94 -3.00 0.00 47.06 41.18 35.29 0.00 3.00 52.94 58.82 61.76 3.00 6.00 0.00 0.00 0.00 6.00 9.00 0.00 0.00 0.00 9.00 12.00 0.00 0.00 0.00 12.00 15.00 0.00 0.00 0.00 15.00 - 0.00 0.00 0.00 Mean [m] -0.000000 -0.000000 -0.000001 Sigma [m] 1.113721 0.470979 0.879307 RMS Error [m] 1.113721 0.470979 0.879307 Min Error and Max Error represent geolocation error intervalsbetween -1.5 and 1.5 times the maximum accuracy of all the images. Columns X, Y, Z show the percentage of images with geolocation errors within the predefined error intervals. The geolocation error is the difference between the intial and computed image positions. Note that the image geolocation errors do not correspond to the accuracy of the observed 3D points. Relative Geolocation Variance Relative Geolocation Error Images X [%] Images Y [%] Images Z [%] [-1.00, 1.00] 100.00 100.00 100.00 [-2.00, 2.00] 100.00 100.00 100.00 [-3.00, 3.00] 100.00 100.00 100.00 Mean of Geolocation Accuracy [m] 5.000000 5.000000 10.000000 Sigma of Geolocation Accuracy [m] 0.000000 0.000000 0.000000 Images X, Y, Z represent the percentage of images with a relative geolocation error in X, Y, Z. Geolocation Orientational Variance RMS [degree] Omega 1.585 Phi 1.384 Kappa 3.757 Geolocation RMS error of the orientation angles given by the difference between the initial and computed image orientation angles. Initial Processing Details System Information Hardware CPU: Intel(R) Core(TM) i5-4258U CPU @ 2.40GHz RAM: 4GB GPU: no info (Driver: unknown) Operating System Darwin 15.6.0 x86_64
- 8. Coordinate Systems Image Coordinate System WGS84 (egm96) Output Coordinate System WGS84 / UTM zone 50N (egm96) Processing Options Detected Template 3D Maps Keypoints Image Scale Full, Image Scale: 1 Advanced: Matching Image Pairs Aerial Grid or Corridor Advanced: Matching Strategy Use Geometrically Verified Matching: no Advanced: Keypoint Extraction Targeted Number of Keypoints: Automatic Advanced: Calibration Calibration Method: Standard Internal Parameters Optimization: All External Parameters Optimization: All Rematch: Auto, yes Point Cloud Densification details Processing Options Image Scale multiscale, 1/2 (Half image size, Default) Point Density Optimal Minimum Number of Matches 3 3D Textured Mesh Generation yes 3D Textured Mesh Settings: Resolution: Medium Resolution (default) Color Balancing: no Advanced: 3D Textured Mesh Settings Sample Density Divider: 1 Maximum Number of Triangles per Leaf: 8 Advanced: Matching Window Size 7x7 pixels Advanced: Image Groups group1 Advanced: Use Processing Area yes Advanced: Use Annotations yes Advanced: Limit Camera Depth Automatically no Time for Point Cloud Densification 04m:02s Time for 3D Textured Mesh Generation 02m:09s Results Number of Processed Clusters 6 Number of Generated Tiles 1 Number of 3D Densified Points 945229 Average Density (per m3) 43.74 DSM, Orthomosaic and Index Details Processing Options DSM and Orthomosaic Resolution 1 x GSD (3.72 [cm/pixel]) DSM Filters Noise Filtering: yes Surface Smoothing: yes, Type: Sharp