SlideShare ist ein Scribd-Unternehmen logo
1 von 11
Downloaden Sie, um offline zu lesen
ELEVATED TEMPERATURE MECHANICAL CHARACTERIZATION OF ISOGRID BOOMS 
Stephen E. Scarborough* and David P. Cadogan† – ILC Dover, Inc., Frederica, DE 
Lauren M. Pederson‡ and Joseph R. Blandino§* – James Madison University, Harrisonburg, VA 
Gary L. Steckel∋ and Wayne K. Stuckey¶ – The Aerospace Corporation, El Segundo, CA 
1 
Abstract 
Structurally efficient isogrid booms, manufactured 
from rigidizable composite materials, are becoming an 
enabling technology for spacecraft structures because 
of their high packing efficiency. Selection of the 
materials used in the construction of rigidizable space 
structures is commonly driven by mechanical 
performance properties at elevated temperatures. 
Mechanical properties testing was performed on 
composite tow samples and on an isogrid boom at 
various temperatures. To characterize elevated 
temperature behavior, the isogrid booms, and its sub-element 
composite tows were manufactured from 
ILC’s TP283E shape memory polymer (SMP) matrix 
resin and a carbon reinforcement. Both the flexural 
modulus and the tensile modulus of the composite tow 
samples were determined as a function of temperature. 
These values were compared to the calculated values 
for the composite based on rule of mixtures analysis. 
The predicted rule of mixtures composite modulus is 
used in ILC’s isogrid analytical code to predict the 
structural properties of the isogrid boom. A number of 
composite tow samples were fabricated by ILC and 
mechanically characterized by the Aerospace 
Corporation to gather independent performance data. 
An isogrid boom was fabricated by ILC and 
mechanically characterized at elevated temperatures by 
James Madison University (JMU). JMU tested this 
boom in tension, compression, and also performed 
preliminary creep testing at various temperatures. A 
similar isogrid boom was fabricated by ILC and tested 
by The Aerospace Corporation for composite CTE 
performance. This paper discusses the results of both 
the composite tow testing and the isogrid boom testing 
in pre- and post-packing conditions. A discussion of 
the correlation between the predicted values and the 
actual test values is also presented. 
Introduction 
NASA and DoD space missions in the near future will 
require much larger satellites, the sizes of which will 
be beyond the capabilities of current technologies. The 
types of Gossamer 
spacecraft that will be 
needed include 
antennas, solar arrays, 
sunshields, solar sails, 
and telescopes (Figs. 
1-2). Some systems 
being considered are 
hundreds of meters in 
size to accomplish 
mission goals. Due to 
the increase in payload 
size required, 
innovative support 
structures, which can 
be packed into the 
faring of available 
launch vehicles, must 
be developed. In recent 
years, research and 
development work has 
been performed in this 
area1-3. Of the 
available options, one 
of the most promising 
technological advancements is the rigidizable 
inflatable structure. A rigidizable inflatable structure is 
one that is fabricated on Earth, packed into the launch 
container, and inflated for deployment once on orbit1,3. 
After deployment, the material is rigidized, or 
hardened, to form a stiff composite structure that no 
longer needs the inflation gas for support. This class of 
structures has unique benefits such as low packing 
volume, reduced mass, and in most cases, very high 
deployed structural efficiency3,4. 
Several types of construction can be used in a 
rigidizable inflatable including monocoque, isogrid, 
IsoTruss, and truss-frame booms. Each composite 
structure can be fabricated into a varying geometric 
shapes utilizing any number of resin and fiber types5. 
The fibrous reinforcement can be in tow or woven 
fabric form. In order to optimize the structure, the sizes 
of the tows and the weave styles of the fabrics can be 
varied5. It is also possible to manufacture near-zero 
coefficient of thermal expansion (CTE) booms through 
the fiber and resin selection and by optimizing the 
volume fractions of each5. However, key to all 
mechanical performance properties is the ability to fold 
and tightly pack the material. 
*Member AIAA 
† Associate Fellow AIAA 
‡Undergraduate Research Assistant, Dept. of Int. Science and Tech. 
§Associate Professor, Dept. of Int. Science and Tech. 
∋Senior Scientist, Materials Sciences Dept. 
¶Distinguished Scientist, Space Materials Lab 
American Institute of Aeronautics and Astronautics 
Figure 1. ½ Scale Next 
Generation Space 
Telescope Sunshield 
Figure 2. ILC 3.2m Diameter 
TSU Hexapod Testbed
2 
Isogrid Design and Construction 
One of the most advanced inflatable rigidizable 
structures is the isogrid boom, which consists of a grid-work 
of equilateral triangles1,3,6. These equilateral 
triangles give the overall structure isotropic mechanical 
properties1,3. One of the isogrid booms fabricated for 
this study is shown in Figure 3 (patent pending). This 
type of boom has a circular cross-section 
and is encased on both sides 
with a polymeric film such as 
polyimide1,3. The inner film layer 
acts as a bladder or gas-retaining 
layer for inflation. The outer later, 
called the anti-blocking layer, is used 
to prevent the structure from 
adhering (blocking) to itself when it 
is in the packed configuration1,3. The 
outer layer can also act as the first 
layer in a mult-layered insulation 
(MLI) blanket. ILC Dover has 
developed analytical modeling 
techniques to predict the properties 
of this structure1,3,6. ILC has studied 
the room temperature mechanical 
properties of this structure 
extensively, but there is still a need 
for further work to be performed to 
fully characterize the performance of 
the structure, especially at elevated 
temperatures1,3. 
Materials 
A leading rigidizable material candidate is the shape 
memory composite 1-5, 7,8. The composite consists of a 
fibrous reinforcement, such as carbon, and a polymeric 
matrix resin such as polyurethane or epoxy. The resin 
is initially consolidated at a high temperature, called 
the set temperature, to form a high modulus, rigid 
structure. This initial heating and consolidation event 
defines the shape of the structure. Subsequent heating 
events above the material’s glass transition 
temperature (Tg) lowers the modulus of the material 
significantly and allows the structure to be tightly 
packaged (Fig. 4). If 
constrained and cooled below 
Tg while packed, the 
composite modulus will 
increase and the material will 
retain the packed shape, even 
if the package is 
unconstrained. Upon re-heating, 
American Institute of Aeronautics and Astronautics 
the material 
experiences a large decrease 
in modulus and can therefore 
be deployed back to its as-manufactured state. Once 
the deployed structure cools below the Tg, the modulus 
will increase and the inflation gas is no longer required 
for structural support. This process of packing and 
deploying the structure is repeatable which allows 
flight hardware to be packed and deployed for 
evaluation several times during ground test prior to 
launch and deployment in space. The thermoplastic 
resin has some degree of shape memory upon heating, 
which causes the structure to attempt to return to its as-manufactured 
state. However, this shape memory force 
is weak relative to the force required to deploy the 
composite structure and associated systems, therefore 
this force must usually be augmented by inflation gas. 
Material Properties 
In this study, ILC Dover’s TP283E epoxy resin was 
used to manufacture all of the test samples. The resin 
system has reduced cross-link functionality in order to 
add increased flexibility above the Tg as compared to 
typical epoxy resin systems. TP283E therefore exhibits 
thermoplastic behavior with the only exception being 
that it does not have a melt temperature. ILC chose 
Hexcel’s IM9 carbon fiber as the reinforcement for all 
of the test samples discussed herein. IM9 was chosen 
because of its balance of high mechanical properties 
and high strain to failur1,3,8. The properties of this fiber 
are listed in Table 1. 
Table 1. IM9 (12K) Carbon Fiber Properties9 
Property English Units SI Units 
Tensile Modulus 42.0 x 10⁶ psi 290Gpa 
Tensile Strength 890,000 psi 6,141 MPa 
Ultimate Elongation 2.1% 2.1.% 
Axial CTE∝ -0.228 ppm/oF -0.5 ppm/oC 
Density 0.0650 lb/in3 1.80 g/cm3 
Filament Diameter 0.175 mil 4.4 microns 
Filament shape Round Round 
Weight/Length 18.8 x 10⁻⁶ lb/in 0.335 g/m 
Fiber Cross-Sectional Area 2.89x10⁻⁴in2 0.19mm2 
∝Estimate 
In earlier studies, assumptions were made based on test 
data from similar resins to predict the mechanical 
properties of TP283E resin in order to eliminate the 
overall amount of testing required in initial 
development1,3,8. To determine the actual properties of 
the resin using an independent test lab, a resin sample 
was manufactured by ILC and sent to The Aerospace 
Corporation for mechanical characterization. The 
elastic modulus of the neat resin was tested using the 3- 
point bending method on a TA Instruments Inc., 
Dynamic Mechanical Analysis (DMA) system. From 
this testing, the average elastic modulus at 23°C for 5 
samples of TP283E resin was determined to be 500 ± 
20 ksi (Fig. 5). 
Figure 3. ILC 
Isogrid Boom: 
Figure 4. Z-Folded 
7” Diameter, 39” 
Long Isogrid 
Boom
3 
2 
1.8 
1.6 
1.4 
1.2 
1 
0.8 
0.6 
0.4 
0.2 
Using the cantilever bending function on the DMA, The 
Aerospace Corporation determined from the loss 
modulus peak that the Tg of the resin was 55oC at a 
frequency of 1 Hz. Three tow samples extracted from 
an isogrid boom were also tested using DMA (Fig. 6). 
The results from these tests indicate that the Tg is 
between 57oC-61oC. Earlier Differential Scanning 
Calorimetry (DSC) testing performed at ILC indicated 
that TP283E had a Tg of 48oC1. Differences in the test 
methods and slight deviations in the set temperatures 
are the likely causes of the variation in the Tg results. 
Therefore, depending on the set temperatures, TP283E 
can be made to have a Tg in the range of 48-61oC. 
Tg = 57.55oC 
The flexural modulus of TP283E resin over the 
temperature range from -150°C to +50°C was also 
tested. Tests were performed on sample numbers 
B3−B7, which were approximately 2.3-inches long, 
0.35-inches wide, and 0.12-inches thick. They were 
tested using the 2-in. span of the DMA 3-Point Bend 
fixture. Peak loads were varied for the different test 
temperatures because the neat resin samples had 
increasingly lower moduli at higher temperatures. 
The temperature sequence was 23, 30, 35, 40, and 
50°C. At the end of each test the force was set to 0 N. 
The force was then maintained at 0 N during heating to 
the next test temperature and during the 5-minute 
thermal equilibration at the test temperature. After the 
5-minute thermal equilibration at the test temperature, 
the static force was then set to 0.01 N and immediately 
ramped to the final force. Good modulus data were 
obtained for all test temperatures for sample B7 (Fig. 
7). Modulus values for sample B7 were similar to those 
for sample B6 for all test temperatures. 
1.6 
1.4 
1.2 
1.0 
0.8 
0.6 
0.4 
0.2 
After the modulus testing was completed, the valid 
modulus data for samples B3−B7 were tabulated and 
plotted as functions of temperature. It was determined 
that two linear curve fits could be used to describe the 
data. A straight line with a relatively low slope (-1.3 
ksi/°C) was fit to the data for -150 to 23°C and a 
straight line with a much higher slope (18.7 ksi/°C) was 
fit to the data for 23 to 50°C (Fig. 8). The two curves 
intersect at 25°C. 
1000000 
900000 
800000 
700000 
600000 
500000 
400000 
300000 
200000 
100000 
American Institute of Aeronautics and Astronautics 
0 
0.0 0.1 0.2 0.3 0.4 0.5 
Flexural Strain, % 
Flexural Stress, ksi 
No. 1 
No. 2 
No. 3 
No. 4 
No. 5 
E = 535 ksi 
E = 501 ksi 
E = 493 ksi 
E = 490 ksi 
E = 482 ksi 
Average E = 500 + 20 ksi 
(0.04 to 0.25% Strain) 
Figure 5. Elastic Modulus at 23oC of TP283E Resin 
Flexural Stress-Strain Curve 
TP283E Sample No. B7 
0.0 
0 0.002 0.004 0.006 
Flexural Strain, in/in 
Flexural Stress, ksi 
25C, E = 445 ksi 
32C, E = 362 ksi 
36C, E = 261 ksi 
41C, E = 72 ksi 
45C, E = 49 ksi 
50C, E = 22 ksi 
Figure 7. TP283E Elastic Modulus Vs. Temperature 
TP283E Elastic Modulus versus Temperature 
0 
-150 -125 -100 -75 -50 -25 0 25 50 
Temperature, oC 
Elastic Modulus, psi 
Sample Nos. B3-B7 
Bi-linear Curve Fit 
Bi-linear Curve Fit 
E = -1340T + 481,000 psi (-150 to 25oC) 
E = -18,700T + 919,000 psi (25 to 50oC) 
Figure 8. Bi-linear Curve Fit of TP283E Modulus 
Figure 6. TP283E/IM9 Tow #29 DMA Tg Results
4 
The Aerospace Corporation also tested the coefficient 
of thermal expansion (CTE) of the TP283E neat resin. 
CTE measurements were made on three TP283E epoxy 
samples over the temperature range of -100 to +50°C 
using a TA Instruments, Inc., Thermal Mechanical 
Analyzer (TMA). The three samples were prepared 
with the sample length parallel to the length, width, and 
thickness, respectively, of the ILC TP283E cast panel. 
The thermal expansion curves for the three samples 
were essentially identical and the data for the 3 samples 
were combined into one file. Various methods of curve 
fitting the CTE data for the 3 samples were attempted 
with the best curve fit obtained by two 2nd order 
polynomial equations. A curve fit of the data from -100 
to +20°C gave a CTE = 0.135T + 59.35 ppm/°C. A 
curve fit of the data from +20 to +50°C gave a CTE = 
2.91T – 2.43 ppm/°C (Fig. 9). 
TP283E Thermal Expansion 
CTE = 2.91T - 2.43 ppm/oC 
(20 to 50oC) 
Rule of Mixtures Predictions 
4000 
2000 
0 
-2000 
-4000 
-6000 
Rule of mixtures (ROM) CTE and modulus calculations 
were made for unidirectional IM9/TP283E composites 
using the fiber properties listed in Table 1 and the 
TP283E epoxy matrix modulus and CTE values given 
by the aforementioned equations. The ROM equations 
used are listed as equations (1) and (2). The ROM 
predictions were made over the temperature range of – 
100 to +50°C for fiber contents of 35, 40, 45, 50, 55, 
and 60 percent fiber volume fraction (Figs. 10 and 11). 
1.1 
0.9 
0.7 
0.5 
0.3 
0.1 
-0.1 
-0.3 
ROM Elastic Modulus Prediction for 
Unidirectional IM9/TP283E 
Ef = 42 msi, CTEf = -0.5 ppm/oC 
30 
25 
20 
15 
10 
5 
Ef = 42 Msi 
Em = -0.00134T + 0.481 msi (-150 to 25oC); = -0.0187T + 0.919 msi (26 to 50oC) 
CTEm = 0.135T + 59.35 ppm/oC (-100 to 25oC); = 2.91T - 2.43 ppm/oC (26 to 50oC) 
As can be seen from Figure 10, the composite modulus 
is not affected appreciably by the modulus of the resin; 
instead it is fiber modulus and volume fraction 
dominated. Therefore, even though the modulus of 
TP283E decreases significantly at 50oC, the composite 
modulus does not. Figure 11 illustrates the point that 
rigidizable materials can be made to exhibit near zero 
CTE through proper material selection and fiber 
volume fraction control. It is apparent from this graph 
that composite CTE is more dependent on the modulus 
of the resin than is composite modulus. 
Tow Tensile Test Results 
The Aerospace Corporation also mechanically 
characterized composite tow samples during this study. 
The tow samples were manufactured by ILC using the 
same methods as the isogrid booms. All samples 
discussed herein are made from TP283E/IM9 (48K) 
carbon fiber tows. The fiber volume fraction of each 
sample was measured non-destructively by accurately 
measuring the mass and length of each sample and then 
using the resin and fiber densities to calculate the 
:= (2) 
American Institute of Aeronautics and Astronautics 
-8000 
-150 -100 -50 0 50 100 
Temperature, oC 
(L - L23)/L23, ppm 
Data for 3 Samples 
Curve Fits 
CTE = 0.135T + 59.35 ppm/oC 
(-100 to 20oC) 
Figure 9. Curve Fit of Avg. TP283E CTE Results 
ROM CTE Predictions for Unidirectional 
IM9/TP283E 
-0.5 
-100 -75 -50 -25 0 25 50 
Temperature, oC 
Composite CTE, ppm/oC 
35 vol.% Fiber 40 vol.% Fiber 
45 vol.% Fiber 50 vol.% Fiber 
55 vol.% Fiber 60 vol.% Fiber 
Figure 11. Rule of Mixtures CTE Predictions 
0 
-150 -125 -100 -75 -50 -25 0 25 50 
Temperature (oC) 
Composite Modulus 
(Msi) 
Vf=35% Vf=40% 
Vf=45% Vf=50% 
Vf=55% Vf=60% 
Em = -1340T + 481,000 psi (-150 to 25oC) 
Em = -18,700T + 919,000 psi (25 to 50oC) 
Figure 10. Rule of Mixtures Modulus Predictions 
E c := E f⋅v f + Em⋅v m (1) 
α c 
α f⋅E f⋅v f + α m⋅Em⋅v m 
E f⋅v f + Em⋅v m 
where αc = axial composite CTE 
αf and αm = fiber and matrix CTE 
Ef,Em,Ec = fiber, matrix, and axial composite modulus 
vf and vm = fiber and matrix volume fraction
5 
volume fraction. The 
fiber volume fractions 
were recorded prior to 
testing in order to 
normalize the data and to 
correlate it with the 
predicted ROM values. 
After manufacturing, the 
tow samples were bonded 
into G10 grip tabs as 
shown in Figure 12. 
The tow tensile tests were performed using an Instron 
universal testing machine set up with 1,000-lb grips 
with 2-inch long serrated grip faces and a 1,000-lb load 
cell. An extensometer was placed on each sample 
during testing to measure strain. The samples were 
tested at a crosshead rate of 0.1 in./min (strain rate ≤ 
0.033 in./in./min). Young’s modulus, ultimate tensile 
strength, and failure strain were measured. Young’s 
modulus, E, was calculated from a linear regression of 
stress versus strain data from 0.05 to 0.50% strain. The 
position of the extensometer was varied during the 
testing. The gauge length of the extensometer was 1.0- 
inches. All samples were loaded to 400-lb (130 ksi, 
0.8% strain) and unloaded twice for the initial modulus 
measurements. The modulus test values were then 
normalized to 60% fiber volume fraction and compared 
to ROM predictions. 
Six pristine tows (no folding and deployment cycles) 
were tensile tested during this study (Table 2). When 
normalized to 60% fiber volume fraction, the average 
room temperature modulus of the pristine TP283E/IM9 
(48K) twisted tows was 24.8-Msi ± 0.3-Msi, which 
compares well with the rule of mixtures in Figure 10. 
Table 2. TP283E/IM9 (48K) Pristine Tow Tensile Results 
No.# Vf E, Measured, 
160 
140 
120 
100 
80 
60 
40 
20 
American Institute of Aeronautics and Astronautics 
Msi 
E, Normalized to 
60% Vf 
% ROM Em = 
0.5 
3S 0.385 15.5 23.3 94 
3R 0.385 15.3 23.0 93 
3R 0.385 15.4 23.1 93 
6R 0.397 16.4 24.8 97 
6S 0.397 16.4 24.8 97 
6R 0.397 16.4 24.8 97 
9R 0.380 15.8 24.9 97 
9S 0.380 15.9 25.1 98 
9S 0.380 15.8 24.9 97 
7aE 0.394 16.2 24.7 96 
7aR 0.394 16.0 24.4 95 
7aR 0.394 16.4 25.0 97 
7bS 0.411 17.3 25.3 99 
7bR 0.411 17.0 24.8 97 
7bR 0.411 16.9 24.7 96 
1a 0.337 14.1 25.1 97 
30 0.465 18.9 24.4 95 
#Extensometer on smooth side of tow (S), rough side (R), or on edge (E) between 
smooth and rough sides 
Five of the six pristine tensile samples were tested to 
failure and had tensile strengths within 11% of the fiber 
ultimate tensile strength (UTS). Samples 3, 6, 9, 7 and 
1a failed at 315-ksi, 343-ksi, 305-ksi, 311-ksi, and 320- 
ksi, respectively. 
The Aerospace Corporation also investigated the effect 
of temperature on the tensile modulus of the tow 
samples (Fig. 13). The results of this experiment show 
that over the measured range the composite tow tensile 
modulus is not effected by temperature, which agrees 
well with the rule of mixtures predictions in Figure 10. 
Note that some bending occurred at low loads at 80 and 
96°C and was most likely due to the weight of the 
extensometer. 
Vf=48% 
The effect of folding on 
composite tow samples 
was also examined. 
After being processed at 
their initial set 
temperature, tow 
samples were heated to a 
temperature of 100- 
105oC and folded 180 
degrees over a 5/32-inch 
(4-mm) radius as seen in 
the X-ray photograph in 
Figure 14. The samples 
were constrained in the folded position as they cooled. 
Once cooled to room temperature, they were released 
from the constraining mechanism. Samples were then 
heated again and allowed to return to shape via the 
shape memory recovery force of the material (Fig. 15). 
This process was repeated 1, 3, or 5 times in order to 
determine the possible effects of packaging and 
deploying structures fabricated from these materials. 
Note that the nano-X-ray of the TP283E/IM9 (48K) tow 
shown in Figure 14, which was folded one time over a 
15/32-inch radius, revealed no fiber damage. 
Figure 12. Tow Tensile 
Test Samples 
0 
0.0 0.2 0.4 0.6 0.8 1.0 
Tensile Strain, % 
Tensile Stress, ksi 
48C 
62C 
80C 
96C 
29C 
Figure 13. Tensile Stress vs. Strain: Sample 10a 
Figure 14. X-ray of Folded 
TP283E/IM9 (48K) Tow
6 
Tensile testing was 
performed on five 
composite tow samples that 
were folded and deployed 
one time (Table 3). When 
normalized to 60% fiber 
volume fraction, the 
average room temperature 
modulus of the 
TP283E/IM9 (48K) tows 
after being packed and 
deployed once over a 5/32- 
inch radius is 24.6 MSI ± 
2.5 MSI. This value is 
close to the rule of mixtures 
prediction in Figure 10, and 
agrees with data collected 
using pristine tows, indicating that folding one time 
over a 15/32-inch radius has no effect on the tensile 
modulus of the composite tow. Two of these samples 
were tensile tested to failure. Sample 12 failed at 338- 
ksi (99% fiber UTS) while sample 13 failed at 292-ksi 
(78% fibers UTS). 
Table 3. TP283E/IM9 (48K) Tow Tensile Results; 1 Fold 
No.# Vf E, Measured, 
160 
140 
120 
100 
80 
60 
40 
20 
0 
Fold Outside 
Fold Inside 
Fold Edge 
E = 16.9 msi (102% ROM) 
extensometer on fold edge 
0.0 0.2 0.4 0.6 0.8 1.0 
Tensile Stress, ksi 
Figure 16. Tensile Stress vs. Strain: Sample 12, 
Packed and Deployed Via Shape Memory Once 
160 
140 
120 
100 
80 
60 
40 
20 
American Institute of Aeronautics and Astronautics 
msi 
E, Normalized to 
60% Vf 
% ROM 
Em = 0.5 
11-OD 0.467 19.7 25.3 99 
12-OD 0.390 17.2 26.5 103 
12-ID 0.390 14.1 21.7 85 
12-E 0.390 16.9 26.0 101 
12-E 0.390 16.8 25.8 101 
13-OD 0.428 18.9 26.5 103 
13-ID 0.428 15.7 22.0 86 
13-E 0.428 17.7 24.8 97 
13-E 0.428 18.3 25.7 100 
15-OD 0.389 17.6 27.1 106 
15-ID 0.389 12.6 19.4 76 
15-E 0.389 17.2 26.5 103 
16-OD 0.446 19.7 26.5 104 
16-ID 0.446 15.1 20.3 79 
16-E 0.446 18.4 24.8 97 
# OD=extensometer on outside of tow fold diameter; ID=extensometer on inside of tow fold 
diameter; E=extensometer on edge between OD and ID sides 
The results indicate that the composite tow tensile 
modulus of the folded samples varies with the 
extensometer location relative to the fold direction. 
The modulus measured on the fold edge matched 
extremely well with the ROM predictions, while the 
measured modulus was much lower on the inside edge 
(Fig. 16). 
It was determined that the folding and deployment 
process using shape memory resulted in fiber kinks on 
the compression side of the fold, which causes a large 
displacement on the inside of the fold at low loads. The 
outside of the tows did not have the same displacement 
effects because the fibers are placed in tension in this 
area of the tow. The kinks in the fiber on the inside of 
the fold were removed at approximately 30-ksi, which 
is a high stress relative to the expected loads in actual 
application. Tow samples from tubes that were 
deployed via inflation were also tested and did not 
exhibit this fiber kinking behavior due to the relatively 
high stress of the inflation pressure as compared to the 
shape memory recovery stress of the resin. 
Tensile Strain, % 
In order to determine the stress required to remove the 
fiber kinks of the packed and deployed tows at different 
temperatures, one composite tow sample was tensile 
tested at temperatures up to 96oC (Fig. 17). The results 
indicate that fiber kinks are removed at lower stresses 
as the temperature increases. Also, high temperature 
loading permanently removes fiber kinks as illustrated 
by the nearly linear stress-strain curve at 24°C 
following loading at 96°C. Note that large deformations 
at low loads at high temperatures may be due to the 
weight of the extensometer. These results indicate that 
it is possible to remove any fiber kinks in the tows of 
the isogrid boom by carefully controlling the 
deployment temperature and the inflation pressure. 
0 
0 0.2 0.4 0.6 0.8 1 
Tensile Strain, % 
Tensile Stress, ksi 
35C 
60C 
82C 
96C 
24C 
Extensometer on ID side of fold 
Figure 17. Tensile Stress vs. Strain at Elevated 
Temp.; Tow 16, 1 fold and deployment cycle 
Figure 15. TP283E/IM9 
(48K) Tow Samples 
Returned to Shape 
After Folding
7 
Three composite tow samples were tensile tested after 
being packed and deployed three times (Table 4). The 
results indicate that there are fiber kinks on the inside of 
the fold similar to that seen in the results for one fold 
and deployment cycle (Fig. 18). The average room 
temperature tensile modulus of the three TP283E/IM9 
(48K) tows after three folds is 23.7 MSI ± 1.8 MSI 
when the data is normalized to 60% fiber volume 
fraction. All three samples were tensile tested to 
failure. Samples 31, 32, and 33 failed at 340-ksi (91% 
fiber UTS), 389-ksi (101% fiber UTS), and 392-ksi 
(103% fiber UTS), respectively. The results of these 
tests indicate that there is no degradation in tensile 
properties from three 180-degree folding and 
deployment cycles over a 15/32-inch radius. 
Table 4. TP283E/IM9 (48K) Tensile Test Results; 3 folds 
400 
300 
200 
100 
0 
Fold Outside 
Fold Inside 
Fold Edge 
UTS = 380 ksi (99% ROM) 
E = 18.0 msi (99% ROM) 
extensometer on fold edge 
0.0 0.2 0.4 0.6 0.8 1.0 1.2 1.4 1.6 1.8 2.0 2.2 
Tensile Stress, ksi 
Figure 19. Tensile Stress vs. Strain: Tow 34; 5 folds 
UTS = 389 ksi (99% ROM) 
American Institute of Aeronautics and Astronautics 
No.# Vf E, Measured, 
msi 
E, Normalized 
to 60% Vf 
% ROM 
Em = 0.5 
31-OD 0.427 18.2 25.6 100 
31-ID 0.427 15.2 21.4 83 
31-E 0.427 16.7 23.5 92 
31-ID-2 0.427 15.4 21.6 85 
32-OD 0.441 18.8 25.6 100 
32-ID 0.441 15.5 21.1 82 
32-E 0.441 17.8 24.2 95 
33-OD 0.434 18.8 26.0 102 
33-ID 0.434 17.1 23.6 92 
33-E 0.434 17.5 24.2 95 
# OD=extensometer on outside of tow fold diameter; ID=extensometer on inside of tow fold 
diameter; E=extensometer on edge between OD and ID sides 
400 
300 
200 
100 
Three composite tow samples were tensile tested after 
being packed and deployed five times (Table 5). The 
results show that there is residual bending on the inside 
of the fold similar to that seen in the results for one fold 
and three fold and deployment cycles (Fig. 19). The 
average room temperature tensile modulus of the three 
TP283E/IM9 (48K) tows after five folds is 23.9 MSI ± 
1.8 MSI when the data is normalized to 60% fiber 
volume fraction. 
Table 5. TP283E/IM9 (48K) Tensile Test Results; 5 folds 
No.# Vf E, Measured, 
msi 
E, Normalized 
to 60% Vf 
% ROM 
Em = 0.5 
34-OD 0.431 18.6 25.9 101 
34-ID 0.431 16.9 23.5 92 
34-E 0.431 18.0 25.1 98 
35-OD 0.484 20.3 25.2 99 
35-ID 0.484 16.7 20.7 81 
35-E 0.484 19.3 23.9 94 
36-OD 0.450 18.9 25.2 99 
36-ID 0.450 16.1 21.5 84 
36-E 0.450 18.4 24.5 96 
# OD=extensometer on outside of tow fold diameter; ID=extensometer on inside of tow fold 
diameter; E=extensometer on edge between OD and ID sides 
All three samples were tensile tested to failure. 
Tensile Strain, % 
Samples 34, 35, and 36 failed at 380-ksi (100% fiber 
UTS), 324-ksi (77% fiber UTS), and 381-ksi (97% fiber 
UTS), respectively. The results of these tests indicate 
that there is no degradation in tensile modulus from five 
180-degree folding and deployment cycles over a 
15/32-inch radius. However, one tow (#35) had visual 
fiber damage after five folds and experienced a 25% 
reduction in tensile strength. 
Tow Flexural Modulus Test Results 
The composite tow flexural modulus tests were 
performed using the 3-point bending fixture of the 
(DMA) using a similar procedure as that used to test the 
neat resin samples. The tow used for this test had a 
fiber volume fraction of 59% and was cut from the end 
of the isogrid test tube (#042) characterized by JMU. 
The results in Figure 20 show that the flexural modulus 
of the composite tow sample decreases 86% at 100oC, 
which is a similar result to that obtained during the neat 
TP283E resin flexural modulus testing. Table 6 shows 
the strain ranges that were used to calculate the 
modulus values at the different test temperatures. 
0 
0.0 0.2 0.4 0.6 0.8 1.0 1.2 1.4 1.6 1.8 2.0 2.2 
Tensile Strain, % 
Tensile Stress, ksi 
Fold Outside 
Fold Inside 
Fold Edge 
E = 17.8 msi (95% ROM) 
extensometer on fold edge 
Figure 18. Tensile Stress Vs. Strain: Sample 32; 3 
folds
8 
Flexural Stress-Strain Curve 
IM9 (48K)/TP283E Tow No. 37 
100 
80 
60 
40 
20 
Tow extracted from tube prior to patch application 
Analysis for round cross 
section 
Fiber Content = 59 vol.% 
Table 6. Tow Flexural Modulus vs. Temperature 
Temp. oC E, Msi Strain Range, % 
27 13.1 0 - 0.5 
-150 13.8 0 - 0.5 
-100 13.6 0 - 0.5 
-50 13.4 0 - 0.5 
23 12.6 0 - 0.5 
50 8.8 0 - 0.1 
75 4.1 0 - 0.05 
100 1.8 0 - 0.05 
Tow CTE Test Results 
PMIC of Corvallis, Oregon tested several TP283E/IM9 
(48K) composite tow samples to determine their CTE 
values. Tow number 40 (Vf=61%), which was cut from 
the end of boom #042 had a CTE of 0.3 ppm/oC (-100o 
to 20oC) and 0.4 ppm/oC (-20o to 40oC). Another 
composite tow sample (# 012-180+4, Vf=55%) was cut 
from an isogrid boom and was tested in to understand 
some of the tube level effects on CTE. This tow had a 
CTE of = 0.7 ppm/oC (-100o to –20oC) and 1.0 ppm/oC 
(-20o to 40oC). Although both of these tests values are 
extremely low and are be acceptable for most 
applications, they are slightly higher than the ROM 
predictions of Figure 11. A number of root causes were 
identified during this testing that directly affect the CTE 
of the tows. These fundamental issues will be 
optimized in the future in order to achieve lower CTE’s, 
which will be closer to the ROM predictions. 
Isogrid Boom Testing 
Two booms were fabricated for this study. One boom 
(#042) was loaded in compression, tension, tested for 
creep, and then failed in compression at an elevated 
temperature. The other boom was tested for CTE (#25). 
A section of another boom (#12) was also tested for 
CTE. The isogrid design chosen for this research was 
the Inflatable Solar Array Experiment II (ISAE-II) 
baseline design. This particular configuration was 
chosen to allow for comparison between isogrid booms 
fabricated by ILC in the past with both thermoplastic 
and UV epoxy resins. The fiber volume fractions of the 
booms were calculated based on the average value from 
five tows cut from the ends of the booms after 
manufacturing. The properties of the booms are shown 
in Table 7. Like the composite tow samples, the isogrid 
booms were fabricated from TP283E epoxy resin and 
48K IM9 carbon fibers. The booms were manufactured 
using a modified filament winding technique. The 
actual test booms are show in Figures 3 and 21. 
Table 7. Isogrid Boom Design Dimensions 
Parameter Value 
Lead Angle 30o 
Lead of the Helix 12.697 inches 
Isogrid Base Length 1.374 inches 
Boom Inner Diameter 7.05 inches 
Number of Longitudinals 16 
Number of Helicals 16 
Tow Size (IM9) 48K 
Average Tow Diameter 0.0534 inches 
Resin TP283E 
Mass of Boom #042 199.5 grams 
Length of Boom #042 48.375 inches 
Boom Test Length #042 46.75 inches 
Average Fiber Volume Fraction #042 57.8% 
A laser interferometer was used to characterize the CTE 
of the isogrid tube (#25) fabricated for this study along 
with a tube sample (#12) 
extracted from a longer 
isogrid boom. Tube #25 
was first tested in the 
pristine condition. The 
approximate average CTE 
(–40oC to +40°C) in the 
pristine condition of tube 
#25 is 1.15 ppm/°C. After 
Z-folding tube #25 over a 
15/32-inch radius one time 
and deploying it using 
inflation pressure, the boom 
had an average CTE (-40oC 
and +40°C) of 
approximately 1.15 ppm/°C. Therefore it appears that 
folding has no effect on the CTE of the boom, but 
further testing is required to verify this initial result, 
especially with respect to the orientation of the fold line 
of the tube during the testing. 
The results from the section of isogrid boom (#12) cut 
from a longer boom are slightly lower than tube #25. 
After four thermal cycles, the average CTE (-40 and 
+40°C) is approximately 0.82 ppm/°C, while the 
maximum CTE was approximately 0.95 ppm/°C after 
the fourth thermal cycle (Fig. 22). From these results, it 
American Institute of Aeronautics and Astronautics 
0 
0 0.001 0.002 0.003 0.004 0.005 0.006 0.007 0.008 
Flexural Strain, in/in 
Flexural Stress, ksi 
27C -150C 
-100C -50C 
23C 50C 
75C 100C 
Figure 20. Tow Flexural Stress vs. Strain 
Figure 21. Isogrid Tube 
During CTE Testing
9 
is apparent that thermal cycling stabilizes the CTE of 
the isogrid boom. Like the tow CTE testing, the results 
of these tests revealed a number of issues that will be 
optimized in the future in order to further reduce the 
CTE of the structure, thereby making it closer to the 
ROM predictions in Figure 11. 
CTE ≅ 0.82 ppm/°C 
CTE ≅ 0.95 ppm/°C 
Figure 22. Isogrid CTE Results; Tube #012 
The test stand used to obtain the tensile and 
compressive elastic modulus, as well as the preliminary 
creep data is described in detail elsewhere4. The boom 
is mounted horizontally on the test frame inside an 18- 
inch diameter by 52-inch long radiant heater. Axial and 
compressive loads are applied using a computer 
controlled, servomotor driven, linear motion system. 
Fiber optic strain gages were used because they were 
better suited for mounting to the ribs of the isogrid 
structure than typical bonded resistance type strain 
gages. Four strain gages were mounted 90o apart at the 
center of the boom. The use of fiber optic strain gages 
and associated signal conditioning necessitated using 
two different data acquisition systems, one for the strain 
gages and one for the load cell and thermocouples. 
Twelve thermocouples were used to measure 
temperature. They were arranged in three groups of 
four gages. The gage groups were located 
approximately six inches from each end of the tube and 
in the center. The four gages at each location were 
located 90° apart. For elastic modulus testing and creep 
testing the tube was loaded with approximately 50-lbf 
(1400-psi). For elastic modulus testing a cross-head 
rate of 0.05-in/min was used to apply the load. The load 
was then held and the tube allowed to relax until the 
strain gages stabilized. Tensile and compression tests 
were performed between 25-64oC. When data 
collection was completed at the test temperature, the 
tube was unloaded and allowed to cool. Between 
elevated temperature tests, a room temperature test was 
performed to ensure that there were no structural 
changes in the tube caused by the heating. The results 
from the tensile and compression modulus testing are 
shown in Figures 23 and 24. 
Tensile Modulus Vs. Temperature IM9 
(48K)/TP283E Isogrid Boom #042 
25 30 35 40 45 50 
Figure 23. Isogrid Tensile Modulus Results 
30 
25 
20 
15 
10 
5 
0 
Compression Modulus Vs. Temperature 
IM9 (48K)/TP283E Isogrid Boom #042 
30 
25 
20 
15 
10 
5 
The average tensile modulus of the boom from 28-47oC 
is 24.5-Msi ± 0.3-Msi. Normalized to 60% fiber 
volume fraction, the tensile modulus of the boom is 
25.5-MSI. These compressive modulus test values 
compare favorably (within 1%) with the predicted 
ROM modulus as seen in Figure 10. The average 
compressive modulus of the boom from 25-58oC is 
21.8-Msi ± 1.5-Msi. Normalized to 60% fiber volume 
fraction, the compressive modulus of the tube was 22.6- 
Msi. This value also compares favorably (within 10%) 
with the rule of mixtures predictions in Figure 10. 
The behavior of the boom changes dramatically at 
approximately 55-59oC. At these temperatures, for 
both the compressive and tensile cases, the boom 
exhibited viscoelastic behavior. As seen in Figure 25 
for the compressive loading case at 64oC, strain 
relaxation occurs where the load was held at 50-lbf. 
This behavior occurs because of the large drop in 
modulus of the resin above Tg. At temperatures above 
55oC the modulus becomes temperature and time 
dependent. These tests indicate that the viscoelastic 
American Institute of Aeronautics and Astronautics 
Temperature (OC) 
Modulus (MSI) 
Vf=57.8 
Figure 24. Isogrid Compression Modulus Results 
0 
25 35 45 55 
Temperature (OC) 
Modulus (MSI) 
Vf=57.8%
10 
behavior of the boom must be considered during design 
and deployment. 
5 
0 
-5 
-10 
-15 
-20 
-25 
Since understanding the viscoelastic behavior of the 
boom is fundamental to understanding boom 
performance, preliminary creep tests were performed. 
Strain relaxation data were obtained at four 
temperatures between 46oC and 65 °C. The time 
constant for the relaxation at each temperature was 
obtained from equation (3). 
 
 
= − 
ε ε τ 
where ε(t) is the strain at any instant in time, ε∞ is the 
strain at steady state, t is time, and τ is the time 
constant. A plot of the time constant vs. 1/T is shown 
in Figure 26. 
1000 
100 
10 
The trend line represents the behavior of the material 
predicted by the Arrhenius equation (4). 
RT (4) 
Where T is the temperature in Kelvin, and R 
American Institute of Aeronautics and Astronautics 
ΔE 
is a 
constant related to the activation energy and has units 
of K. The Arrhenius equation can be used to predict the 
creep behavior of the boom outside of the temperature 
range measured. For example, a typical operating 
temperature for the boom is 10°C (283 K). The 
predicted time constant at this temperature is 94,504 
seconds or 26.25 hours. This is the time required for 
63% of the strain relaxation to occur. 98% of the strain 
relaxation will occur at 4 time constants or 105 hours. 
The final boom test 
performed at JMU was the 
compression to failure at 
elevated temperature test. 
The expected maximum use 
temperature of a boom of 
this construction is 35oC. 
With a safety factor of 5oC, 
it was decided that the tube 
should tested at 
approximately 40oC. For 
this test the tube was loaded 
in compression at a strain 
rate of 0.05 in/min. The tube 
failed in rib buckling at 418.2-lbf, 11681.6-psi in 
compression at 40.6oC (Figure 27). These results 
compare favorably to the predictions obtained by using 
ILC’s isogrid analytical model1,3. Using the inputs in 
Table 9 and the ROM modulus at 57.8% Vf of 24.5- 
Msi, the predicted compressive failure load is 443-lbf in 
rib buckling, which is 5.6% above the actual load. 
Summary and Conclusions 
The results of the testing discussed herein clearly 
illustrate the excellent agreement between rule of 
mixtures mechanical predictions and ILC’s rigidizable 
composite isogrid structure test values in the 
temperature range of approximately –40oC to 55oC. 
The isogrid boom exhibits viscoelastic behavior above 
those temperatures. The high failure load of the 
TP283E/IM9 (48K) isogrid boom of 418-lbf at 40oC 
also shows that the booms are structurally sound up to 
the expected use temperature of 35oC. ILC’s isogrid 
analytical model predicts the failure load accurately at 
temperatures of at least 40oC. Isogrid technology is also 
scalable to tens and hundreds of feet in length and has 
been demonstrated in continuous lengths up to 23 feet 
(Fig. 28). The results of the composite tow tensile tests 
indicate that the modulus the TP283E/IM9 composite is 
Micro-Strain vs. Time for Compression Test 
at 64oC for Isogrid Boom #042; Vf=57.8% 
-30 
0 50 100 150 200 250 300 
Time (s) 
Micro-Strain (avg. of 4 gages) 
At 234.5 seconds the load was held at 50- 
lbf and the boom was allowed to relax 
Constant 
Load 
Strain Fluctuations correspond to cycling of heaters 
Figure 25. Isogrid Boom Strain Relaxation Curve 
(3)   
 
  
 
− 
∞ 
t 
(t) 1 e 
Figure 27. Isogrid 
Boom #042 During 
Compressive Failure 
E 
oe 
Δ 
− 
τ =τ 
τ= 2E-19e15427/T 
R2 = 0.9836 
1 
0.00295 0.003 0.00305 0.0031 0.00315 
1/T (1/K) 
τ (s) 
Figure 26. Relationship between the Time Constant for 
Strain Relaxation and Temperature
11 
unaffected by up to five 180 degree folding and 
deployment cycles over a 15/32-inch radius. Future 
testing will be conducted to reduce this fold radius. 
These tests also indicate that the 
ultimate tensile strength of the tows 
is within 25% of the ultimate tensile 
strength of the IM9 fibers. This tight 
folding can be achieved by the large 
reduction in flexural modulus of the 
tows at elevated temperatures (65% 
reduced at 75oC, 80% reduced at 
100oC, and 95% reduced at 125oC). 
These folding tests indicate the high 
packing efficiency that can be 
obtained with ILC’s isogrid booms 
with no reduction in tensile modulus. 
The CTE tests indicate that ILC’s 
TP283E/IM9 isogrid booms have a 
near-zero CTE of approximately 1 
ppm/oC. The initial results of these 
tests also indicate that there are no 
apparent folding effects on the CTE 
of isogrid. Root causes at the 
structural and tow level were 
identified to reduce the CTE of the 
booms in the future and bring them 
closer to rule of mixtures thermal 
predictions. The strain relaxation 
testing on the isogrid booms also 
indicated that the structure will 
become stable to creep at 10oC at 
approximately four days after 
deployment. 
Acknowledgments 
Figure 28. 7” 
diameter, 23 
foot long, 
Isogrid Boom 
in test at 
NASA-LaRC 
The authors thank Mr. Jim McManus from Luna 
Innovations, Inc. for the donation of the strain 
displacement devices for the thermo-mechanical testing 
of the isogrid boom at JMU. The authors also thank 
JPL and DARPA for supporting the composite testing 
at The Aerospace Corporation. 
References 
1. Cadogan, D.P., Lin, J.K, Sapna, G.H., 
Scarborough, S.E., “Space Inflatable Technology 
Development for Solar Sails and Other Gossamer 
Applications: GR/SMP Isogrid Boom Development 
Final Report,” NASA Task Order 10442, ILC Dover, 
Inc., October, 2001. 
2. Darooka, D.K., S.E. Scarborough, and D.P 
Cadogan, “An Evaluation of Inflatable Truss Frame For 
Space Applications,” AIAA-2001-1614, 42nd 
AIAA/ASME/ ASCE/AHS/ASC Structures, Structural 
Dynamics, and Materials Conference and Exhibit 
AIAA Gossamer Spacecraft Forum, April 16-19, 2001. 
3. Lin, J.K., G.H. Sapna, Cadogan, D.P., S.E. 
Scarborough, “Inflatable Rigidizable Isogrid Boom 
Development,” AIAA-2002-1297, 43rd AIAA/ASME/ 
ASCE/AHS/ASC Structures, Structural Dynamics, and 
Materials Conference and Exhibit AIAA Gossamer 
Spacecraft Forum, April 22-25, 2002. 
4. Pederson, L.M., Blandino, J.R., Woods-Vedler, 
J.A., “Determination of the Modulus of Elasticity as a 
Function of Temperature for an Isogrid Tube,” AIAA 
2002-1334, Proceedings of the 43rd 
AIAA/ASME/ASCE/AHS/ASC Structures, Structural 
Dynamics and Materials Conference, Denver, CO, 22- 
25 April, 2002. 
5. Cadogan, D.P. and S.E. Scarborough “Rigidizable 
Materials for use in Gossamer Space Inflatable 
Structures,”42nd AIAA/ASME/ASCE/AHS/ASC 
Structures, Structural Dynamics, and Materials 
Conference & Exhibit AIAA Gossamer Spacecraft 
Forum, Seattle, WA, April 16-19, 2001. 
6. Mikulas, M.M., Jr., “Structural Efficiency of Long, 
Lightly Loaded Truss and Isogrid Columns for Space 
Applications,” NASA Technical Memorandum 78687, 
July 1978. 
7. Darooka, D.K., S. Scarborough, S. Malghan, D. 
Cadogan, C. Knoll, “Inflatable Space Frame,” Final 
Report, NASA Prime Contract Number: NAS1-99154, 
July 2000. 
8. Cadogan, D.P., S.E. Scarborough, J.K. Lin, G.H. 
Sapna, “Shape Memory Polymer Composite 
Development For Use in Gossamer Space Inflatable 
Structures,” AIAA-2002-1372, 43rd AIAA/ASME/ 
ASCE/AHS/ASC Structures, Structural Dynamics, and 
Materials Conference and Exhibit AIAA Gossamer 
Spacecraft Forum, April 22-25, 2002. 
9. Hexcel Magnamite IM9 Carbon Fiber Product 
Data Sheet, March 2002. 
American Institute of Aeronautics and Astronautics

Weitere ähnliche Inhalte

Was ist angesagt?

High performance polymer fibre reinforced metal matrix composites- Metal Orga...
High performance polymer fibre reinforced metal matrix composites- Metal Orga...High performance polymer fibre reinforced metal matrix composites- Metal Orga...
High performance polymer fibre reinforced metal matrix composites- Metal Orga...Padmanabhan Krishnan
 
Flexural Fatigue of Steel SAE 1040 and GFRP Automotive Anti Roll Bars
Flexural Fatigue of  Steel SAE 1040 and  GFRP Automotive Anti Roll BarsFlexural Fatigue of  Steel SAE 1040 and  GFRP Automotive Anti Roll Bars
Flexural Fatigue of Steel SAE 1040 and GFRP Automotive Anti Roll BarsPadmanabhan Krishnan
 
Ak2418751879
Ak2418751879Ak2418751879
Ak2418751879IJMER
 
Fu2428622866
Fu2428622866Fu2428622866
Fu2428622866IJMER
 
IOSR Journal of Engineering (IOSR-JEN) Volume 4 Issue 9 Version 3
IOSR Journal of Engineering (IOSR-JEN) Volume 4 Issue 9 Version 3IOSR Journal of Engineering (IOSR-JEN) Volume 4 Issue 9 Version 3
IOSR Journal of Engineering (IOSR-JEN) Volume 4 Issue 9 Version 3IOSR-JEN
 
Computational Analysis of Fatigue of Glass/Epoxy Composite Automobile Drive S...
Computational Analysis of Fatigue of Glass/Epoxy Composite Automobile Drive S...Computational Analysis of Fatigue of Glass/Epoxy Composite Automobile Drive S...
Computational Analysis of Fatigue of Glass/Epoxy Composite Automobile Drive S...AM Publications
 
Af32633636
Af32633636Af32633636
Af32633636IJMER
 
Effect of polypropylene fiber, steel fiber & glass fiber on properties of concre
Effect of polypropylene fiber, steel fiber & glass fiber on properties of concreEffect of polypropylene fiber, steel fiber & glass fiber on properties of concre
Effect of polypropylene fiber, steel fiber & glass fiber on properties of concreIAEME Publication
 
Analysing The Composite Structure Of Riverted ,Hybrid And Bonded Joints
Analysing The Composite Structure Of Riverted ,Hybrid And Bonded JointsAnalysing The Composite Structure Of Riverted ,Hybrid And Bonded Joints
Analysing The Composite Structure Of Riverted ,Hybrid And Bonded JointsIJERA Editor
 
AXIAL CRUSHING OF GFRP FRUSTA: EXPERIMENTAL AND NUMERICAL ANALYSIS
AXIAL CRUSHING OF GFRP FRUSTA: EXPERIMENTAL AND NUMERICAL ANALYSISAXIAL CRUSHING OF GFRP FRUSTA: EXPERIMENTAL AND NUMERICAL ANALYSIS
AXIAL CRUSHING OF GFRP FRUSTA: EXPERIMENTAL AND NUMERICAL ANALYSISIAEME Publication
 
IRJET- Design and Analysis of Helical Spring using Composite Materials
IRJET-  	  Design and Analysis of Helical Spring using Composite MaterialsIRJET-  	  Design and Analysis of Helical Spring using Composite Materials
IRJET- Design and Analysis of Helical Spring using Composite MaterialsIRJET Journal
 

Was ist angesagt? (17)

High performance polymer fibre reinforced metal matrix composites- Metal Orga...
High performance polymer fibre reinforced metal matrix composites- Metal Orga...High performance polymer fibre reinforced metal matrix composites- Metal Orga...
High performance polymer fibre reinforced metal matrix composites- Metal Orga...
 
Flexural Fatigue of Steel SAE 1040 and GFRP Automotive Anti Roll Bars
Flexural Fatigue of  Steel SAE 1040 and  GFRP Automotive Anti Roll BarsFlexural Fatigue of  Steel SAE 1040 and  GFRP Automotive Anti Roll Bars
Flexural Fatigue of Steel SAE 1040 and GFRP Automotive Anti Roll Bars
 
Ak2418751879
Ak2418751879Ak2418751879
Ak2418751879
 
Lr2520282033
Lr2520282033Lr2520282033
Lr2520282033
 
Fu2428622866
Fu2428622866Fu2428622866
Fu2428622866
 
IOSR Journal of Engineering (IOSR-JEN) Volume 4 Issue 9 Version 3
IOSR Journal of Engineering (IOSR-JEN) Volume 4 Issue 9 Version 3IOSR Journal of Engineering (IOSR-JEN) Volume 4 Issue 9 Version 3
IOSR Journal of Engineering (IOSR-JEN) Volume 4 Issue 9 Version 3
 
Drive shaft by using composite material
Drive shaft by using composite materialDrive shaft by using composite material
Drive shaft by using composite material
 
Computational Analysis of Fatigue of Glass/Epoxy Composite Automobile Drive S...
Computational Analysis of Fatigue of Glass/Epoxy Composite Automobile Drive S...Computational Analysis of Fatigue of Glass/Epoxy Composite Automobile Drive S...
Computational Analysis of Fatigue of Glass/Epoxy Composite Automobile Drive S...
 
Af32633636
Af32633636Af32633636
Af32633636
 
Aj02411651172
Aj02411651172Aj02411651172
Aj02411651172
 
Isde 3
Isde 3Isde 3
Isde 3
 
E012223438
E012223438E012223438
E012223438
 
Effect of polypropylene fiber, steel fiber & glass fiber on properties of concre
Effect of polypropylene fiber, steel fiber & glass fiber on properties of concreEffect of polypropylene fiber, steel fiber & glass fiber on properties of concre
Effect of polypropylene fiber, steel fiber & glass fiber on properties of concre
 
Analysing The Composite Structure Of Riverted ,Hybrid And Bonded Joints
Analysing The Composite Structure Of Riverted ,Hybrid And Bonded JointsAnalysing The Composite Structure Of Riverted ,Hybrid And Bonded Joints
Analysing The Composite Structure Of Riverted ,Hybrid And Bonded Joints
 
AXIAL CRUSHING OF GFRP FRUSTA: EXPERIMENTAL AND NUMERICAL ANALYSIS
AXIAL CRUSHING OF GFRP FRUSTA: EXPERIMENTAL AND NUMERICAL ANALYSISAXIAL CRUSHING OF GFRP FRUSTA: EXPERIMENTAL AND NUMERICAL ANALYSIS
AXIAL CRUSHING OF GFRP FRUSTA: EXPERIMENTAL AND NUMERICAL ANALYSIS
 
Ld2418741880
Ld2418741880Ld2418741880
Ld2418741880
 
IRJET- Design and Analysis of Helical Spring using Composite Materials
IRJET-  	  Design and Analysis of Helical Spring using Composite MaterialsIRJET-  	  Design and Analysis of Helical Spring using Composite Materials
IRJET- Design and Analysis of Helical Spring using Composite Materials
 

Ähnlich wie Elevated temperature mechanical_characterization_of_isogrid_booms

E0313023027
E0313023027E0313023027
E0313023027theijes
 
FINITE ELEMENT ANALYSIS OF COMPOSITES UNDER DIFFERENT LOAD CONDITIONS WITH TH...
FINITE ELEMENT ANALYSIS OF COMPOSITES UNDER DIFFERENT LOAD CONDITIONS WITH TH...FINITE ELEMENT ANALYSIS OF COMPOSITES UNDER DIFFERENT LOAD CONDITIONS WITH TH...
FINITE ELEMENT ANALYSIS OF COMPOSITES UNDER DIFFERENT LOAD CONDITIONS WITH TH...IAEME Publication
 
International Journal of Engineering Research and Development
International Journal of Engineering Research and DevelopmentInternational Journal of Engineering Research and Development
International Journal of Engineering Research and DevelopmentIJERD Editor
 
Influence of Carbon & Glass Fiber Reinforcements on Flexural Strength of Epox...
Influence of Carbon & Glass Fiber Reinforcements on Flexural Strength of Epox...Influence of Carbon & Glass Fiber Reinforcements on Flexural Strength of Epox...
Influence of Carbon & Glass Fiber Reinforcements on Flexural Strength of Epox...IJERA Editor
 
Experimental evaluation of flexural properties of polymer matrix composites
Experimental evaluation of flexural properties of polymer matrix compositesExperimental evaluation of flexural properties of polymer matrix composites
Experimental evaluation of flexural properties of polymer matrix compositesiaemedu
 
EXPERIMENTAL STUDY ON WEAR BEHAVIOUR OF SIC FILLED HYBRID COMPOSITES USING TA...
EXPERIMENTAL STUDY ON WEAR BEHAVIOUR OF SIC FILLED HYBRID COMPOSITES USING TA...EXPERIMENTAL STUDY ON WEAR BEHAVIOUR OF SIC FILLED HYBRID COMPOSITES USING TA...
EXPERIMENTAL STUDY ON WEAR BEHAVIOUR OF SIC FILLED HYBRID COMPOSITES USING TA...IAEME Publication
 
Material Parameter and Effect of Thermal Load on Functionally Graded Cylinders
Material Parameter and Effect of Thermal Load on Functionally Graded CylindersMaterial Parameter and Effect of Thermal Load on Functionally Graded Cylinders
Material Parameter and Effect of Thermal Load on Functionally Graded CylindersIJMER
 
Study of the effects of carbon and glass fibre reinforcement and other filler...
Study of the effects of carbon and glass fibre reinforcement and other filler...Study of the effects of carbon and glass fibre reinforcement and other filler...
Study of the effects of carbon and glass fibre reinforcement and other filler...eSAT Publishing House
 
Study of the effects of carbon and glass fibre reinforcement and other filler...
Study of the effects of carbon and glass fibre reinforcement and other filler...Study of the effects of carbon and glass fibre reinforcement and other filler...
Study of the effects of carbon and glass fibre reinforcement and other filler...eSAT Journals
 
Experimental Evaluation of effect of filler on tensile behaviour of E-glass/e...
Experimental Evaluation of effect of filler on tensile behaviour of E-glass/e...Experimental Evaluation of effect of filler on tensile behaviour of E-glass/e...
Experimental Evaluation of effect of filler on tensile behaviour of E-glass/e...IJRES Journal
 
Enhancing Mechanical Properties of Jute Fibre/Glass Fiber and Epoxy Combined ...
Enhancing Mechanical Properties of Jute Fibre/Glass Fiber and Epoxy Combined ...Enhancing Mechanical Properties of Jute Fibre/Glass Fiber and Epoxy Combined ...
Enhancing Mechanical Properties of Jute Fibre/Glass Fiber and Epoxy Combined ...IRJET Journal
 
Effect of Temperature on Wear Rate of Si-Epoxy- Eglass Polymer composite Mate...
Effect of Temperature on Wear Rate of Si-Epoxy- Eglass Polymer composite Mate...Effect of Temperature on Wear Rate of Si-Epoxy- Eglass Polymer composite Mate...
Effect of Temperature on Wear Rate of Si-Epoxy- Eglass Polymer composite Mate...IDES Editor
 
Evaluation of Tensile and Flexural Properties of Polymer Matrix Composites
Evaluation of Tensile and Flexural Properties of Polymer Matrix CompositesEvaluation of Tensile and Flexural Properties of Polymer Matrix Composites
Evaluation of Tensile and Flexural Properties of Polymer Matrix CompositesIJMER
 
AXIAL CRUSHING OF GFRP FRUSTA: EXPERIMENTAL AND NUMERICAL ANALYSIS
AXIAL CRUSHING OF GFRP FRUSTA: EXPERIMENTAL AND NUMERICAL ANALYSISAXIAL CRUSHING OF GFRP FRUSTA: EXPERIMENTAL AND NUMERICAL ANALYSIS
AXIAL CRUSHING OF GFRP FRUSTA: EXPERIMENTAL AND NUMERICAL ANALYSISIAEME Publication
 
Analysis of the Flexure Behavior and Compressive Strength of Fly Ash Core San...
Analysis of the Flexure Behavior and Compressive Strength of Fly Ash Core San...Analysis of the Flexure Behavior and Compressive Strength of Fly Ash Core San...
Analysis of the Flexure Behavior and Compressive Strength of Fly Ash Core San...IJERA Editor
 
COMPARATIVE AND EXPERIMENTAL INVESTIGATION OF GLASS FIBER REINFORCED WITH JUT...
COMPARATIVE AND EXPERIMENTAL INVESTIGATION OF GLASS FIBER REINFORCED WITH JUT...COMPARATIVE AND EXPERIMENTAL INVESTIGATION OF GLASS FIBER REINFORCED WITH JUT...
COMPARATIVE AND EXPERIMENTAL INVESTIGATION OF GLASS FIBER REINFORCED WITH JUT...IRJET Journal
 

Ähnlich wie Elevated temperature mechanical_characterization_of_isogrid_booms (20)

E0313023027
E0313023027E0313023027
E0313023027
 
FINITE ELEMENT ANALYSIS OF COMPOSITES UNDER DIFFERENT LOAD CONDITIONS WITH TH...
FINITE ELEMENT ANALYSIS OF COMPOSITES UNDER DIFFERENT LOAD CONDITIONS WITH TH...FINITE ELEMENT ANALYSIS OF COMPOSITES UNDER DIFFERENT LOAD CONDITIONS WITH TH...
FINITE ELEMENT ANALYSIS OF COMPOSITES UNDER DIFFERENT LOAD CONDITIONS WITH TH...
 
International Journal of Engineering Research and Development
International Journal of Engineering Research and DevelopmentInternational Journal of Engineering Research and Development
International Journal of Engineering Research and Development
 
H1075262
H1075262H1075262
H1075262
 
Influence of Carbon & Glass Fiber Reinforcements on Flexural Strength of Epox...
Influence of Carbon & Glass Fiber Reinforcements on Flexural Strength of Epox...Influence of Carbon & Glass Fiber Reinforcements on Flexural Strength of Epox...
Influence of Carbon & Glass Fiber Reinforcements on Flexural Strength of Epox...
 
Experimental evaluation of flexural properties of polymer matrix composites
Experimental evaluation of flexural properties of polymer matrix compositesExperimental evaluation of flexural properties of polymer matrix composites
Experimental evaluation of flexural properties of polymer matrix composites
 
EXPERIMENTAL STUDY ON WEAR BEHAVIOUR OF SIC FILLED HYBRID COMPOSITES USING TA...
EXPERIMENTAL STUDY ON WEAR BEHAVIOUR OF SIC FILLED HYBRID COMPOSITES USING TA...EXPERIMENTAL STUDY ON WEAR BEHAVIOUR OF SIC FILLED HYBRID COMPOSITES USING TA...
EXPERIMENTAL STUDY ON WEAR BEHAVIOUR OF SIC FILLED HYBRID COMPOSITES USING TA...
 
Material Parameter and Effect of Thermal Load on Functionally Graded Cylinders
Material Parameter and Effect of Thermal Load on Functionally Graded CylindersMaterial Parameter and Effect of Thermal Load on Functionally Graded Cylinders
Material Parameter and Effect of Thermal Load on Functionally Graded Cylinders
 
A04650110
A04650110A04650110
A04650110
 
Study of the effects of carbon and glass fibre reinforcement and other filler...
Study of the effects of carbon and glass fibre reinforcement and other filler...Study of the effects of carbon and glass fibre reinforcement and other filler...
Study of the effects of carbon and glass fibre reinforcement and other filler...
 
Study of the effects of carbon and glass fibre reinforcement and other filler...
Study of the effects of carbon and glass fibre reinforcement and other filler...Study of the effects of carbon and glass fibre reinforcement and other filler...
Study of the effects of carbon and glass fibre reinforcement and other filler...
 
Experimental Evaluation of effect of filler on tensile behaviour of E-glass/e...
Experimental Evaluation of effect of filler on tensile behaviour of E-glass/e...Experimental Evaluation of effect of filler on tensile behaviour of E-glass/e...
Experimental Evaluation of effect of filler on tensile behaviour of E-glass/e...
 
Enhancing Mechanical Properties of Jute Fibre/Glass Fiber and Epoxy Combined ...
Enhancing Mechanical Properties of Jute Fibre/Glass Fiber and Epoxy Combined ...Enhancing Mechanical Properties of Jute Fibre/Glass Fiber and Epoxy Combined ...
Enhancing Mechanical Properties of Jute Fibre/Glass Fiber and Epoxy Combined ...
 
Effect of Temperature on Wear Rate of Si-Epoxy- Eglass Polymer composite Mate...
Effect of Temperature on Wear Rate of Si-Epoxy- Eglass Polymer composite Mate...Effect of Temperature on Wear Rate of Si-Epoxy- Eglass Polymer composite Mate...
Effect of Temperature on Wear Rate of Si-Epoxy- Eglass Polymer composite Mate...
 
Evaluation of Tensile and Flexural Properties of Polymer Matrix Composites
Evaluation of Tensile and Flexural Properties of Polymer Matrix CompositesEvaluation of Tensile and Flexural Properties of Polymer Matrix Composites
Evaluation of Tensile and Flexural Properties of Polymer Matrix Composites
 
J046035962
J046035962J046035962
J046035962
 
AXIAL CRUSHING OF GFRP FRUSTA: EXPERIMENTAL AND NUMERICAL ANALYSIS
AXIAL CRUSHING OF GFRP FRUSTA: EXPERIMENTAL AND NUMERICAL ANALYSISAXIAL CRUSHING OF GFRP FRUSTA: EXPERIMENTAL AND NUMERICAL ANALYSIS
AXIAL CRUSHING OF GFRP FRUSTA: EXPERIMENTAL AND NUMERICAL ANALYSIS
 
Analysis of the Flexure Behavior and Compressive Strength of Fly Ash Core San...
Analysis of the Flexure Behavior and Compressive Strength of Fly Ash Core San...Analysis of the Flexure Behavior and Compressive Strength of Fly Ash Core San...
Analysis of the Flexure Behavior and Compressive Strength of Fly Ash Core San...
 
COMPARATIVE AND EXPERIMENTAL INVESTIGATION OF GLASS FIBER REINFORCED WITH JUT...
COMPARATIVE AND EXPERIMENTAL INVESTIGATION OF GLASS FIBER REINFORCED WITH JUT...COMPARATIVE AND EXPERIMENTAL INVESTIGATION OF GLASS FIBER REINFORCED WITH JUT...
COMPARATIVE AND EXPERIMENTAL INVESTIGATION OF GLASS FIBER REINFORCED WITH JUT...
 
Cv33588591
Cv33588591Cv33588591
Cv33588591
 

Elevated temperature mechanical_characterization_of_isogrid_booms

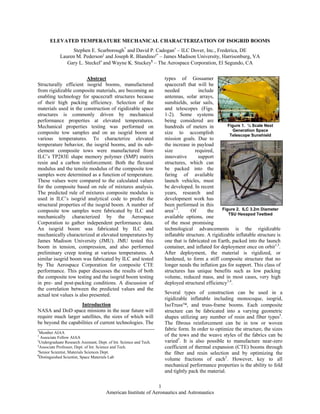
  • 1. ELEVATED TEMPERATURE MECHANICAL CHARACTERIZATION OF ISOGRID BOOMS Stephen E. Scarborough* and David P. Cadogan† – ILC Dover, Inc., Frederica, DE Lauren M. Pederson‡ and Joseph R. Blandino§* – James Madison University, Harrisonburg, VA Gary L. Steckel∋ and Wayne K. Stuckey¶ – The Aerospace Corporation, El Segundo, CA 1 Abstract Structurally efficient isogrid booms, manufactured from rigidizable composite materials, are becoming an enabling technology for spacecraft structures because of their high packing efficiency. Selection of the materials used in the construction of rigidizable space structures is commonly driven by mechanical performance properties at elevated temperatures. Mechanical properties testing was performed on composite tow samples and on an isogrid boom at various temperatures. To characterize elevated temperature behavior, the isogrid booms, and its sub-element composite tows were manufactured from ILC’s TP283E shape memory polymer (SMP) matrix resin and a carbon reinforcement. Both the flexural modulus and the tensile modulus of the composite tow samples were determined as a function of temperature. These values were compared to the calculated values for the composite based on rule of mixtures analysis. The predicted rule of mixtures composite modulus is used in ILC’s isogrid analytical code to predict the structural properties of the isogrid boom. A number of composite tow samples were fabricated by ILC and mechanically characterized by the Aerospace Corporation to gather independent performance data. An isogrid boom was fabricated by ILC and mechanically characterized at elevated temperatures by James Madison University (JMU). JMU tested this boom in tension, compression, and also performed preliminary creep testing at various temperatures. A similar isogrid boom was fabricated by ILC and tested by The Aerospace Corporation for composite CTE performance. This paper discusses the results of both the composite tow testing and the isogrid boom testing in pre- and post-packing conditions. A discussion of the correlation between the predicted values and the actual test values is also presented. Introduction NASA and DoD space missions in the near future will require much larger satellites, the sizes of which will be beyond the capabilities of current technologies. The types of Gossamer spacecraft that will be needed include antennas, solar arrays, sunshields, solar sails, and telescopes (Figs. 1-2). Some systems being considered are hundreds of meters in size to accomplish mission goals. Due to the increase in payload size required, innovative support structures, which can be packed into the faring of available launch vehicles, must be developed. In recent years, research and development work has been performed in this area1-3. Of the available options, one of the most promising technological advancements is the rigidizable inflatable structure. A rigidizable inflatable structure is one that is fabricated on Earth, packed into the launch container, and inflated for deployment once on orbit1,3. After deployment, the material is rigidized, or hardened, to form a stiff composite structure that no longer needs the inflation gas for support. This class of structures has unique benefits such as low packing volume, reduced mass, and in most cases, very high deployed structural efficiency3,4. Several types of construction can be used in a rigidizable inflatable including monocoque, isogrid, IsoTruss, and truss-frame booms. Each composite structure can be fabricated into a varying geometric shapes utilizing any number of resin and fiber types5. The fibrous reinforcement can be in tow or woven fabric form. In order to optimize the structure, the sizes of the tows and the weave styles of the fabrics can be varied5. It is also possible to manufacture near-zero coefficient of thermal expansion (CTE) booms through the fiber and resin selection and by optimizing the volume fractions of each5. However, key to all mechanical performance properties is the ability to fold and tightly pack the material. *Member AIAA † Associate Fellow AIAA ‡Undergraduate Research Assistant, Dept. of Int. Science and Tech. §Associate Professor, Dept. of Int. Science and Tech. ∋Senior Scientist, Materials Sciences Dept. ¶Distinguished Scientist, Space Materials Lab American Institute of Aeronautics and Astronautics Figure 1. ½ Scale Next Generation Space Telescope Sunshield Figure 2. ILC 3.2m Diameter TSU Hexapod Testbed
  • 2. 2 Isogrid Design and Construction One of the most advanced inflatable rigidizable structures is the isogrid boom, which consists of a grid-work of equilateral triangles1,3,6. These equilateral triangles give the overall structure isotropic mechanical properties1,3. One of the isogrid booms fabricated for this study is shown in Figure 3 (patent pending). This type of boom has a circular cross-section and is encased on both sides with a polymeric film such as polyimide1,3. The inner film layer acts as a bladder or gas-retaining layer for inflation. The outer later, called the anti-blocking layer, is used to prevent the structure from adhering (blocking) to itself when it is in the packed configuration1,3. The outer layer can also act as the first layer in a mult-layered insulation (MLI) blanket. ILC Dover has developed analytical modeling techniques to predict the properties of this structure1,3,6. ILC has studied the room temperature mechanical properties of this structure extensively, but there is still a need for further work to be performed to fully characterize the performance of the structure, especially at elevated temperatures1,3. Materials A leading rigidizable material candidate is the shape memory composite 1-5, 7,8. The composite consists of a fibrous reinforcement, such as carbon, and a polymeric matrix resin such as polyurethane or epoxy. The resin is initially consolidated at a high temperature, called the set temperature, to form a high modulus, rigid structure. This initial heating and consolidation event defines the shape of the structure. Subsequent heating events above the material’s glass transition temperature (Tg) lowers the modulus of the material significantly and allows the structure to be tightly packaged (Fig. 4). If constrained and cooled below Tg while packed, the composite modulus will increase and the material will retain the packed shape, even if the package is unconstrained. Upon re-heating, American Institute of Aeronautics and Astronautics the material experiences a large decrease in modulus and can therefore be deployed back to its as-manufactured state. Once the deployed structure cools below the Tg, the modulus will increase and the inflation gas is no longer required for structural support. This process of packing and deploying the structure is repeatable which allows flight hardware to be packed and deployed for evaluation several times during ground test prior to launch and deployment in space. The thermoplastic resin has some degree of shape memory upon heating, which causes the structure to attempt to return to its as-manufactured state. However, this shape memory force is weak relative to the force required to deploy the composite structure and associated systems, therefore this force must usually be augmented by inflation gas. Material Properties In this study, ILC Dover’s TP283E epoxy resin was used to manufacture all of the test samples. The resin system has reduced cross-link functionality in order to add increased flexibility above the Tg as compared to typical epoxy resin systems. TP283E therefore exhibits thermoplastic behavior with the only exception being that it does not have a melt temperature. ILC chose Hexcel’s IM9 carbon fiber as the reinforcement for all of the test samples discussed herein. IM9 was chosen because of its balance of high mechanical properties and high strain to failur1,3,8. The properties of this fiber are listed in Table 1. Table 1. IM9 (12K) Carbon Fiber Properties9 Property English Units SI Units Tensile Modulus 42.0 x 10⁶ psi 290Gpa Tensile Strength 890,000 psi 6,141 MPa Ultimate Elongation 2.1% 2.1.% Axial CTE∝ -0.228 ppm/oF -0.5 ppm/oC Density 0.0650 lb/in3 1.80 g/cm3 Filament Diameter 0.175 mil 4.4 microns Filament shape Round Round Weight/Length 18.8 x 10⁻⁶ lb/in 0.335 g/m Fiber Cross-Sectional Area 2.89x10⁻⁴in2 0.19mm2 ∝Estimate In earlier studies, assumptions were made based on test data from similar resins to predict the mechanical properties of TP283E resin in order to eliminate the overall amount of testing required in initial development1,3,8. To determine the actual properties of the resin using an independent test lab, a resin sample was manufactured by ILC and sent to The Aerospace Corporation for mechanical characterization. The elastic modulus of the neat resin was tested using the 3- point bending method on a TA Instruments Inc., Dynamic Mechanical Analysis (DMA) system. From this testing, the average elastic modulus at 23°C for 5 samples of TP283E resin was determined to be 500 ± 20 ksi (Fig. 5). Figure 3. ILC Isogrid Boom: Figure 4. Z-Folded 7” Diameter, 39” Long Isogrid Boom
  • 3. 3 2 1.8 1.6 1.4 1.2 1 0.8 0.6 0.4 0.2 Using the cantilever bending function on the DMA, The Aerospace Corporation determined from the loss modulus peak that the Tg of the resin was 55oC at a frequency of 1 Hz. Three tow samples extracted from an isogrid boom were also tested using DMA (Fig. 6). The results from these tests indicate that the Tg is between 57oC-61oC. Earlier Differential Scanning Calorimetry (DSC) testing performed at ILC indicated that TP283E had a Tg of 48oC1. Differences in the test methods and slight deviations in the set temperatures are the likely causes of the variation in the Tg results. Therefore, depending on the set temperatures, TP283E can be made to have a Tg in the range of 48-61oC. Tg = 57.55oC The flexural modulus of TP283E resin over the temperature range from -150°C to +50°C was also tested. Tests were performed on sample numbers B3−B7, which were approximately 2.3-inches long, 0.35-inches wide, and 0.12-inches thick. They were tested using the 2-in. span of the DMA 3-Point Bend fixture. Peak loads were varied for the different test temperatures because the neat resin samples had increasingly lower moduli at higher temperatures. The temperature sequence was 23, 30, 35, 40, and 50°C. At the end of each test the force was set to 0 N. The force was then maintained at 0 N during heating to the next test temperature and during the 5-minute thermal equilibration at the test temperature. After the 5-minute thermal equilibration at the test temperature, the static force was then set to 0.01 N and immediately ramped to the final force. Good modulus data were obtained for all test temperatures for sample B7 (Fig. 7). Modulus values for sample B7 were similar to those for sample B6 for all test temperatures. 1.6 1.4 1.2 1.0 0.8 0.6 0.4 0.2 After the modulus testing was completed, the valid modulus data for samples B3−B7 were tabulated and plotted as functions of temperature. It was determined that two linear curve fits could be used to describe the data. A straight line with a relatively low slope (-1.3 ksi/°C) was fit to the data for -150 to 23°C and a straight line with a much higher slope (18.7 ksi/°C) was fit to the data for 23 to 50°C (Fig. 8). The two curves intersect at 25°C. 1000000 900000 800000 700000 600000 500000 400000 300000 200000 100000 American Institute of Aeronautics and Astronautics 0 0.0 0.1 0.2 0.3 0.4 0.5 Flexural Strain, % Flexural Stress, ksi No. 1 No. 2 No. 3 No. 4 No. 5 E = 535 ksi E = 501 ksi E = 493 ksi E = 490 ksi E = 482 ksi Average E = 500 + 20 ksi (0.04 to 0.25% Strain) Figure 5. Elastic Modulus at 23oC of TP283E Resin Flexural Stress-Strain Curve TP283E Sample No. B7 0.0 0 0.002 0.004 0.006 Flexural Strain, in/in Flexural Stress, ksi 25C, E = 445 ksi 32C, E = 362 ksi 36C, E = 261 ksi 41C, E = 72 ksi 45C, E = 49 ksi 50C, E = 22 ksi Figure 7. TP283E Elastic Modulus Vs. Temperature TP283E Elastic Modulus versus Temperature 0 -150 -125 -100 -75 -50 -25 0 25 50 Temperature, oC Elastic Modulus, psi Sample Nos. B3-B7 Bi-linear Curve Fit Bi-linear Curve Fit E = -1340T + 481,000 psi (-150 to 25oC) E = -18,700T + 919,000 psi (25 to 50oC) Figure 8. Bi-linear Curve Fit of TP283E Modulus Figure 6. TP283E/IM9 Tow #29 DMA Tg Results
  • 4. 4 The Aerospace Corporation also tested the coefficient of thermal expansion (CTE) of the TP283E neat resin. CTE measurements were made on three TP283E epoxy samples over the temperature range of -100 to +50°C using a TA Instruments, Inc., Thermal Mechanical Analyzer (TMA). The three samples were prepared with the sample length parallel to the length, width, and thickness, respectively, of the ILC TP283E cast panel. The thermal expansion curves for the three samples were essentially identical and the data for the 3 samples were combined into one file. Various methods of curve fitting the CTE data for the 3 samples were attempted with the best curve fit obtained by two 2nd order polynomial equations. A curve fit of the data from -100 to +20°C gave a CTE = 0.135T + 59.35 ppm/°C. A curve fit of the data from +20 to +50°C gave a CTE = 2.91T – 2.43 ppm/°C (Fig. 9). TP283E Thermal Expansion CTE = 2.91T - 2.43 ppm/oC (20 to 50oC) Rule of Mixtures Predictions 4000 2000 0 -2000 -4000 -6000 Rule of mixtures (ROM) CTE and modulus calculations were made for unidirectional IM9/TP283E composites using the fiber properties listed in Table 1 and the TP283E epoxy matrix modulus and CTE values given by the aforementioned equations. The ROM equations used are listed as equations (1) and (2). The ROM predictions were made over the temperature range of – 100 to +50°C for fiber contents of 35, 40, 45, 50, 55, and 60 percent fiber volume fraction (Figs. 10 and 11). 1.1 0.9 0.7 0.5 0.3 0.1 -0.1 -0.3 ROM Elastic Modulus Prediction for Unidirectional IM9/TP283E Ef = 42 msi, CTEf = -0.5 ppm/oC 30 25 20 15 10 5 Ef = 42 Msi Em = -0.00134T + 0.481 msi (-150 to 25oC); = -0.0187T + 0.919 msi (26 to 50oC) CTEm = 0.135T + 59.35 ppm/oC (-100 to 25oC); = 2.91T - 2.43 ppm/oC (26 to 50oC) As can be seen from Figure 10, the composite modulus is not affected appreciably by the modulus of the resin; instead it is fiber modulus and volume fraction dominated. Therefore, even though the modulus of TP283E decreases significantly at 50oC, the composite modulus does not. Figure 11 illustrates the point that rigidizable materials can be made to exhibit near zero CTE through proper material selection and fiber volume fraction control. It is apparent from this graph that composite CTE is more dependent on the modulus of the resin than is composite modulus. Tow Tensile Test Results The Aerospace Corporation also mechanically characterized composite tow samples during this study. The tow samples were manufactured by ILC using the same methods as the isogrid booms. All samples discussed herein are made from TP283E/IM9 (48K) carbon fiber tows. The fiber volume fraction of each sample was measured non-destructively by accurately measuring the mass and length of each sample and then using the resin and fiber densities to calculate the := (2) American Institute of Aeronautics and Astronautics -8000 -150 -100 -50 0 50 100 Temperature, oC (L - L23)/L23, ppm Data for 3 Samples Curve Fits CTE = 0.135T + 59.35 ppm/oC (-100 to 20oC) Figure 9. Curve Fit of Avg. TP283E CTE Results ROM CTE Predictions for Unidirectional IM9/TP283E -0.5 -100 -75 -50 -25 0 25 50 Temperature, oC Composite CTE, ppm/oC 35 vol.% Fiber 40 vol.% Fiber 45 vol.% Fiber 50 vol.% Fiber 55 vol.% Fiber 60 vol.% Fiber Figure 11. Rule of Mixtures CTE Predictions 0 -150 -125 -100 -75 -50 -25 0 25 50 Temperature (oC) Composite Modulus (Msi) Vf=35% Vf=40% Vf=45% Vf=50% Vf=55% Vf=60% Em = -1340T + 481,000 psi (-150 to 25oC) Em = -18,700T + 919,000 psi (25 to 50oC) Figure 10. Rule of Mixtures Modulus Predictions E c := E f⋅v f + Em⋅v m (1) α c α f⋅E f⋅v f + α m⋅Em⋅v m E f⋅v f + Em⋅v m where αc = axial composite CTE αf and αm = fiber and matrix CTE Ef,Em,Ec = fiber, matrix, and axial composite modulus vf and vm = fiber and matrix volume fraction
  • 5. 5 volume fraction. The fiber volume fractions were recorded prior to testing in order to normalize the data and to correlate it with the predicted ROM values. After manufacturing, the tow samples were bonded into G10 grip tabs as shown in Figure 12. The tow tensile tests were performed using an Instron universal testing machine set up with 1,000-lb grips with 2-inch long serrated grip faces and a 1,000-lb load cell. An extensometer was placed on each sample during testing to measure strain. The samples were tested at a crosshead rate of 0.1 in./min (strain rate ≤ 0.033 in./in./min). Young’s modulus, ultimate tensile strength, and failure strain were measured. Young’s modulus, E, was calculated from a linear regression of stress versus strain data from 0.05 to 0.50% strain. The position of the extensometer was varied during the testing. The gauge length of the extensometer was 1.0- inches. All samples were loaded to 400-lb (130 ksi, 0.8% strain) and unloaded twice for the initial modulus measurements. The modulus test values were then normalized to 60% fiber volume fraction and compared to ROM predictions. Six pristine tows (no folding and deployment cycles) were tensile tested during this study (Table 2). When normalized to 60% fiber volume fraction, the average room temperature modulus of the pristine TP283E/IM9 (48K) twisted tows was 24.8-Msi ± 0.3-Msi, which compares well with the rule of mixtures in Figure 10. Table 2. TP283E/IM9 (48K) Pristine Tow Tensile Results No.# Vf E, Measured, 160 140 120 100 80 60 40 20 American Institute of Aeronautics and Astronautics Msi E, Normalized to 60% Vf % ROM Em = 0.5 3S 0.385 15.5 23.3 94 3R 0.385 15.3 23.0 93 3R 0.385 15.4 23.1 93 6R 0.397 16.4 24.8 97 6S 0.397 16.4 24.8 97 6R 0.397 16.4 24.8 97 9R 0.380 15.8 24.9 97 9S 0.380 15.9 25.1 98 9S 0.380 15.8 24.9 97 7aE 0.394 16.2 24.7 96 7aR 0.394 16.0 24.4 95 7aR 0.394 16.4 25.0 97 7bS 0.411 17.3 25.3 99 7bR 0.411 17.0 24.8 97 7bR 0.411 16.9 24.7 96 1a 0.337 14.1 25.1 97 30 0.465 18.9 24.4 95 #Extensometer on smooth side of tow (S), rough side (R), or on edge (E) between smooth and rough sides Five of the six pristine tensile samples were tested to failure and had tensile strengths within 11% of the fiber ultimate tensile strength (UTS). Samples 3, 6, 9, 7 and 1a failed at 315-ksi, 343-ksi, 305-ksi, 311-ksi, and 320- ksi, respectively. The Aerospace Corporation also investigated the effect of temperature on the tensile modulus of the tow samples (Fig. 13). The results of this experiment show that over the measured range the composite tow tensile modulus is not effected by temperature, which agrees well with the rule of mixtures predictions in Figure 10. Note that some bending occurred at low loads at 80 and 96°C and was most likely due to the weight of the extensometer. Vf=48% The effect of folding on composite tow samples was also examined. After being processed at their initial set temperature, tow samples were heated to a temperature of 100- 105oC and folded 180 degrees over a 5/32-inch (4-mm) radius as seen in the X-ray photograph in Figure 14. The samples were constrained in the folded position as they cooled. Once cooled to room temperature, they were released from the constraining mechanism. Samples were then heated again and allowed to return to shape via the shape memory recovery force of the material (Fig. 15). This process was repeated 1, 3, or 5 times in order to determine the possible effects of packaging and deploying structures fabricated from these materials. Note that the nano-X-ray of the TP283E/IM9 (48K) tow shown in Figure 14, which was folded one time over a 15/32-inch radius, revealed no fiber damage. Figure 12. Tow Tensile Test Samples 0 0.0 0.2 0.4 0.6 0.8 1.0 Tensile Strain, % Tensile Stress, ksi 48C 62C 80C 96C 29C Figure 13. Tensile Stress vs. Strain: Sample 10a Figure 14. X-ray of Folded TP283E/IM9 (48K) Tow
  • 6. 6 Tensile testing was performed on five composite tow samples that were folded and deployed one time (Table 3). When normalized to 60% fiber volume fraction, the average room temperature modulus of the TP283E/IM9 (48K) tows after being packed and deployed once over a 5/32- inch radius is 24.6 MSI ± 2.5 MSI. This value is close to the rule of mixtures prediction in Figure 10, and agrees with data collected using pristine tows, indicating that folding one time over a 15/32-inch radius has no effect on the tensile modulus of the composite tow. Two of these samples were tensile tested to failure. Sample 12 failed at 338- ksi (99% fiber UTS) while sample 13 failed at 292-ksi (78% fibers UTS). Table 3. TP283E/IM9 (48K) Tow Tensile Results; 1 Fold No.# Vf E, Measured, 160 140 120 100 80 60 40 20 0 Fold Outside Fold Inside Fold Edge E = 16.9 msi (102% ROM) extensometer on fold edge 0.0 0.2 0.4 0.6 0.8 1.0 Tensile Stress, ksi Figure 16. Tensile Stress vs. Strain: Sample 12, Packed and Deployed Via Shape Memory Once 160 140 120 100 80 60 40 20 American Institute of Aeronautics and Astronautics msi E, Normalized to 60% Vf % ROM Em = 0.5 11-OD 0.467 19.7 25.3 99 12-OD 0.390 17.2 26.5 103 12-ID 0.390 14.1 21.7 85 12-E 0.390 16.9 26.0 101 12-E 0.390 16.8 25.8 101 13-OD 0.428 18.9 26.5 103 13-ID 0.428 15.7 22.0 86 13-E 0.428 17.7 24.8 97 13-E 0.428 18.3 25.7 100 15-OD 0.389 17.6 27.1 106 15-ID 0.389 12.6 19.4 76 15-E 0.389 17.2 26.5 103 16-OD 0.446 19.7 26.5 104 16-ID 0.446 15.1 20.3 79 16-E 0.446 18.4 24.8 97 # OD=extensometer on outside of tow fold diameter; ID=extensometer on inside of tow fold diameter; E=extensometer on edge between OD and ID sides The results indicate that the composite tow tensile modulus of the folded samples varies with the extensometer location relative to the fold direction. The modulus measured on the fold edge matched extremely well with the ROM predictions, while the measured modulus was much lower on the inside edge (Fig. 16). It was determined that the folding and deployment process using shape memory resulted in fiber kinks on the compression side of the fold, which causes a large displacement on the inside of the fold at low loads. The outside of the tows did not have the same displacement effects because the fibers are placed in tension in this area of the tow. The kinks in the fiber on the inside of the fold were removed at approximately 30-ksi, which is a high stress relative to the expected loads in actual application. Tow samples from tubes that were deployed via inflation were also tested and did not exhibit this fiber kinking behavior due to the relatively high stress of the inflation pressure as compared to the shape memory recovery stress of the resin. Tensile Strain, % In order to determine the stress required to remove the fiber kinks of the packed and deployed tows at different temperatures, one composite tow sample was tensile tested at temperatures up to 96oC (Fig. 17). The results indicate that fiber kinks are removed at lower stresses as the temperature increases. Also, high temperature loading permanently removes fiber kinks as illustrated by the nearly linear stress-strain curve at 24°C following loading at 96°C. Note that large deformations at low loads at high temperatures may be due to the weight of the extensometer. These results indicate that it is possible to remove any fiber kinks in the tows of the isogrid boom by carefully controlling the deployment temperature and the inflation pressure. 0 0 0.2 0.4 0.6 0.8 1 Tensile Strain, % Tensile Stress, ksi 35C 60C 82C 96C 24C Extensometer on ID side of fold Figure 17. Tensile Stress vs. Strain at Elevated Temp.; Tow 16, 1 fold and deployment cycle Figure 15. TP283E/IM9 (48K) Tow Samples Returned to Shape After Folding
  • 7. 7 Three composite tow samples were tensile tested after being packed and deployed three times (Table 4). The results indicate that there are fiber kinks on the inside of the fold similar to that seen in the results for one fold and deployment cycle (Fig. 18). The average room temperature tensile modulus of the three TP283E/IM9 (48K) tows after three folds is 23.7 MSI ± 1.8 MSI when the data is normalized to 60% fiber volume fraction. All three samples were tensile tested to failure. Samples 31, 32, and 33 failed at 340-ksi (91% fiber UTS), 389-ksi (101% fiber UTS), and 392-ksi (103% fiber UTS), respectively. The results of these tests indicate that there is no degradation in tensile properties from three 180-degree folding and deployment cycles over a 15/32-inch radius. Table 4. TP283E/IM9 (48K) Tensile Test Results; 3 folds 400 300 200 100 0 Fold Outside Fold Inside Fold Edge UTS = 380 ksi (99% ROM) E = 18.0 msi (99% ROM) extensometer on fold edge 0.0 0.2 0.4 0.6 0.8 1.0 1.2 1.4 1.6 1.8 2.0 2.2 Tensile Stress, ksi Figure 19. Tensile Stress vs. Strain: Tow 34; 5 folds UTS = 389 ksi (99% ROM) American Institute of Aeronautics and Astronautics No.# Vf E, Measured, msi E, Normalized to 60% Vf % ROM Em = 0.5 31-OD 0.427 18.2 25.6 100 31-ID 0.427 15.2 21.4 83 31-E 0.427 16.7 23.5 92 31-ID-2 0.427 15.4 21.6 85 32-OD 0.441 18.8 25.6 100 32-ID 0.441 15.5 21.1 82 32-E 0.441 17.8 24.2 95 33-OD 0.434 18.8 26.0 102 33-ID 0.434 17.1 23.6 92 33-E 0.434 17.5 24.2 95 # OD=extensometer on outside of tow fold diameter; ID=extensometer on inside of tow fold diameter; E=extensometer on edge between OD and ID sides 400 300 200 100 Three composite tow samples were tensile tested after being packed and deployed five times (Table 5). The results show that there is residual bending on the inside of the fold similar to that seen in the results for one fold and three fold and deployment cycles (Fig. 19). The average room temperature tensile modulus of the three TP283E/IM9 (48K) tows after five folds is 23.9 MSI ± 1.8 MSI when the data is normalized to 60% fiber volume fraction. Table 5. TP283E/IM9 (48K) Tensile Test Results; 5 folds No.# Vf E, Measured, msi E, Normalized to 60% Vf % ROM Em = 0.5 34-OD 0.431 18.6 25.9 101 34-ID 0.431 16.9 23.5 92 34-E 0.431 18.0 25.1 98 35-OD 0.484 20.3 25.2 99 35-ID 0.484 16.7 20.7 81 35-E 0.484 19.3 23.9 94 36-OD 0.450 18.9 25.2 99 36-ID 0.450 16.1 21.5 84 36-E 0.450 18.4 24.5 96 # OD=extensometer on outside of tow fold diameter; ID=extensometer on inside of tow fold diameter; E=extensometer on edge between OD and ID sides All three samples were tensile tested to failure. Tensile Strain, % Samples 34, 35, and 36 failed at 380-ksi (100% fiber UTS), 324-ksi (77% fiber UTS), and 381-ksi (97% fiber UTS), respectively. The results of these tests indicate that there is no degradation in tensile modulus from five 180-degree folding and deployment cycles over a 15/32-inch radius. However, one tow (#35) had visual fiber damage after five folds and experienced a 25% reduction in tensile strength. Tow Flexural Modulus Test Results The composite tow flexural modulus tests were performed using the 3-point bending fixture of the (DMA) using a similar procedure as that used to test the neat resin samples. The tow used for this test had a fiber volume fraction of 59% and was cut from the end of the isogrid test tube (#042) characterized by JMU. The results in Figure 20 show that the flexural modulus of the composite tow sample decreases 86% at 100oC, which is a similar result to that obtained during the neat TP283E resin flexural modulus testing. Table 6 shows the strain ranges that were used to calculate the modulus values at the different test temperatures. 0 0.0 0.2 0.4 0.6 0.8 1.0 1.2 1.4 1.6 1.8 2.0 2.2 Tensile Strain, % Tensile Stress, ksi Fold Outside Fold Inside Fold Edge E = 17.8 msi (95% ROM) extensometer on fold edge Figure 18. Tensile Stress Vs. Strain: Sample 32; 3 folds
  • 8. 8 Flexural Stress-Strain Curve IM9 (48K)/TP283E Tow No. 37 100 80 60 40 20 Tow extracted from tube prior to patch application Analysis for round cross section Fiber Content = 59 vol.% Table 6. Tow Flexural Modulus vs. Temperature Temp. oC E, Msi Strain Range, % 27 13.1 0 - 0.5 -150 13.8 0 - 0.5 -100 13.6 0 - 0.5 -50 13.4 0 - 0.5 23 12.6 0 - 0.5 50 8.8 0 - 0.1 75 4.1 0 - 0.05 100 1.8 0 - 0.05 Tow CTE Test Results PMIC of Corvallis, Oregon tested several TP283E/IM9 (48K) composite tow samples to determine their CTE values. Tow number 40 (Vf=61%), which was cut from the end of boom #042 had a CTE of 0.3 ppm/oC (-100o to 20oC) and 0.4 ppm/oC (-20o to 40oC). Another composite tow sample (# 012-180+4, Vf=55%) was cut from an isogrid boom and was tested in to understand some of the tube level effects on CTE. This tow had a CTE of = 0.7 ppm/oC (-100o to –20oC) and 1.0 ppm/oC (-20o to 40oC). Although both of these tests values are extremely low and are be acceptable for most applications, they are slightly higher than the ROM predictions of Figure 11. A number of root causes were identified during this testing that directly affect the CTE of the tows. These fundamental issues will be optimized in the future in order to achieve lower CTE’s, which will be closer to the ROM predictions. Isogrid Boom Testing Two booms were fabricated for this study. One boom (#042) was loaded in compression, tension, tested for creep, and then failed in compression at an elevated temperature. The other boom was tested for CTE (#25). A section of another boom (#12) was also tested for CTE. The isogrid design chosen for this research was the Inflatable Solar Array Experiment II (ISAE-II) baseline design. This particular configuration was chosen to allow for comparison between isogrid booms fabricated by ILC in the past with both thermoplastic and UV epoxy resins. The fiber volume fractions of the booms were calculated based on the average value from five tows cut from the ends of the booms after manufacturing. The properties of the booms are shown in Table 7. Like the composite tow samples, the isogrid booms were fabricated from TP283E epoxy resin and 48K IM9 carbon fibers. The booms were manufactured using a modified filament winding technique. The actual test booms are show in Figures 3 and 21. Table 7. Isogrid Boom Design Dimensions Parameter Value Lead Angle 30o Lead of the Helix 12.697 inches Isogrid Base Length 1.374 inches Boom Inner Diameter 7.05 inches Number of Longitudinals 16 Number of Helicals 16 Tow Size (IM9) 48K Average Tow Diameter 0.0534 inches Resin TP283E Mass of Boom #042 199.5 grams Length of Boom #042 48.375 inches Boom Test Length #042 46.75 inches Average Fiber Volume Fraction #042 57.8% A laser interferometer was used to characterize the CTE of the isogrid tube (#25) fabricated for this study along with a tube sample (#12) extracted from a longer isogrid boom. Tube #25 was first tested in the pristine condition. The approximate average CTE (–40oC to +40°C) in the pristine condition of tube #25 is 1.15 ppm/°C. After Z-folding tube #25 over a 15/32-inch radius one time and deploying it using inflation pressure, the boom had an average CTE (-40oC and +40°C) of approximately 1.15 ppm/°C. Therefore it appears that folding has no effect on the CTE of the boom, but further testing is required to verify this initial result, especially with respect to the orientation of the fold line of the tube during the testing. The results from the section of isogrid boom (#12) cut from a longer boom are slightly lower than tube #25. After four thermal cycles, the average CTE (-40 and +40°C) is approximately 0.82 ppm/°C, while the maximum CTE was approximately 0.95 ppm/°C after the fourth thermal cycle (Fig. 22). From these results, it American Institute of Aeronautics and Astronautics 0 0 0.001 0.002 0.003 0.004 0.005 0.006 0.007 0.008 Flexural Strain, in/in Flexural Stress, ksi 27C -150C -100C -50C 23C 50C 75C 100C Figure 20. Tow Flexural Stress vs. Strain Figure 21. Isogrid Tube During CTE Testing
  • 9. 9 is apparent that thermal cycling stabilizes the CTE of the isogrid boom. Like the tow CTE testing, the results of these tests revealed a number of issues that will be optimized in the future in order to further reduce the CTE of the structure, thereby making it closer to the ROM predictions in Figure 11. CTE ≅ 0.82 ppm/°C CTE ≅ 0.95 ppm/°C Figure 22. Isogrid CTE Results; Tube #012 The test stand used to obtain the tensile and compressive elastic modulus, as well as the preliminary creep data is described in detail elsewhere4. The boom is mounted horizontally on the test frame inside an 18- inch diameter by 52-inch long radiant heater. Axial and compressive loads are applied using a computer controlled, servomotor driven, linear motion system. Fiber optic strain gages were used because they were better suited for mounting to the ribs of the isogrid structure than typical bonded resistance type strain gages. Four strain gages were mounted 90o apart at the center of the boom. The use of fiber optic strain gages and associated signal conditioning necessitated using two different data acquisition systems, one for the strain gages and one for the load cell and thermocouples. Twelve thermocouples were used to measure temperature. They were arranged in three groups of four gages. The gage groups were located approximately six inches from each end of the tube and in the center. The four gages at each location were located 90° apart. For elastic modulus testing and creep testing the tube was loaded with approximately 50-lbf (1400-psi). For elastic modulus testing a cross-head rate of 0.05-in/min was used to apply the load. The load was then held and the tube allowed to relax until the strain gages stabilized. Tensile and compression tests were performed between 25-64oC. When data collection was completed at the test temperature, the tube was unloaded and allowed to cool. Between elevated temperature tests, a room temperature test was performed to ensure that there were no structural changes in the tube caused by the heating. The results from the tensile and compression modulus testing are shown in Figures 23 and 24. Tensile Modulus Vs. Temperature IM9 (48K)/TP283E Isogrid Boom #042 25 30 35 40 45 50 Figure 23. Isogrid Tensile Modulus Results 30 25 20 15 10 5 0 Compression Modulus Vs. Temperature IM9 (48K)/TP283E Isogrid Boom #042 30 25 20 15 10 5 The average tensile modulus of the boom from 28-47oC is 24.5-Msi ± 0.3-Msi. Normalized to 60% fiber volume fraction, the tensile modulus of the boom is 25.5-MSI. These compressive modulus test values compare favorably (within 1%) with the predicted ROM modulus as seen in Figure 10. The average compressive modulus of the boom from 25-58oC is 21.8-Msi ± 1.5-Msi. Normalized to 60% fiber volume fraction, the compressive modulus of the tube was 22.6- Msi. This value also compares favorably (within 10%) with the rule of mixtures predictions in Figure 10. The behavior of the boom changes dramatically at approximately 55-59oC. At these temperatures, for both the compressive and tensile cases, the boom exhibited viscoelastic behavior. As seen in Figure 25 for the compressive loading case at 64oC, strain relaxation occurs where the load was held at 50-lbf. This behavior occurs because of the large drop in modulus of the resin above Tg. At temperatures above 55oC the modulus becomes temperature and time dependent. These tests indicate that the viscoelastic American Institute of Aeronautics and Astronautics Temperature (OC) Modulus (MSI) Vf=57.8 Figure 24. Isogrid Compression Modulus Results 0 25 35 45 55 Temperature (OC) Modulus (MSI) Vf=57.8%
  • 10. 10 behavior of the boom must be considered during design and deployment. 5 0 -5 -10 -15 -20 -25 Since understanding the viscoelastic behavior of the boom is fundamental to understanding boom performance, preliminary creep tests were performed. Strain relaxation data were obtained at four temperatures between 46oC and 65 °C. The time constant for the relaxation at each temperature was obtained from equation (3).   = − ε ε τ where ε(t) is the strain at any instant in time, ε∞ is the strain at steady state, t is time, and τ is the time constant. A plot of the time constant vs. 1/T is shown in Figure 26. 1000 100 10 The trend line represents the behavior of the material predicted by the Arrhenius equation (4). RT (4) Where T is the temperature in Kelvin, and R American Institute of Aeronautics and Astronautics ΔE is a constant related to the activation energy and has units of K. The Arrhenius equation can be used to predict the creep behavior of the boom outside of the temperature range measured. For example, a typical operating temperature for the boom is 10°C (283 K). The predicted time constant at this temperature is 94,504 seconds or 26.25 hours. This is the time required for 63% of the strain relaxation to occur. 98% of the strain relaxation will occur at 4 time constants or 105 hours. The final boom test performed at JMU was the compression to failure at elevated temperature test. The expected maximum use temperature of a boom of this construction is 35oC. With a safety factor of 5oC, it was decided that the tube should tested at approximately 40oC. For this test the tube was loaded in compression at a strain rate of 0.05 in/min. The tube failed in rib buckling at 418.2-lbf, 11681.6-psi in compression at 40.6oC (Figure 27). These results compare favorably to the predictions obtained by using ILC’s isogrid analytical model1,3. Using the inputs in Table 9 and the ROM modulus at 57.8% Vf of 24.5- Msi, the predicted compressive failure load is 443-lbf in rib buckling, which is 5.6% above the actual load. Summary and Conclusions The results of the testing discussed herein clearly illustrate the excellent agreement between rule of mixtures mechanical predictions and ILC’s rigidizable composite isogrid structure test values in the temperature range of approximately –40oC to 55oC. The isogrid boom exhibits viscoelastic behavior above those temperatures. The high failure load of the TP283E/IM9 (48K) isogrid boom of 418-lbf at 40oC also shows that the booms are structurally sound up to the expected use temperature of 35oC. ILC’s isogrid analytical model predicts the failure load accurately at temperatures of at least 40oC. Isogrid technology is also scalable to tens and hundreds of feet in length and has been demonstrated in continuous lengths up to 23 feet (Fig. 28). The results of the composite tow tensile tests indicate that the modulus the TP283E/IM9 composite is Micro-Strain vs. Time for Compression Test at 64oC for Isogrid Boom #042; Vf=57.8% -30 0 50 100 150 200 250 300 Time (s) Micro-Strain (avg. of 4 gages) At 234.5 seconds the load was held at 50- lbf and the boom was allowed to relax Constant Load Strain Fluctuations correspond to cycling of heaters Figure 25. Isogrid Boom Strain Relaxation Curve (3)       − ∞ t (t) 1 e Figure 27. Isogrid Boom #042 During Compressive Failure E oe Δ − τ =τ τ= 2E-19e15427/T R2 = 0.9836 1 0.00295 0.003 0.00305 0.0031 0.00315 1/T (1/K) τ (s) Figure 26. Relationship between the Time Constant for Strain Relaxation and Temperature
  • 11. 11 unaffected by up to five 180 degree folding and deployment cycles over a 15/32-inch radius. Future testing will be conducted to reduce this fold radius. These tests also indicate that the ultimate tensile strength of the tows is within 25% of the ultimate tensile strength of the IM9 fibers. This tight folding can be achieved by the large reduction in flexural modulus of the tows at elevated temperatures (65% reduced at 75oC, 80% reduced at 100oC, and 95% reduced at 125oC). These folding tests indicate the high packing efficiency that can be obtained with ILC’s isogrid booms with no reduction in tensile modulus. The CTE tests indicate that ILC’s TP283E/IM9 isogrid booms have a near-zero CTE of approximately 1 ppm/oC. The initial results of these tests also indicate that there are no apparent folding effects on the CTE of isogrid. Root causes at the structural and tow level were identified to reduce the CTE of the booms in the future and bring them closer to rule of mixtures thermal predictions. The strain relaxation testing on the isogrid booms also indicated that the structure will become stable to creep at 10oC at approximately four days after deployment. Acknowledgments Figure 28. 7” diameter, 23 foot long, Isogrid Boom in test at NASA-LaRC The authors thank Mr. Jim McManus from Luna Innovations, Inc. for the donation of the strain displacement devices for the thermo-mechanical testing of the isogrid boom at JMU. The authors also thank JPL and DARPA for supporting the composite testing at The Aerospace Corporation. References 1. Cadogan, D.P., Lin, J.K, Sapna, G.H., Scarborough, S.E., “Space Inflatable Technology Development for Solar Sails and Other Gossamer Applications: GR/SMP Isogrid Boom Development Final Report,” NASA Task Order 10442, ILC Dover, Inc., October, 2001. 2. Darooka, D.K., S.E. Scarborough, and D.P Cadogan, “An Evaluation of Inflatable Truss Frame For Space Applications,” AIAA-2001-1614, 42nd AIAA/ASME/ ASCE/AHS/ASC Structures, Structural Dynamics, and Materials Conference and Exhibit AIAA Gossamer Spacecraft Forum, April 16-19, 2001. 3. Lin, J.K., G.H. Sapna, Cadogan, D.P., S.E. Scarborough, “Inflatable Rigidizable Isogrid Boom Development,” AIAA-2002-1297, 43rd AIAA/ASME/ ASCE/AHS/ASC Structures, Structural Dynamics, and Materials Conference and Exhibit AIAA Gossamer Spacecraft Forum, April 22-25, 2002. 4. Pederson, L.M., Blandino, J.R., Woods-Vedler, J.A., “Determination of the Modulus of Elasticity as a Function of Temperature for an Isogrid Tube,” AIAA 2002-1334, Proceedings of the 43rd AIAA/ASME/ASCE/AHS/ASC Structures, Structural Dynamics and Materials Conference, Denver, CO, 22- 25 April, 2002. 5. Cadogan, D.P. and S.E. Scarborough “Rigidizable Materials for use in Gossamer Space Inflatable Structures,”42nd AIAA/ASME/ASCE/AHS/ASC Structures, Structural Dynamics, and Materials Conference & Exhibit AIAA Gossamer Spacecraft Forum, Seattle, WA, April 16-19, 2001. 6. Mikulas, M.M., Jr., “Structural Efficiency of Long, Lightly Loaded Truss and Isogrid Columns for Space Applications,” NASA Technical Memorandum 78687, July 1978. 7. Darooka, D.K., S. Scarborough, S. Malghan, D. Cadogan, C. Knoll, “Inflatable Space Frame,” Final Report, NASA Prime Contract Number: NAS1-99154, July 2000. 8. Cadogan, D.P., S.E. Scarborough, J.K. Lin, G.H. Sapna, “Shape Memory Polymer Composite Development For Use in Gossamer Space Inflatable Structures,” AIAA-2002-1372, 43rd AIAA/ASME/ ASCE/AHS/ASC Structures, Structural Dynamics, and Materials Conference and Exhibit AIAA Gossamer Spacecraft Forum, April 22-25, 2002. 9. Hexcel Magnamite IM9 Carbon Fiber Product Data Sheet, March 2002. American Institute of Aeronautics and Astronautics