14-mal heruntergeladen


![Neue Kommandozeilenparameter
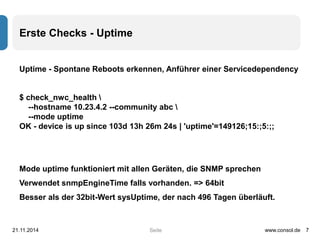
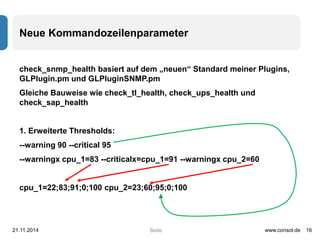
check_nwc_health … --mode hardware-health -vv
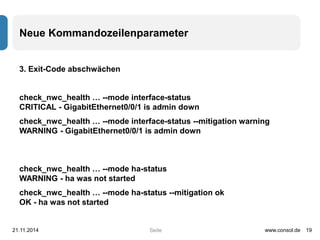
I am a Cisco NX-OS(tm) n7000,
…
[SENSOR_21718]
entPhysicalIndex: 21718
entSensorMeasuredEntity: undef
entSensorPrecision: 0
entSensorScale: units
entSensorStatus: nonoperational
entSensorType: Celsius
entSensorValue: -128
info: celsius sensor 21718 is nonoperational
…
21.11.2014 www.consol.de 21
Seite](https://image.slidesharecdn.com/checknwchealth-141121080755-conversion-gate02/85/Open-Source-Monitoring-von-Netzwerkkomponenten-mit-check_nwc_health-21-320.jpg)

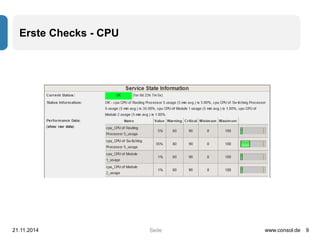
![Interface-Checks – Freie Steckplätze im Switch
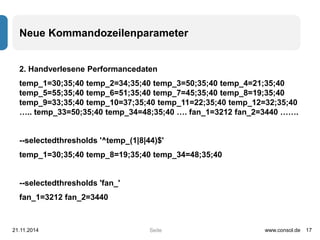
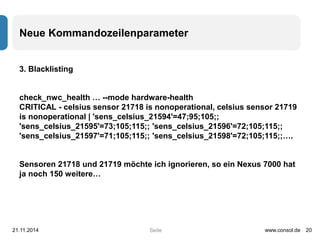
--mode interface-availability [--lookback 3600*24*30 o.ä., Default 1800]
21.11.2014 www.consol.de 31
Seite](https://image.slidesharecdn.com/checknwchealth-141121080755-conversion-gate02/85/Open-Source-Monitoring-von-Netzwerkkomponenten-mit-check_nwc_health-31-320.jpg)
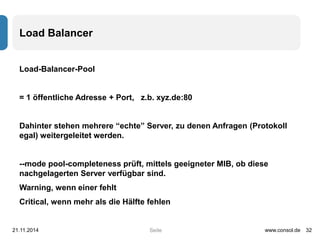
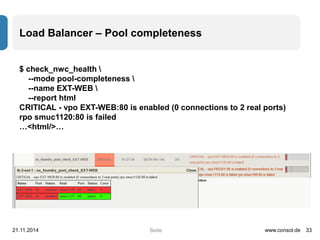
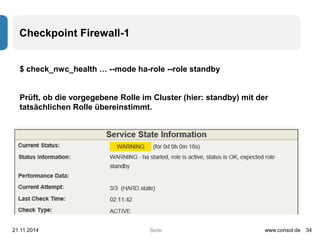
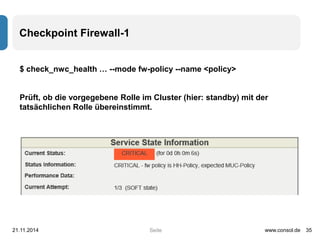
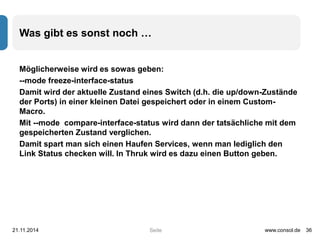


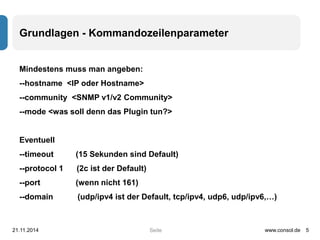
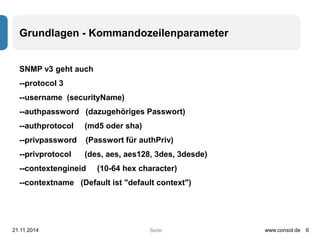
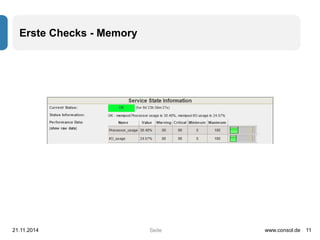
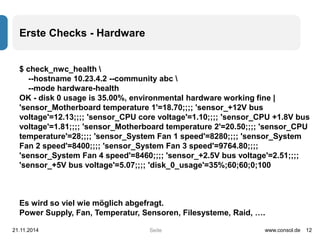
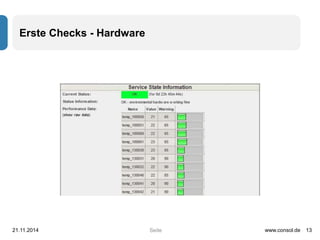
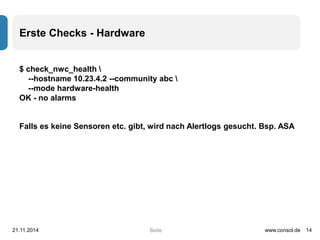
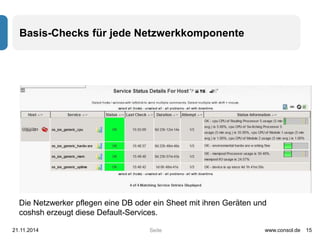
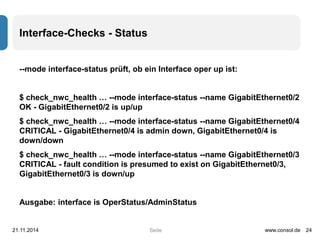
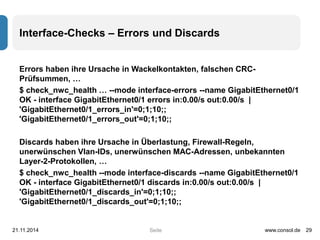
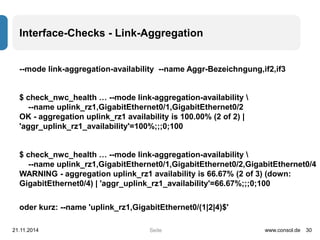
Das Dokument beschreibt die Nutzung und Einrichtung des 'check_nwc_health'-Plugins für die Überwachung von Netzwerkgeräten mithilfe von SNMP. Es erklärt die grundlegenden Kommandozeilenparameter sowie spezifische Checks für Uptime, CPU, Speicher und Hardware-Status, während es auch erweiterte Optionen wie Blacklisting und Performance-Datenanalysen umfasst. Zudem werden Beispiele für die Überwachung von Schnittstellen, deren Status, Fehler und Nutzung bereitgestellt.


