The Perils of Chasing Hot Sectors
•
0 gefällt mir•317 views

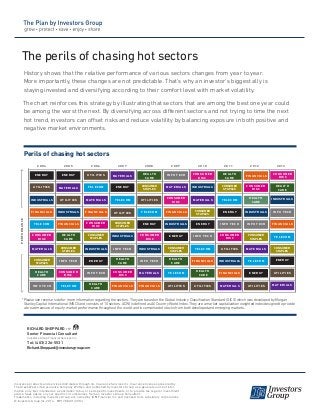
History shows that the relative performance of various sectors changes from year to year. More importantly, these changes are not predictable. That’s why an investor’s biggest ally is staying invested and diversifying according to their comfort level with market volatility. The chart reinforces this strategy by illustrating that sectors that are among the best one year could be among the worst the next. By diversifying across different sectors and not trying to time the next hot trend, investors can offset risks and reduce volatility by balancing exposure in both positive and negative market environments.

Empfohlen
Weitere ähnliche Inhalte
Mehr von Richard Sheppard
Kürzlich hochgeladen
Kürzlich hochgeladen (20)
The Perils of Chasing Hot Sectors
- 1. *Please see reverse side for more information regarding the sectors. They are based on the Global Industry Classification Standard (GICS) which was developed by Morgan Stanley Capital International (MSCI) and consists of 10 sectors. ACWI is defined as All Country World Index. They are a market capitalization weighted index designed to provide a broad measure of equity-market performance throughout the world and is comprised of stocks from both developed and emerging markets. Perils of chasing hot sectors The perils of chasing hot sectors History shows that the relative performance of various sectors changes from year to year. More importantly, these changes are not predictable. That’s why an investor’s biggest ally is staying invested and diversifying according to their comfort level with market volatility. The chart reinforces this strategy by illustrating that sectors that are among the best one year could be among the worst the next. By diversifying across different sectors and not trying to time the next hot trend, investors can offset risks and reduce volatility by balancing exposure in both positive and negative market environments. Insurance products and services distributed through I.G. Insurance Services Inc. Insurance license sponsored by The Great-West Life Assurance Company. Written and published by Investors Group as a general source of infor- mation only. Not intended as a solicitation to buy or sell specific investments, or to provide tax, legal or investment advice. Seek advice on your specific circumstances from an Investors Group Consultant. Trademarks, including Investors Group, are owned by IGM Financial Inc. and licensed to its subsidiary corporations. © Investors Group Inc. 2014 MP1788 (01/2014) RICHARD SHEPPARD CFP Senior Financial Consultant Investors Group Financial Services Inc. Tel: (403) 226-5531 Richard.Sheppard@investorsgroup.com performance 2004 2005 2006 2007 2008 2009 2010 2011 2012 2013 25.83 utilities telecom materials financials consumer staples industrials energy Info Tech materials energy telecom utilities consumer staples industrials Info Tech financials consumer staples utilities telecom energy industrials Info Tech materials financials Info Tech materials financials industrials energy consumer staples telecom utilities industrials materials consumer staples energy Info Tech telecom financials utilities consumer staples telecom energy Info Tech utilities industrials financials materials financials industrials Info Tech consumer staples materials telecom energy energy utilities industrials financials consumer staples Info Tech telecom materials energy industrials financials telecom consumer disc materials consumer staples health care Info Tech utilities industrials Info Tech financials telecom consumer staples energy utilities materialsutilities consumer disc consumer disc consumer disc consumer disc consumer disc consumer disc consumer disc consumer disc consumer disc health care health care health care health care health care health care health care health care health care
- 2. info tech health care industrials energy consumer staples consumer disc utilities materials telecomfinancials msci acwi/ information technology msci acwi/ industrials msci acwi/ health care msci acwi/ financials msci acwi/ energy msci acwi/ consumer staples msci acwi/ consumer discretionary msci acwi/ utilities msci acwi/ materials msci acwi/ telecom services The chart on the reverse was based on the All Country World Index (ACWI) developed by Morgan Stanley Capital International (MSCI). The MSCI ACWI are a market capitalization weighted index designed to provide a broad measure of equity-market performance throughout the world and is comprised of stocks from both developed and emerging markets. The MSCI ACWI use the 10 sectors constructed by the Global Industry Classification Standard.