M&A CorpDev Briefing Deal Stats
•
0 gefällt mir•134 views

M&A and capital deal sumamry for YE 2019

Empfohlen
Weitere ähnliche Inhalte
Was ist angesagt?
Was ist angesagt? (20)
Ähnlich wie M&A CorpDev Briefing Deal Stats
Ähnlich wie M&A CorpDev Briefing Deal Stats (20)
Mehr von Charles Bedard
Mehr von Charles Bedard (20)
Kürzlich hochgeladen
Kürzlich hochgeladen (20)
M&A CorpDev Briefing Deal Stats
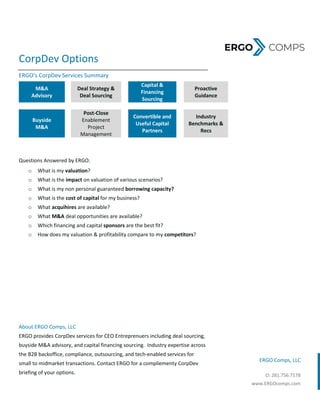
- 1. ERGO Comps, LLC O: 281.756.7178 www.ERGOcomps.com CorpDev Options ERGO’s CorpDev Services Summary M&A Advisory Deal Strategy & Deal Sourcing Capital & Financing Sourcing Proactive Guidance Buyside M&A Post-Close Enablement Project Management Convertible and Useful Capital Partners Industry Benchmarks & Recs Questions Answered by ERGO. o What is my valuation? o What is the impact on valuation of various scenarios? o What is my non personal guaranteed borrowing capacity? o What is the cost of capital for my business? o What acquihires are available? o What M&A deal opportunities are available? o Which financing and capital sponsors are the best fit? o How does my valuation & profitability compare to my competitors? About ERGO Comps, LLC ERGO provides CorpDev services for CEO Entreprenuers including deal sourcing, buyside M&A advisory, and capital financing sourcing. Industry expertise across the B2B backoffice, compliance, outsourcing, and tech-enabled services for small to midmarket transactions. Contact ERGO for a compliementy CorpDev briefing of your options.
- 2. ERGO Comps, LLC O: 281.756.7178 www.ERGOcomps.com 2020 CorpDev Opportunities & Trends Beyond the cloud solution opportunities include 1 Capitalize on the shift from services to subscription solutions 2 Tech-enabled commands a higher valuation and capital funding The initial phase 1 impact of SaaS, digital transformation and embracing the cloud was the opportunity to change from a pure Services model to capture additional benefits of the cloud with phase 2 capturing the impact from emerging technologies. Examples includes o BpaaS industry models o Professional Services vs. Subscription Solution models o The “Everything-as-a-Service” economy The forecast for 2020 builds upon the previous 2 years positive deal trends with an increase for AI and FinTech while Internet Services and Professional Services deal count are flat or minimally decreasing YoY. Capitalizing on the “As-a-Service” Economy Trends Deal Briefing Recap by Year 2020 – Service providers evolve into recurring subscription solution providers 2019 – Leveraging AI, RPA, bots, and emerging tech capabilities; tech-enabled firms capture the deals 2018 – Shift to the cloud and rise of digital transformation 2017 – Adoption of “Moneyball” analytics, and application of analytics 2016 – The power of apps marketplaces and network effects 2012 – Proliferation of SaaS
- 3. ERGO Comps, LLC O: 281.756.7178 www.ERGOcomps.com 2019 M&A CorpDev Deals Recap by B2B Industry Industry categories with the most acqusition deals for companies with USA headquarters1 as of December 1st 2019 4,909 acqusitions across the USA 2019, versus 4300 per year avg. over the past decade. Multiple alternatives to traditional M&A acquisitions exist, but still represent a minority of deal transactions. 1 Source: Crunchbase, excludes mobile, credit, fraud, leasing, lending, video streaming, college, education, transportation, B2C, shopping. Overlap across categories exists. This data is not intended to be exhaustive but merely an illustrative snapshot. Industry Categories 2019 YTD* Total 2010 - 2019* Avg Per year Information Technology 678 4577 509 Consulting 271 1784 198 Marketing 194 1286 143 SaaS 192 1041 116 Internet 187 1998 222 Advertising 178 1759 195 Insurance 174 1393 155 Information Services 94 852 95 Cloud Computing 68 545 61 Human Resources 66 418 46 Finance 61 705 78 FinTech 53 374 42 CRM 53 399 44 B2B 50 207 23 Social Media 43 719 80 Recruiting 40 240 27 Staffing Agency 36 202 22 Accounting 29 159 18 Public Relations 21 261 29 Sales 18 89 10 Small and medium business 13 121 13 Outsourcing 9 124 14 Digital Marketing 3 207 23 LeadGeneration 3 63 7 M&A Deals since 2010 4,909 38,910 4,323 M&A By Type 2019* total Avg Per year MBO (Management Buyout) 4 58 6 Acquihire 15 253 28 LBO 421 2,800 311 M&A 4,428 31,737 3,526
- 4. ERGO Comps, LLC O: 281.756.7178 www.ERGOcomps.com Acqusition Deal Stats by Industry Financial and Internet represent the industries with the greatest deals2 2 *As of December 1st 2019 Overlap exits Excludes Credit, Leasing, Fraud, Collection, Lending, Streaming, Bitcoin, Voip, Exchanges, Education, Delivery, Consumer , Commerce and Shopping, Transporation Acqui # Acqui # Acqui # Acqui # Acqui # Acqui # Acqui # Acqui # Acqui # Acqui # Acqui # Acqui # Industry Category Groups 2010 2011 2012 2013 2014 2015 2016 2017 2018 2019* total Avg AI 12 17 15 29 37 66 71 92 134 141 614 68 Administrative Services 23 31 25 29 34 59 91 119 135 111 657 73 Advertising 106 156 117 132 206 207 248 260 254 188 1874 208 Financial Services 168 245 257 263 363 479 627 696 742 568 4408 490 Internet Services 373 442 441 446 485 529 616 524 549 485 4890 543 Professional Services 62 79 89 53 93 129 167 217 271 213 1373 153 Sales & Marketing 197 261 232 243 307 370 480 509 522 391 3512 390
- 5. ERGO Comps, LLC O: 281.756.7178 www.ERGOcomps.com 2019 Capital Funding Deals Recap by B2B Industry Capital Funding Top 10 Funded B2B Categories for companies with USA headquarters3 as of December 1st 2019 Funding over the past few years continues to trend positively propelled by emering new technologies beyond the cloud across industries, but forecast below for 2019 the funding amount across North America compared to 2017 and 2018 In 2019, more than 7,846 firms funded ($213B captial invested) versus 11,229 firms funded in 2018 for a total of $234B compared to 10,849 deals in 2017 for $184B 203 USA startups founded in 2019 with funding YTD Greater number of deals and continuing positive trend increase for AI, and Financial while Internet Services and Professional Services deal count are flat or minimally decreasing over the past period. 3 Source: Crunchbase, excludes mobile, credit, fraud, leasing, lending, video streaming, college, education, transportation, B2C, shopping. Overlap across categories exists. This data is not intended to be exhaustive but merely an illustrative snapshot. Most # Funded Categories # of Firms Funded Capital Funded $ 1 Information Technology 751 $19,717,718,590 2 Internet 555 $13,137,611,213 3 SaaS 504 $8,936,745,564 4 FinTech 250 $83,691,637,502 5 Finance 206 $12,640,296,528 6 Marketing 154 $4,388,259,264 7 Advertising 148 $3,318,249,111 8 Human Resources 132 $2,208,268,613 9 Information Services 129 $3,436,261,239 10 B2B 118 $1,125,350,304 11 Cloud Computing 114 $3,637,603,705 12 Insurance 83 $2,851,523,682 13 Recruiting 70 $1,188,390,206 14 Consulting 60 $158,545,608 15 Small and medium business 53 $2,408,986,306 16 Sales 43 $1,005,422,000 17 Accounting 23 $306,380,000 18 Staffing Agency 15 $90,937,485 19 LeadGeneration 9 $99,448,213 20 Outsourcing 2 $770,000,000
- 6. ERGO Comps, LLC O: 281.756.7178 www.ERGOcomps.com Model Comparables Business Models Have Changed BPaaS versus traditional models comparables Model Type Services Outsourcing BPaaS Business Model Nonrecurring project- based services Outsourced functional services based on cost savings via “Lift and Shift” staffing model Managed solutions delivered via the cloud for transaction processing and recurring services Contract Length Project based 1 to 3 years 3+ years Rev/FTE $200k <$100k >$200k Recurring Revenues <10% 20% to 60% >65% Gross Profit Margin 25% to 45% 35% to 55% >65% Valuation (Revenue) <1X 2X >2X Source: Based on private company award winning top performers. Business models have changed. Tech-enablement is changing how work gets done as top performers have meaninfully higher Rev and Profits per FTE than competitors “Everyting-as-a-Service” is shifting the customer-employer relationship to a different set of values, deliverables, and SLAs. Where work gets done is changing to include more on-demand via a virtual tech-enabled workforce outside tradiontal FTE employment Insitutional investors continue to value long-term contracts, defensabile market positions, and models with 10X opportunity Fundamentals have changed. Strategics value NLTV over CAC Focus on double digit growth and profitability Industry solutions command a premium price Deal stats and drivers have changed. Maximizing Enterprise Value requires not only spending more than competitors (link), but having a better model that demonstrates better profitability and return Tech-enabled multiples outperform traditional services and outsourcing
- 7. ERGO Comps, LLC O: 281.756.7178 www.ERGOcomps.com Deal Multiple Analysis Based on SG&A Spend Companies with a higher SG&A were on average larger and commanded a higher multiple Know the Value of Your Practice The value of your practice depends on your internal capabilities, financial measures (size, scalability, profitability, Quality of Earnings, Customers, & Assets), as well as your industry comparables; and it also depends on your external options to Grow, Buy, Sell, License, or Divest. M&A Subscale Deals Multiple <$25m Revenue Valuation .2x 0.5 1.0 1.5 2.0 2.5 Staffing Consulting Recurring Solutions Outsourcing AaS Valuation Impact Analysis Based on Size Impact of subscale versus scaled status on EV: 30% discount for scaled private versus public comparables, with 40% discount for subscaled with significant earnout and terms differences Impact of recurring solutions on EV at scale: <1x EV/Revenue multiple for project non- recurring versus >2x for recurring outsourcing/subscription with 12 month contract at scale with a premium for tech-enabled >2.5x Impact of scaled acquisitions on EV: EV lift of 1.3x for acquisition of recurring solutions beyond acquired revenues plus the valuation arbitrage impact
- 8. ERGO Comps, LLC O: 281.756.7178 www.ERGOcomps.com Model Comparables of Award Winners by Industry Average Rev/FTE for B2B Industry INC 5000 award winners Opportunities & Trends → Virtual service models are replacing onsite and local vendors → Entrepreneurs are less reliant on local vendors, and more often choosing cloud solutions for backoffice & services infrastructure → Star performers are more profitable, earning 65% more per client and 24% more per full-time employee → Leaders are bundling services with cloud “As-A-Service” solutions → Portfolio expansion “beyond basic services” includes analytics, software, and apps → Emergence of alternative models to traditional professional service based Accounting, Consulting, and Staffing → Acquisition of emerging leaders by Accounting, Consulting, Staffing, and Outsourcing Industry 2007 2008 2009 2010 2011 2012 2013 2014 2015 2016 2017 2018 2019 Avg Advertising & Marketing 275,344$ 290,484$ 324,995$ 333,491$ 343,520$ 302,417$ 305,372$ 345,153$ 319,824$ 310,227$ 317,931$ 323,631$ 329,684$ 319,988$ Business Products & Services 359,160$ 405,704$ 482,822$ 439,354$ 449,895$ 403,772$ 370,381$ 387,813$ 395,363$ 342,211$ 414,933$ 387,495$ 413,566$ 407,446$ Financial Services 533,639$ 608,156$ 443,526$ 456,945$ 529,840$ 370,955$ 387,875$ 532,238$ 636,770$ 563,822$ 420,753$ 365,358$ 346,504$ 468,826$ Government Services 215,775$ 235,483$ 456,227$ 284,383$ 306,921$ 296,170$ 293,607$ 326,212$ 306,475$ 343,548$ 352,581$ 339,508$ 461,927$ 330,404$ Human Resources 339,863$ 517,339$ 634,748$ 511,514$ 385,259$ 420,087$ 391,678$ 498,680$ 580,804$ 431,589$ 417,367$ 384,617$ 342,930$ 455,294$ Insurance 461,501$ 367,541$ 519,907$ 410,719$ 445,144$ 391,224$ 457,082$ 399,724$ 367,881$ 450,045$ 591,828$ 558,285$ 479,082$ 460,933$ IT Services 237,145$ 219,851$ 242,542$ 229,522$ 270,433$ 298,459$ 278,472$ 271,161$ 264,058$ 269,174$ 256,866$ 265610 324,797$ 261,621$ Media 315,905$ 254,133$ 234,467$ 278,877$ 343,891$ 308,597$ 316,067$ 296,370$ 284,659$ 348,548$ 322,550$ 337,672$ 376,279$ 345,013$
- 9. ERGO Comps, LLC O: 281.756.7178 www.ERGOcomps.com CorpDev Briefing Why Conduct a CorpDev Briefing with ERGO Checklist Determine how current trends impact your options Review M&A deal opportunities Identify 10X opportunities and ideas to outsmart your competition Compare your current vs future valuation based on various scenarios Model the impact and ROI of various scenarios Rank and prioritize deal segments and options CorpDev Opportunities Strategy DESCRIPTION Acquihires Acquire talent by competency and/or geography or industry leaders Assets Acquire IP, Tech, Brands, and related assets to boost your reach and profitability Books Acquire customers to facilitate market growth Industry Leaders Industry solutions includes deeper scope and premium pricing Solution Leaders Solutions boost recurring revenues ERGO has in-depth industry coverage areas and will help define and execute long-term CorpDev strategies. Briefing → For a complete list of deal opportunities, contact ERGO to schedule your CorpDev briefing. Buyside Advisory CorpDev Services Partner