Quantifying trends of rainfall and temperature extremes over Central Tanzania to guide targeting of climate smart technologies
•Als PPTX, PDF herunterladen•
0 gefällt mir•221 views

Poster prepared by Francis Muthoni, Exavery Kigosi and Shitindi Mawazo for the Africa RISING ESA Project Review and Planning Meeting, Dar es Salaam, Tanzania, 11-12 September 2019.
Empfohlen

Empfohlen
Weitere ähnliche Inhalte
Was ist angesagt?
Was ist angesagt? (20)
Ähnlich wie Quantifying trends of rainfall and temperature extremes over Central Tanzania to guide targeting of climate smart technologies
Ähnlich wie Quantifying trends of rainfall and temperature extremes over Central Tanzania to guide targeting of climate smart technologies (20)
Mehr von africa-rising
Mehr von africa-rising (20)
Kürzlich hochgeladen
Kürzlich hochgeladen (20)
Quantifying trends of rainfall and temperature extremes over Central Tanzania to guide targeting of climate smart technologies
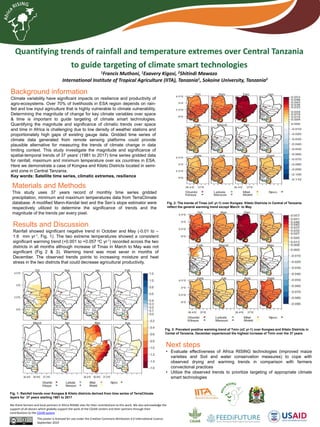
- 1. This poster is licensed for use under the Creative Commons Attribution 4.0 International Licence. September 2019 We thank farmers and local partners in Africa RISING sites for their contributions to this work. We also acknowledge the support of all donors which globally support the work of the CGIAR centers and their partners through their contributions to the CGIAR system Background information Climate variability have significant impacts on resilience and productivity of agro-ecosystems. Over 70% of livelihoods in ESA region depends on rain- fed and low input agriculture that is highly vulnerable to climate vulnerability. Determining the magnitude of change for key climate variables over space & time is important to guide targeting of climate smart technologies. Quantifying the magnitude and significance of climatic trends over space and time in Africa is challenging due to low density of weather stations and proportionately high gaps of existing gauge data. Gridded time series of climate data generated from remote sensing platforms could provide plausible alternative for measuring the trends of climate change in data limiting context. This study investigate the magnitude and significance of spatial-temporal trends of 37 years’ (1981 to 2017) time series gridded data for rainfall, maximum and minimum temperature over six countries in ESA. Here we demonstrate a case of Kongwa and Kiteto Districts located in semi- arid zone in Central Tanzania. Key words: Satellite time series, climatic extremes, resilience Materials and Methods This study uses 37 years record of monthly time series gridded precipitation, minimum and maximum temperatures data from TerraClimate database. A modified Mann-Kendal test and the Sen’s slope estimator were respectively utilized to determine the significance of trends and the magnitude of the trends per every pixel. Results and Discussion Rainfall showed significant negative trend in October and May (-0.01 to – 1.6 mm yr-1, Fig. 1). The two extreme temperatures showed a consistent significant warming trend (+0.001 to +0.057 oC yr-1) recorded across the two districts in all months although increase of Tmax in March to May was not significant (Fig 2 & 3). Warming trend was most sever in months of December. The observed trends points to increasing moisture and heat stress in the two districts that could decrease agricultural productivity. Next steps • Evaluate effectiveness of Africa RISING technologies (improved maize varieties and Soil and water conservation measures) to cope with observed drying and warming trends in comparison with farmers convectional practices • Utilize the observed trends to prioritize targeting of appropriate climate smart technologies Fig. 1: Rainfall trends over Kongwa & Kiteto districts derived from time series of TerraClimate layers for 37 years starting 1981 to 2017 Quantifying trends of rainfall and temperature extremes over Central Tanzania to guide targeting of climate smart technologies International Institute of Tropical Agriculture (IITA), Tanzania1, Sokoine University, Tanzania2 1Francis Muthoni, 1Exavery Kigosi, 2Shitindi Mawazo Fig. 3: Prevalent positive warming trend of Tmin (oC yr-1) over Kongwa and Kiteto Districts in Cental of Tanzania. December experienced the highest increase of Tmin over the 37 years Fig. 2: The trends of Tmax (oC yr-1) over Kongwa Kiteto Districts in Central of Tanzania reflect the general warming trend except March to May