SlideShare ist ein Scribd-Unternehmen logo
1 von 12
Downloaden Sie, um offline zu lesen
Research Journal of Finance and Accounting www.iiste.org
ISSN 2222-1697 (Paper) ISSN 2222-2847 (Online)
Vol 3, No 3, 2012
28
Distribution of Risk and Return: A Statistical Test of Normality on Dhaka Stock
Exchange
Md. Mahbubul Haque Khan1*
Umma Rumana Huq2
1. Department of Business Administration, East West University, Dhaka, Bangladesh
2. School of Business & Economics, United International University, Dhaka, Bangladesh
* E-mail of the corresponding author: minmhk@gmail.com
Abstract
The present study deals with the normal distribution of risk and return of the capital market of Bangladesh.
Normal distribution of return is an essential assumption in the field of efficient market hypothesis which
posits that the returns of a market must follow the random walk behaviour. Again it is an integral part of
Capital Asset Pricing Model, which suggests that if an investor wants to get higher return then he must
consider higher risk, this denotes to the normal distribution of risk and return. This study has used a set of
parametric and non-parametric tools to examine the returns calculated from the three indices of Dhaka
Stock Exchange: DGEN (from 2002 to 2010), DSE20 (from 2002 to 2010) and DSI (from 2006 to 2010).
As positive skewness and kurtosis are evident in most of the cases, the returns are found to be suffering
from some extremities. Daily, weekly and monthly returns are not normally distributed which shows the
contra-evidence of random walk behaviour of market return. Besides the inconsistency between risk and
return (daily and weekly) is found, which suggests that additional return may be achieved without having
exposure to additional risk.
Keywords: Dhaka Stock Exchange, Efficient Market Hypothesis, Kurtosis, Non-parametric Test, Normal
Distribution, Parametric Test, Risk and Return, Skewness.
1. Introduction
Test of normality is an important study in the field of statistical research, as there are so many statistical
tests and models which assume the sample data set to be normally distributed. There are some capital
market models which also assume that the data set (returns) must be normally distributed e.g., Capital Asset
Pricing Model (CAPM). This paper is going to focus on the normality assumption of Efficient Market
Hypothesis (EMH), where EMH posits that stock market return must follow random walk behaviour, which
denotes to the normal distribution of risk and return. Basically Efficient Market Hypothesis tells us that the
security prices fully reflect all available information (Fama, 1970). For this reason a person having a piece
of information cannot expect to predict the future price and have some abnormal gain on that information if
the market is held to be efficient. So, the future price must be always random and unpredictable. A person
can only earn higher return by bearing higher risk. Hence the efficient market hypothesis can play an
important role in investment strategy formulation. In an inefficient market as the return distribution is
somewhat skewed, there, the probability for a particular return can be assumed. The technicians by using
their technical trading rules can earn riskless profit in this circumstance. Investors can also be able to find
out the implication of time horizon in their investment strategy to earn abnormal return. But in an efficient
market condition, an investor has to bear an additional amount of risk for an additional amount of return.
Basically here return is considered as a compensation for risk. The capital market of Bangladesh is an
emerging market in South Asia. Day by day capital market is becoming an integral part of the economy of
Bangladesh. Studies performed on market efficiency of the capital market of Bangladesh are not so many.
And most of the articles present that the market is still not found weak form efficient (Mollah et al., 2005;
Rahman and Hossain, 2006; Mobarek et al., 2008; Mollik and Bepari, 2009; and Nisar and Hanif, 2011).
Besides some calendar anomalies like ‘Saturday Effect’, ‘April Effect’ and seasonality in monthly return
Research Journal of Finance and Accounting www.iiste.org
ISSN 2222-1697 (Paper) ISSN 2222-2847 (Online)
Vol 3, No 3, 2012
29
series (Hossain, 2004; and Bepari and Mollik, 2009) are also evident in the capital market of Bangladesh.
As the evidence suggests that the market is not efficient in Bangladesh, the risk and return distribution will
not be normal. So basically this paper is going to examine whether and to what extent the risk and returns
are normally distributed in the capital market of Bangladesh within the sample time period. Again this
paper can also be able to validate some of the previous findings from the literature.
2. Literature Review
Testing normality and market efficiency of capital markets has been a prime area of interest for researchers
for a long time. In this part we are going to present some findings from the literature of both national
(Bangladesh) and international (rest of the world) context. And at the end we will try to show the gap in the
literature and the justification for the present study.
Aggarwal and Rivoli (1989) examined the efficiency in functioning of four large capital markets of Asia by
studying to find out seasonal and daily patterns in stock returns of these markets. With twelve years data
(September 1976-June 1988), the study concluded on the existence of such seasonal patterns in those
markets. The study found out the existence of ‘January effect’ in markets of Hong Kong, Singapore and
Malaysia. In addition to that, ‘day-of-the-week effect’ was also present in those markets in the form of low
Monday returns and strong ‘Tuesday effect’. Aparacio and Estrada (1997) strongly rejected the notion of
normality in daily stock returns in their study on thirteen European securities market. The study used data
of period 1990-1995. By using time series of daily stock returns, they argued that normality can be assumed
for monthly returns but not for daily returns. Galai and Kedar-Levy (2002), in their working paper series,
found the existence of day-of-the-effect on their study on Tel-Aviv stock exchange. They applied non-
parametric tests and multiple comparison procedures on a data set of the period 1988-1998. The findings
revealed that the first and last trading days’ returns were closely related than to any other day of the week.
Aly, Mehdian and Perry (2004) analyzed Day-of-the-week effect on Egyptian stock market with a four-day
trading week. The study reported that returns do not vary among days in week indicating the absence of any
such patterns. They also concluded on the weak form efficiency on Egyptian capital market. Naqvi (2004)
tested the random-walk behavior of Karachi Stock Exchange in his study using KSE-100 index. The
research employed normality test, autocorrelation using Q-statistic and Dickey-Fuller test on the data set of
the period 1994-2004. The Karachi Stock Exchange was found to be weak form efficient in both weekly
and monthly return series. Agrawal (2005) tested how the sample size can have an impact on the normality
assumption of stock returns and came up with the conclusion that it really had. According to his research
carried out on the stock returns of Nifty and Sensex, daily stock returns with large sample size were not
normally distributed while monthly stock returns with small sample size were normally distributed. Onder
and Zaman (2005) examined how the test statistics for the normality test of errors can have a different
result if the regression residuals from robust regression are used in place of OLS residuals. They actually
found out that such use leads to significantly superior ability in detecting lack of normality in suitable
situations. O. (2008) attempted to test normality and market efficiency on Nigerian Stock Exchange. He
examined that though in recent years Nigerian stock exchange has been growing rapidly in terms of volume
trading and market capitalization; the market was not weak form efficient the stock returns were not
normally distributed. The study was conducted using monthly all share index from January 1993 to
December 2007 and the methods used for the analysis included Skewness, Kurtosis, Jarque-Bera, Runs test
etc. He added to recommend reducing transaction costs and minimizing institutional restrictions on trading
to improve market activities. Das and Bhattacharjee (2009) attempted to build up a graphical tool to check
and visualize the normality of a dataset using empirical distribution function and K-S test statistic. Jeyanthi
(2010) tested the weak-form efficiency of Asian emerging stock markets. The study used daily price
indices of China, Indonesia, Kuala Lumpur, Korea, Taiwan and India for the period of April 1998 to March
2009. The study showed varying results as the K-S test, runs test, autocorrelation test and LB test proved
that these markets were not weak-form efficient but on the other hand unit root test significantly proved the
existence of weak-form efficiency among the markets. Kumar and Dhankar (2011) applied a set of
parametric and non-parametric tests on Indian Stock Market to find out whether the risk and return of that
market are distributed normally. They examined three listed indices of Bombay Stock Exchange for the
period 1996 to 2006 and found the evidence of non-normality in case of daily and weekly returns but
Research Journal of Finance and Accounting www.iiste.org
ISSN 2222-1697 (Paper) ISSN 2222-2847 (Online)
Vol 3, No 3, 2012
30
normality in case of monthly and annual returns. Besides their study pointed out negative skewness in
returns and emphasized on time horizon in investment strategy.
Such research on testing of normality and market efficiency has also been practiced on the stock market of
Bangladesh namely Dhaka Stock Exchange (DSE). Hossain (2004) studied on the small banking portfolios
in Bangladesh to find out any existence of days-of-the-week effect. The study revealed the existence of
‘Saturday Effect’ as Saturday was the then first trading day following the weekend. The study also
identified the existence of ‘beginning of the week effect’ while buying and ‘weekend effect’ while selling
securities. Rahman, Salat and Bhuiyan (2004) proved in their study that Dhaka Stock Exchange is weak-
form efficient. They used monthly index of DSE for the period of 1990-2003 to apply unit root test and
came up to support the null hypothesis of random walk model. Mollah, Rahman and Islam (2005) analyzed
the behavior of daily DSE 20 index and prices of the securities. The ARMA, ARIMA, ACF, PACF and
Dimson’s Market Model identified that the return series was a stationary time series and the market was not
weak-form efficient. Islam and Khaled (2005) applied heteroscedasticity-adjusted methods to test for weak-
form efficiency of Dhaka Stock Exchange as historic study results gave conflicting evidences on weak form
efficiency. They found that if the heteroscedasticity-robust test is used instead of an autocorrelation test
then the result can be transformed from weak form inefficiency to weak form efficiency. Rahman and
Hossain (2006) carried out a study to find whether Dhaka Stock Exchange is weak-form efficient assuming
the data set is normally distributed. They applied both parametric and non-parametric tests on two
renowned indices of the market from 1994-2005. The study concluded on the ground that the daily return
series was not normally distributed and the market was not weak-form efficient. Mobarek et al. (2008)
sought to find evidence on the randomness and independence of the return series of Dhaka Stock Exchange.
Various statistical models like K-S test, Runs test, Auto-Correlation test, ARIMA model etc were run on
the daily price index from 1988 to 2000. The study found that security returns did not follow the random
walk model. The existence of significant auto-correlation coefficient at different time lags proved the
market to be weak-form inefficient. She also added that such inefficiency might be due to delay in
dissemination of price-sensitive information or biases in the responses of market participants. Bepari and
Mollik (2009) investigated the presence of seasonality in monthly return series of DSE All Share Price
Index for the period from 1993 to 2006. Their research confirmed the existence of monthly effect in the
form of ‘April effect’ instead of ‘January effect’. They also added to confirm that the market was not weak-
form efficient meaning investors could earn above average income. Rahman, Ara and Zheng Sr. (2009)
used a variety of volatility models such as GARCH model, Random walk model and Autoregressive model
to test the volatility of Dhaka Stock Exchange returns from 1999 to 2004. The study found the market
return to be more volatile after 27 November, 2001. Mollik and Bepari (2009) examined the weak-form
efficiency of Dhaka Stock exchange by adjusting for the thin trading problem. The data set covered DSE
General Index and DSE 20 index for the period of 2002-2007. The study found that the returns are not
normally distributed and the market failed to be weak-form efficient. Nisar and Hanif (2011) tested the
weak-form efficiency on four emerging stock markets in Asia including Bangladesh. According to their
Runs test, Durbin-Watson test and Unit Root test which they applied on the monthly, weekly and daily
return series of the markets from 1997 to 2011, none of the markets showed to be weak form efficient.
Mollik and Bepari (2011) attempted to measure the risk-return relationship in Dhaka Stock exchange. Their
study found pretty straight, anticipated positive relationship between risk and return for both single security
and portfolio. Still the less significant positive risk-return relationship for high risk portfolios might suggest
existence of mispricing or market anomalies.
From the literature it is quite apparent that on the capital market of Bangladesh there is a lack of study
particularly on risk and return distribution or normality test, though we know that this is a pre-requisite for
so many statistical and financial models. Some researchers have also worked on normality test as a part of
their research. Again for testing the normality of return basically researchers have commonly chosen
Kolmogorov Smirnov test as a non-parametric test (Rahman and Hossain, 2006; Mobarek et al., 2008; and
Kumar and Dhankar, 2011). But Razali and Wah (2011) compared among the Shapiro-Wilk test,
Kolmogorov-Smirnov test, Lilliefors and Anderson-Darling test and found that irrespective of the
distribution of observations Shapiro Wilk test is the most powerful test and Kolmogorov Smirnov is the
Research Journal of Finance and Accounting www.iiste.org
ISSN 2222-1697 (Paper) ISSN 2222-2847 (Online)
Vol 3, No 3, 2012
31
least powerful test, besides Lilliefors test always outperforms the Kolmogorov Smirnov test. So the present
study has incorporated Kolmogorov-Smirnov test with Lilliefors correction and Shapiro Wilk test for
conducting the research. We have also found that Kumar and Dhankar (2011) have used F-test or Analysis
of Variance test to find out the distribution of risk. But F-test assumes the sample observations to be
normally distributed, so in this research we have used Kruskal-Wallis test (a non-parametric test which can
be compared with one way ANOVA test) along with F-test. Moreover the present study has completely
concentrated on test of normality of risk and return of the capital market of Bangladesh.
3. Methodology and Data Sources
Returns calculated from the capital market indices are widely used as the proxies for the market return.
Dhaka Stock Exchange (DSE) has three indices to represent the capital market of Bangladesh. In this study
we have used the three indices of DSE to calculate the market return on a daily, weekly, monthly and
annual basis. DSE General Index (DGEN) consists of A, B, G and N categories of listed shares of Dhaka
Stock Exchange. In our study we have considered DGEN from January 2002 to December 2010. DSE20
Index consists of 20 blue chip shares listed in DSE. The sample period for DSE20 is January 2002-
December 2010. DSE All Share Price Index (DSI) includes all the shares listed in DSE. The authority of
DSE stopped calculating this index from 08 December 2003. The authority reintroduced this index on 28
March 2005. So there was a discontinuity in DSI index and finally here we have considered DSI from
January 2006-December 2010 as the sample period.
Besides, we have also considered three sub-periods (2002-2004, 2005-2007, and 2008-2010) of DGEN and
DSE20 to find out whether the samples have emerged from the same population. During the whole period
2002-2010 we see (Graph 1) the capital market of Bangladesh had an increasing trend. From 2002 to 2004
the market was quite flat and during 2005-2007 the market experienced some fluctuations. But during the
period 2008 to 2010 the market really observed a tremendous growth. Basically that time the market was
highly influenced by the IPO of Grameen Phone Ltd. (the largest mobile phone operator of Bangladesh).
Daily market return jumped at 20.38% on 16 November 2009 after the debut of Grameen Phone share on
Dhaka Stock Exchange, which also pulled the market index to a record high. The Financial Express, a
popular financial newspaper of Bangladesh reported on 17 November 2009 in the following way:
‘Shares of Grameen Phone (GP) climbed 2.5 times higher than its face value at the Dhaka Stock Exchange
(DSE) Monday after the country's largest mobile phone operator made debut, sending the indices to a
record high’.
In this study we have used natural logarithmic return for the ease and simplicity of use and calculated in the
following way:
Return on index at time period t = ln ( It / It-1 ), where It is the index price at time period t and It-1 is the price
of index at time period previous t. We have considered only the changes in stock price and overlooked any
dividend payment.
We have used several parametric and non-parametric tests to determine whether the risk and return
calculated from our samples are normally distributed. We have used Kolmogorov Smirnov (K-S test with
Lilliefors Significance Correction) test and Shapiro Wilk test to find out whether the returns calculated
from our sample data fit normal distribution. The significance of the test statistic will reject the assumption
of normality in respective sample data (Pallant, 2005). One way ANOVA (Analysis of Variance or F-test)
and Kruskal-Wallis (K-W) tests are applied on returns calculated from the three sub-periods’ sample data to
find out whether these have emerged from the same population. If these are found not to be emerged from
the same population then we have concluded that risk is not normally distributed (Kumar and Dhankar,
2011). All the tests are assumed at 5% level of significance.
4. Major Findings
4.1 Risk and Return Distribution of Daily Return (2002-2010)
In this part basically we have three statistical tables presenting the facts related to normality of daily return
of Dhaka Stock Exchange. If we have a look on Table 1 then we find that the index DGEN has a positive
skewness whereas DSE20 index is negatively skewed. Kurtosis for both the indices is greater than zero. So
Research Journal of Finance and Accounting www.iiste.org
ISSN 2222-1697 (Paper) ISSN 2222-2847 (Online)
Vol 3, No 3, 2012
32
from the perspective of skewness and kurtosis we find a violation of normality. Again test statistics for K-S
and Shapiro Wilk tests are significant which means the return distribution is not normal for the daily return
within the sample period. This finding is also consistent with other findings where the day of the week
effect on this market is evident.
From Table 2 we get the statistical summary of daily returns from 2002 to 2010 for three non-overlapping
sub-periods- 2002-2004, 2005-2007 and 2008-2010. DGEN exhibits negative skewness in 2005-2007
period and positive skewness for the other two periods. Daily return from DSE20 index is negatively
skewed for all the periods. Kurtosis is higher than zero for all the sub-periods, which is a symptom of non-
normality. If there is higher kurtosis than normal, then more of the variability can be explained by the fewer
observations’ extreme differences from the mean. And we observe kurtosis for DGEN in 2008-2010 is
abnormally high. The same is not observed in DSE20. So, the returns of the securities beyond DSE20 are
held liable for this abnormality. Information from the market suggests, this has happened for the IPO of
Grameen Phone Ltd. (the largest mobile phone operator in Bangladesh) within that sub-period. For both
DGEN and DSE20 indices K-S and Shapiro Wilk test statistics are significant. So these show non-
normality in daily return of each sub-period.
As we see that the Levene Statisitc in Table 3 is significant for both the indices, F-value will not be able to
provide a correct decision about the sample. So we need to rely on Welch and Brown-Forsythe test statistic
for the decision. And we find both the tests indicate that the three samples have emerged from the same
population, hence the risk for the three sub-periods will not significantly differ from each other. By being
not significant at 5% level of significance, Kruskal-Wallis (K-W in Table 2) test statistic supports the same
finding.
4.2 Risk and Return Distribution of Weekly Return (2002-2010)
This part deals with the risk and return distribution of weekly return of Dhaka Stock Exchange. Table 4
shows some statistics of weekly return of DGEN and DSE20 during the period 2002-2010. DGEN shows
higher weekly return than that of DSE20. Skewness and kurtosis are positive for both the indices, this
denotes to non-normality. Kurtosis in weekly return has been reduced than that we observed in daily return
(40.512). So it is quite apparent that due to any abnormally high daily return that situation emerged. But
still K-S and Shapiro Wilk tests results are significant which tells us that weekly returns are not normally
distributed.
From Table 5 we see that the K-S and Shapiro Wilk tests are not significant for DGEN in the sub-period
2005-2007 and for DSE20 in the sub-period 2008-2010, which denotes to normal distribution of return
during the respective sub-period for the relevant index. As the Levene Statistic (Table 6) is not significant
at 5% level, we can rely on the F-value. F-statistic and K-W value suggest that risk is normally distributed
for both the indices during the sample period.
4.3 Risk and Return Distribution of Monthly Return (2002-2010)
Table 7 indicates the statistical summary of Monthly Return for the sample period 2002-2010 for DGEN
and DSE20. Here the K-S and Shapiro Wilk Statistics are not significant for both of the indices. This
signals that the monthly returns are not normally distributed. But if we look at the sub-periods then we find
except for DSE20 in 2002-2004 sub-period, all the sub-periods of both the indices are normally distributed.
From the F-value and K-W statistic (Table 8) we find the sub-periods for both the indices have emerged
from the same population, because we see the test results are not significant at 5% level of significance,
which also tells about the normal distribution of risk during the sample period. We can rely on the F-value
as Levene test statistic from Table 9 is not significant.
4.4 Risk and Return Distribution of Annual Return (2002-2010)
Table 10 presents the statistical summary of the annual returns of two indices for the sample period (2002-
2010). DGEN index provides higher average return than the DSE20 index, though DGEN has a lower
standard deviation. As the K-S and Shapiro Wilk test results are not significant at 5% level of significance,
we can assume the annual returns of the capital market are normally distributed. But still as the number of
observations is too low, we should not rely on these statistics.
Research Journal of Finance and Accounting www.iiste.org
ISSN 2222-1697 (Paper) ISSN 2222-2847 (Online)
Vol 3, No 3, 2012
33
4.5 Risk and Return Distribution of DSI (2006-2010)
Earlier in methodology part we mentioned that due to unavailability of data we could not include another
stock market index DSI (All Share Price Index) of Dhaka Stock Exchange in our previous analysis. But in
this part we are presenting it separately for the time period of 2006-2010. Table 11 presents that the
skewness of daily and weekly returns are positive but monthly return is negative. Kurtosis of daily return is
abnormally high which also supports the findings from daily return of DGEN for the period of 2008-2010.
Shapiro Wilk test statistics are significant for all the daily, weekly and monthly returns. So returns are not
normally distributed.
5. Conclusion
This study has been conducted to examine the risk and return distribution of the stock market of
Bangladesh. This paper has come up with some important points to be noted. In most of the cases returns
are found to be positively skewed, which denotes that most of the returns are concentrated on the left side
of the mean with some extreme values to the right. We have also noticed on 16 November 2009 market
return was 20.38% which is really abnormally high, and it happened due to the debut of Grameen Phone
Ltd. shares to the market. The standard deviation overestimates the downside risk and shows a biased result
due to this positive skewness. We have found kurtosis is too high for the indices DGEN and DSI which
again tells us that more of the variability resulted from the extreme deviations of fewer observations from
the mean. From the indices DGEN and DSI it has become evident that the daily, weekly and monthly
returns are not normally distributed, which denies the random walk behaviour of stock price. This complies
with the previous findings of some researchers who have found calendar anomalies like ‘Saturday Effect’,
‘April Effect’ and seasonality in monthly return series (Hossain, 2004; and Bepari and Mollik, 2009).
Again we have observed risks have been distributed normally in all the cases but daily and weekly returns
have not been normally distributed, so here we find an asymmetry between risk and return relationship. So
investors may have the chance to earn abnormal return i.e., return without bearing sufficient risk. Hence the
market is not efficient which also supports some past studies (Mollah et al., 2005; Rahman and Hossain,
2006; Mobarek et al., 2008; Mollik and Bepari, 2009; and Nisar and Hanif, 2011).
References
Aggarwal, Reena, & Rivoli, Pietra. (1989). Seasonal and Day-of-the-Week Effects in Four Emerging Stock
Markets. The Financial Review, 24(4), 541-550.
Agrawal, Gaurav. (2005). Impact of Sample Size on the Distribution of Stock Returns- An Investigation of
Nifty & Sensex. Paper Presented at 9th
Capital Markets Conference of Indian Institute of Capital Markets.
Aly, Hassan, Mehdian, Seyed, & Perry, Mark J. (2004). An Analysis of Day-of-theWeek Effects in the
Egyptian Stock Market. International Journal of Business, 9(3), 301-308.
Aparicio, Felipe Miguel, & Estrada, Javier. (1997, April). Empirical Distribution of Stock Returns:
European Securities Market, 1990-95. (Working Paper 97-23). Madrid, Spain: Departmento de Economia
de la Empresa. Available at SSRN: http://ssrn.com/abstract=40558.
Bepari, Khokan, & Mollik, Abu Taher. (2009). Seasonalities in the Monthly Stock Returns: Evidence from
Bangladesh Dhaka Stock Exchange (DSE). International Research Journal of Finance and Economics, 24,
167-176.
Das, Kishore K., & Bhattacharjee, Dibyojyoti. (2009). On Using Empirical Distribution Function Plot for
Checking the Normality Assumption of a Data Set. Assam Statistical Review, 22(1), 50-58.
Debutant GP pulls DGEN to all-time high level. (2009, November 17). The Financial Express, Bangladesh.
Fama, Eugene F. (1970). Efficient Capital Markets: A Review of Theory and Empirical Work. Journal of
Finance, 25(2), 383-417.
Research Journal of Finance and Accounting www.iiste.org
ISSN 2222-1697 (Paper) ISSN 2222-2847 (Online)
Vol 3, No 3, 2012
34
Galai, Dan, & Kedar-Levy, Haim. (2002, February). Multiple Comparisons of Return Distributions of
Return Distributions: A New Look at the Day-of-the-Week Effect. Available at SSRN:
http://ssrn.com/abstract=302959.
Hossain, Farhad. (2004). Days of the Week Effect in Dhaka Stock Exchange: Evidence from Small
Portfolios of Banking Sector. Jahangirnagar Review, Part II: Social Science, XXVIII, 73-82.
Islam, Ainul, & Khaled, Mohammed. (2005). Tests of Weak-Form Efficiency of the Dhaka Stock
Exchange. Journal of Business Finance & Accounnting, 32(7-8), 1613-1624.
Jeyanthi, B. J. Queensly. (2010). Weak-Form Market Efficiency in India and Its Emerging Asian
Counterparts. IUP Journal of Public Finance, 8(4), 58-70.
Kumar, Rakesh, & Dhankar, Raj S. (2011). Distribution of Risk and Return: A Test of Normality in Indian
Stock Market. South Asian Journal of Management, 18(1), 109-118.
Mobarek, Asma, Mollah, A. Sabur, & Bhuyan, Rafiqul. (2008). Market Efficiency in Emerging Stock
Market: Evidence from Bangladesh. Journal of Emerging Market Finance, 7(1), 17-41.
Mollah, A. Sabur, Rahman, Muhammad Zahedur, & Islam, Mohammad Saiful. (2005). Return Behavior of
the DSE-20: An Empirical Investigation on the Dhaka Stock Exchange. Journal of Business Studies, 26(2),
151-162.
Mollik, Abu Taher, & Bepari, M Khokan. (2009, August 24). Weak-Form Market Efficiency of Dhaka
Stock Exchange (DSE), Bangladesh. Paper presented at the 22nd
Australasian Finance and Banking
Conference 2009.
Mollik, Abu Taher., & Bepari, Khokon. (2011, August). Risk-Return Trade-Off in Dhaka Stock Exchange,
Bangladesh: An Emerging Market Evidence. Available at SSRN: http://ssrn.com/abstract=1917337.
Naqvi, Syed Ali Abbas. (2004, September). Does KSE-100 Index Follows a Random Walk: An Empirical
Study. BIMCS Department of Management Sciences Working Paper. Available at SSRN:
http://ssrn.com/abstract=693261.
Nisar, Saqib, & Hanif, Muhammad. (2011, November). Testing Weak Form of Efficient Market
Hypothesis: Empirical Evidence from South Asia. World Applied Science Journal, Forthcoming. Available
at SSRN: http://ssrn.com/abstract=1962210.
O., Emenike Kalu. (2008, October). Empirical Test for Weak Form Efficient Market Hypothesis of the
Nigerian Stock Exchange. Working Paper Series. Available at SSRN: http://ssrn.com/abstract=1291273.
Onder, A. Ozlem, & Zaman, Asad. (2005). Robust Tests for Normality of Errors in Regression Models.
Economics Letters, 86, 63-68.
Pallant, Julie. (2005). Descriptive Statistics. In SPSS Survival Manual: A Step by Step Guide to Data
Analysis Using SPSS (2nd
ed., pp. 53-58). Australia: Ligare, Sydney.
Rahman, Mohammad Masudur, Ara, Laila Arjuman, & Zheng Sr., Zhenlong. (2009, April). Jump, Non-
Normal Error Distribution and Stock Price Volatility- A Non-paramedic Specification Test. The Singapore
Economic Review, Available at SSRN: http://ssrn.com/abstract=1500988.
Rahman, Muhammad Zahedur, Salat, Amirus, & Bhuiyan, Mohammad Mominul Hoque. (2004). Testing
Weak-Form Efficiency of the Dhaka Stock Exchange. Journal of Business Studies, 25(2), 175-188.
Rahman, Shofiqur, & Hossain, Farhad. (2006). Weak-Form Efficiency: Testimony of Dhaka Stock
exchange. Journal of Business Research, 8, 1-12.
Razali, Nornadiah Mohd, & Wah, Yap Bee. (2011). Power Comparisons of Shapiro-Wilk, Kolmogorov-
Smirnov, Lilliefors and Anderson-Darling Tests. Journal of Statistical Modeling and Analysis, 2(1), 21-33.
Research Journal of Finance and Accounting www.iiste.org
ISSN 2222-1697 (Paper) ISSN 2222-2847 (Online)
Vol 3, No 3, 2012
35
Table 1. Daily Return (2002-2010)
Daily Return (2002-2010)
Index Mean
Return %
Standard
Deviation %
Skewness Kurtosis K-Sa
Shapiro Wilk
DGEN .10035 1.1815 2.043 40.512 .072* .878*
DSE20 .06906 1.1495 -0.144 4.934 .068* .945*
Note:
a
Lilliefors Significance Correction
* Significant at 5% level of significance; ** Not significant at 5% level of significance
Table 2. Statistical Summary (Daily Return)
Statistical Summary (Daily Return)
Index Period Mean
Return
%
Standard
Deviation
%
Skewness Kurtosis K-Sa
Shapiro
Wilk
F K-W
DGEN 2002-
2004
.1023 .83732 0.042 3.895 .068* .950* .843** 2.73**
2005-
2007
.0589 1.2515 -0.193 4.081 .055* .960*
2008-
2010
.1394 1.4255 3.784 56.631 .087* .801*
DSE20 2002-
2004
.0833 .89790 -0.108 5.957 .077* .926* 1.03** 3.44**
2005-
2007
.0195 1.2754 -0.211 4.394 .065* .951*
2008-
2010
.1019 1.2703 -0.061 3.754 .053* .963*
Note:
a
Lilliefors Significance Correction
* Significant at 5% level of significance; ** Not significant at 5% level of significance
Table 3. Testing the Validity of ANOVA (Daily Return)
Testing the Validity of ANOVA (Daily Return)
Index Test of Homogeneity of
Variances
Robust Tests of Equality of Means
Levene Statistic Welch Brown-Forsythe
DGEN 37.755* .669** .811**
DSE20 35.095* .879** 1.001**
Note:
* Significant at 5% level of significance; ** Not significant at 5% level of significance
Table 4. Weekly Return (2002-2010)
Weekly Return (2002-2010)
Index Mean
Return %
Standard
Deviation %
Skewness Kurtosis K-Sa
Shapiro Wilk
DGEN .48880 2.6132 1.052 7.323 .062* .941*
DSE20 .33671 2.7103 0.482 1.660 .057* .975*
Note:
a
Lilliefors Significance Correction
* Significant at 5% level of significance; ** Not significant at 5% level of significance
Research Journal of Finance and Accounting www.iiste.org
ISSN 2222-1697 (Paper) ISSN 2222-2847 (Online)
Vol 3, No 3, 2012
36
Table 5. Statistical Summary (Weekly Return)
Statistical Summary (Weekly Return)
Index Period Mean
Return
%
Standard
Deviation
%
Skewness Kurtosis K-Sa
Shapiro
Wilk
F K-W
DGEN 2002-
2004
.54876 2.2959 0.618 2.424 .109* .940* .874** 1.07**
2005-
2007
.27000 2.5724 -0.101 1.163 .062** .985**
2008-
2010
.64662 2.9323 1.998 11.958 .088* .883*
DSE20 2002-
2004
.44811 2.5676 0.828 2.038 .092* .959* 1.032** 3.07**
2005-
2007
.08267 2.7801 0.419 2.610 .077* .956*
2008-
2010
.47845 2.7768 0.306 0.563 .069** .985**
Note:
a
Lilliefors Significance Correction
* Significant at 5% level of significance; ** Not significant at 5% level of significance
Table 6. Testing the Validity of ANOVA (Weekly Return)
Testing the Validity of ANOVA (Weekly Return)
Index Test of Homogeneity of
Variances
Robust Tests of Equality of Means
Levene Statistic Welch Brown-Forsythe
DGEN 2.348** 0.841** 0.874**
DSE20 0.685** 0.999** 1.032**
Note:
* Significant at 5% level of significance; ** Not significant at 5% level of significance
Table 7. Monthly Return (2002-2010)
Monthly Return (2002-2010)
Index Mean
Return %
Standard
Deviation %
Skewness Kurtosis K-Sa
Shapiro Wilk
DGEN 2.2467 6.9290 0.182 1.743 .090* .974*
DSE20 1.5971 7.1425 0.459 1.254 .107* .972*
Note:
a
Lilliefors Significance Correction
* Significant at 5% level of significance; ** Not significant at 5% level of significance
Research Journal of Finance and Accounting www.iiste.org
ISSN 2222-1697 (Paper) ISSN 2222-2847 (Online)
Vol 3, No 3, 2012
37
Table 8. Statistical Summary (Monthly Return)
Statistical Summary (Monthly Return)
Index Period Mean
Return
%
Standard
Deviation
%
Skewness Kurtosis K-Sa
Shapiro
Wilk
F K-W
DGEN 2002-
2004
2.7645 5.5627 0.621 -0.044 .145** .958** .636** .88**
2005-
2007
1.1823 7.5129 -0.594 1.664 .140** .949**
2008-
2010
2.8077 7.5594 0.878 1.639 .116** .951**
DSE20 2002-
2004
2.3679 6.1694 0.977 0.604 .174* .923* .786** 1.74**
2005-
2007
0.3920 7.9709 0.558 2.637 .146** .944**
2008-
2010
2.0528 7.1899 0.271 -0.010 .094** .987**
Note:
a
Lilliefors Significance Correction
* Significant at 5% level of significance; ** Not significant at 5% level of significance
Table 9. Testing the Validity of ANOVA (Monthly Return)
Testing the Validity of ANOVA (Monthly Return)
Index Test of Homogeneity of
Variances
Robust Tests of Equality of Means
Levene Statistic Welch Brown-Forsythe
DGEN 0.618** 0.592** 0.639**
DSE20 0.333** 0.723** 0.457**
Note:
* Significant at 5% level of significance; ** Not significant at 5% level of significance
Table 10. Annual Return (2002-2010)
Annual Return (2002-2010)
Index Mean
Return %
Standard
Deviation %
Skewness Kurtosis K-Sa
Shapiro Wilk
DGEN 25.5111 34.7213 0.195 -2.110 .198** .867**
DSE20 17.5554 35.0942 0.374 -1.411 .199** .912**
Note:
a
Lilliefors Significance Correction
* Significant at 5% level of significance; ** Not significant at 5% level of significance
Table 11. DSI Return (2006-2010)
DSI Return (2006-2010)
Index Mean
Return %
Standard
Deviation %
Skewness Kurtosis K-Sa
Shapiro Wilk
Daily .14180 1.3102 2.506 38.414 .061* .875*
Weekly .64306 2.7045 1.411 7.857 .053** .928*
Monthly 2.0721 7.7413 -0.275 2.013 .094* .959*
Note:
a
Lilliefors Significance Correction
* Significant at 5% level of significance; ** Not significant at 5% level of significance
Research Journal of Finance and Accounting www.iiste.org
ISSN 2222-1697 (Paper) ISSN 2222-2847 (Online)
Vol 3, No 3, 2012
38
Graph 1. DSE General Index (DGEN from January 2002-December 2010)
International Journals Call for Paper
The IISTE, a U.S. publisher, is currently hosting the academic journals listed below. The peer review process of the following journals
usually takes LESS THAN 14 business days and IISTE usually publishes a qualified article within 30 days. Authors should
send their full paper to the following email address. More information can be found in the IISTE website : www.iiste.org
Business, Economics, Finance and Management PAPER SUBMISSION EMAIL
European Journal of Business and Management EJBM@iiste.org
Research Journal of Finance and Accounting RJFA@iiste.org
Journal of Economics and Sustainable Development JESD@iiste.org
Information and Knowledge Management IKM@iiste.org
Developing Country Studies DCS@iiste.org
Industrial Engineering Letters IEL@iiste.org
Physical Sciences, Mathematics and Chemistry PAPER SUBMISSION EMAIL
Journal of Natural Sciences Research JNSR@iiste.org
Chemistry and Materials Research CMR@iiste.org
Mathematical Theory and Modeling MTM@iiste.org
Advances in Physics Theories and Applications APTA@iiste.org
Chemical and Process Engineering Research CPER@iiste.org
Engineering, Technology and Systems PAPER SUBMISSION EMAIL
Computer Engineering and Intelligent Systems CEIS@iiste.org
Innovative Systems Design and Engineering ISDE@iiste.org
Journal of Energy Technologies and Policy JETP@iiste.org
Information and Knowledge Management IKM@iiste.org
Control Theory and Informatics CTI@iiste.org
Journal of Information Engineering and Applications JIEA@iiste.org
Industrial Engineering Letters IEL@iiste.org
Network and Complex Systems NCS@iiste.org
Environment, Civil, Materials Sciences PAPER SUBMISSION EMAIL
Journal of Environment and Earth Science JEES@iiste.org
Civil and Environmental Research CER@iiste.org
Journal of Natural Sciences Research JNSR@iiste.org
Civil and Environmental Research CER@iiste.org
Life Science, Food and Medical Sciences PAPER SUBMISSION EMAIL
Journal of Natural Sciences Research JNSR@iiste.org
Journal of Biology, Agriculture and Healthcare JBAH@iiste.org
Food Science and Quality Management FSQM@iiste.org
Chemistry and Materials Research CMR@iiste.org
Education, and other Social Sciences PAPER SUBMISSION EMAIL
Journal of Education and Practice JEP@iiste.org
Journal of Law, Policy and Globalization JLPG@iiste.org
New Media and Mass Communication NMMC@iiste.org
Journal of Energy Technologies and Policy JETP@iiste.org
Historical Research Letter HRL@iiste.org
Public Policy and Administration Research PPAR@iiste.org
International Affairs and Global Strategy IAGS@iiste.org
Research on Humanities and Social Sciences RHSS@iiste.org
Developing Country Studies DCS@iiste.org
Arts and Design Studies ADS@iiste.org
Global knowledge sharing:
EBSCO, Index Copernicus, Ulrich's
Periodicals Directory, JournalTOCS, PKP
Open Archives Harvester, Bielefeld
Academic Search Engine, Elektronische
Zeitschriftenbibliothek EZB, Open J-Gate,
OCLC WorldCat, Universe Digtial Library ,
NewJour, Google Scholar.
IISTE is member of CrossRef. All journals
have high IC Impact Factor Values (ICV).

Weitere ähnliche Inhalte

Was ist angesagt?

Co integration and causality analysis of dynamic linkages
Co integration and causality analysis of dynamic linkagesCo integration and causality analysis of dynamic linkages
Co integration and causality analysis of dynamic linkages
prj_publication
 
Management of shock and volatility spillover effects across equity markets
Management of shock and volatility spillover effects across equity marketsManagement of shock and volatility spillover effects across equity markets
Management of shock and volatility spillover effects across equity markets
prj_publication
 
Persistence performance
Persistence performancePersistence performance
Persistence performance
bfmresearch
 

Was ist angesagt? (19)

The Predictive Power of Intraday-Data Volatility Forecasting Models: A Case S...
The Predictive Power of Intraday-Data Volatility Forecasting Models: A Case S...The Predictive Power of Intraday-Data Volatility Forecasting Models: A Case S...
The Predictive Power of Intraday-Data Volatility Forecasting Models: A Case S...
 
An empirical analysis of efficiency of the nigerian capital market
An empirical analysis of efficiency of the nigerian capital marketAn empirical analysis of efficiency of the nigerian capital market
An empirical analysis of efficiency of the nigerian capital market
 
MODELING THE AUTOREGRESSIVE CAPITAL ASSET PRICING MODEL FOR TOP 10 SELECTED...
  MODELING THE AUTOREGRESSIVE CAPITAL ASSET PRICING MODEL FOR TOP 10 SELECTED...  MODELING THE AUTOREGRESSIVE CAPITAL ASSET PRICING MODEL FOR TOP 10 SELECTED...
MODELING THE AUTOREGRESSIVE CAPITAL ASSET PRICING MODEL FOR TOP 10 SELECTED...
 
The relationship between the eps the market stock return
The relationship between the eps the market stock returnThe relationship between the eps the market stock return
The relationship between the eps the market stock return
 
Determinants of equity share prices of the listed company in dhaka stock exch...
Determinants of equity share prices of the listed company in dhaka stock exch...Determinants of equity share prices of the listed company in dhaka stock exch...
Determinants of equity share prices of the listed company in dhaka stock exch...
 
Contingency table analysis and its benefit for organization. (MCB)
Contingency table analysis and its benefit for organization. (MCB)Contingency table analysis and its benefit for organization. (MCB)
Contingency table analysis and its benefit for organization. (MCB)
 
Indian Stock Market Using Machine Learning(Volume1, oct 2017)
Indian Stock Market Using Machine Learning(Volume1, oct 2017)Indian Stock Market Using Machine Learning(Volume1, oct 2017)
Indian Stock Market Using Machine Learning(Volume1, oct 2017)
 
Co integration and causality analysis of dynamic linkages
Co integration and causality analysis of dynamic linkagesCo integration and causality analysis of dynamic linkages
Co integration and causality analysis of dynamic linkages
 
Ijmet 10 01_176
Ijmet 10 01_176Ijmet 10 01_176
Ijmet 10 01_176
 
A STUDY ON COMPARITIVE ANALYSIS OF VOLATILITY OF EQUITY SHARE PRICES FOR SELE...
A STUDY ON COMPARITIVE ANALYSIS OF VOLATILITY OF EQUITY SHARE PRICES FOR SELE...A STUDY ON COMPARITIVE ANALYSIS OF VOLATILITY OF EQUITY SHARE PRICES FOR SELE...
A STUDY ON COMPARITIVE ANALYSIS OF VOLATILITY OF EQUITY SHARE PRICES FOR SELE...
 
Value investing and emerging markets
Value investing and emerging marketsValue investing and emerging markets
Value investing and emerging markets
 
AN EMPRICAL ANALYSIS ON THE IMPACT OF SIZE-EFFECT OF THE FIRM ON STOCK RETURN...
AN EMPRICAL ANALYSIS ON THE IMPACT OF SIZE-EFFECT OF THE FIRM ON STOCK RETURN...AN EMPRICAL ANALYSIS ON THE IMPACT OF SIZE-EFFECT OF THE FIRM ON STOCK RETURN...
AN EMPRICAL ANALYSIS ON THE IMPACT OF SIZE-EFFECT OF THE FIRM ON STOCK RETURN...
 
A REVIEW OF STOCK TREND PREDICTION WITH COMBINATION OF EFFECTIVE MULTI TECHNI...
A REVIEW OF STOCK TREND PREDICTION WITH COMBINATION OF EFFECTIVE MULTI TECHNI...A REVIEW OF STOCK TREND PREDICTION WITH COMBINATION OF EFFECTIVE MULTI TECHNI...
A REVIEW OF STOCK TREND PREDICTION WITH COMBINATION OF EFFECTIVE MULTI TECHNI...
 
Z-Score Bankruptcy Prediction Model and Stock Prices of The Cigarette Compani...
Z-Score Bankruptcy Prediction Model and Stock Prices of The Cigarette Compani...Z-Score Bankruptcy Prediction Model and Stock Prices of The Cigarette Compani...
Z-Score Bankruptcy Prediction Model and Stock Prices of The Cigarette Compani...
 
Management of shock and volatility spillover effects across equity markets
Management of shock and volatility spillover effects across equity marketsManagement of shock and volatility spillover effects across equity markets
Management of shock and volatility spillover effects across equity markets
 
The Draft
The DraftThe Draft
The Draft
 
Persistence performance
Persistence performancePersistence performance
Persistence performance
 
Markov chain model application on share price movement in stock market
Markov chain model application on share price movement in stock marketMarkov chain model application on share price movement in stock market
Markov chain model application on share price movement in stock market
 
World Finance Conference - Momentum strategies
World Finance Conference - Momentum strategies World Finance Conference - Momentum strategies
World Finance Conference - Momentum strategies
 

Ähnlich wie 11.distribution of risk and return a statistical test of normality on dhaka stock exchange

An Empirical Assessment of Capital Asset Pricing Model with Reference to Nati...
An Empirical Assessment of Capital Asset Pricing Model with Reference to Nati...An Empirical Assessment of Capital Asset Pricing Model with Reference to Nati...
An Empirical Assessment of Capital Asset Pricing Model with Reference to Nati...
ijtsrd
 
Ajekwe et al. 2017 testing the random walk theory in the nigerian stock market
Ajekwe et al. 2017 testing the random walk theory in the nigerian stock marketAjekwe et al. 2017 testing the random walk theory in the nigerian stock market
Ajekwe et al. 2017 testing the random walk theory in the nigerian stock market
Nicholas Adzor
 

Ähnlich wie 11.distribution of risk and return a statistical test of normality on dhaka stock exchange (20)

Day of the week effect
Day of the week effectDay of the week effect
Day of the week effect
 
Stock market efficiency of pakistan stock exchange a review of literature fro...
Stock market efficiency of pakistan stock exchange a review of literature fro...Stock market efficiency of pakistan stock exchange a review of literature fro...
Stock market efficiency of pakistan stock exchange a review of literature fro...
 
An Empirical Assessment of Capital Asset Pricing Model with Reference to Nati...
An Empirical Assessment of Capital Asset Pricing Model with Reference to Nati...An Empirical Assessment of Capital Asset Pricing Model with Reference to Nati...
An Empirical Assessment of Capital Asset Pricing Model with Reference to Nati...
 
The Informational Efficiency Hypothesis Of Markets: Theoretical Presentation ...
The Informational Efficiency Hypothesis Of Markets: Theoretical Presentation ...The Informational Efficiency Hypothesis Of Markets: Theoretical Presentation ...
The Informational Efficiency Hypothesis Of Markets: Theoretical Presentation ...
 
Testing the Weak–Form Market Efficiency on the Borsa Istanbul (BIST) Sustaina...
Testing the Weak–Form Market Efficiency on the Borsa Istanbul (BIST) Sustaina...Testing the Weak–Form Market Efficiency on the Borsa Istanbul (BIST) Sustaina...
Testing the Weak–Form Market Efficiency on the Borsa Istanbul (BIST) Sustaina...
 
Dividend_Announcement_and_Share_Prices_A-7.pdf
Dividend_Announcement_and_Share_Prices_A-7.pdfDividend_Announcement_and_Share_Prices_A-7.pdf
Dividend_Announcement_and_Share_Prices_A-7.pdf
 
Analysis of relationship between stock return, trade volume and volatility ev...
Analysis of relationship between stock return, trade volume and volatility ev...Analysis of relationship between stock return, trade volume and volatility ev...
Analysis of relationship between stock return, trade volume and volatility ev...
 
Efficient market hypothesis and nigerian stock market
Efficient market hypothesis and nigerian stock marketEfficient market hypothesis and nigerian stock market
Efficient market hypothesis and nigerian stock market
 
11.efficient market hypothesis and nigerian stock market
11.efficient market hypothesis and nigerian stock market11.efficient market hypothesis and nigerian stock market
11.efficient market hypothesis and nigerian stock market
 
Final thesis
Final thesisFinal thesis
Final thesis
 
B5 stock return & liquidity
B5 stock return & liquidityB5 stock return & liquidity
B5 stock return & liquidity
 
Ajekwe et al. 2017 testing the random walk theory in the nigerian stock market
Ajekwe et al. 2017 testing the random walk theory in the nigerian stock marketAjekwe et al. 2017 testing the random walk theory in the nigerian stock market
Ajekwe et al. 2017 testing the random walk theory in the nigerian stock market
 
Paper 1 liquidity and stock return
Paper 1   liquidity and stock returnPaper 1   liquidity and stock return
Paper 1 liquidity and stock return
 
Are good companies good stocks evidence from nairobi stock exchange
Are good companies good stocks evidence from nairobi stock exchangeAre good companies good stocks evidence from nairobi stock exchange
Are good companies good stocks evidence from nairobi stock exchange
 
A Critical Review Of The Market Efficiency Concept
A Critical Review Of The Market Efficiency ConceptA Critical Review Of The Market Efficiency Concept
A Critical Review Of The Market Efficiency Concept
 
Do Predictive Power of Fibonacci Retracements Help the Investor to Predict Fu...
Do Predictive Power of Fibonacci Retracements Help the Investor to Predict Fu...Do Predictive Power of Fibonacci Retracements Help the Investor to Predict Fu...
Do Predictive Power of Fibonacci Retracements Help the Investor to Predict Fu...
 
Mall and afsl
Mall and afslMall and afsl
Mall and afsl
 
11.exchange rate volatility and stock market behaviour the nigerian experience
11.exchange rate volatility and stock market behaviour the nigerian experience11.exchange rate volatility and stock market behaviour the nigerian experience
11.exchange rate volatility and stock market behaviour the nigerian experience
 
Impact of macroeconomic variables on stock returns
Impact of macroeconomic variables on stock returnsImpact of macroeconomic variables on stock returns
Impact of macroeconomic variables on stock returns
 
Forecasting Stocks with Multivariate Time Series Models.
Forecasting Stocks with Multivariate Time Series Models.Forecasting Stocks with Multivariate Time Series Models.
Forecasting Stocks with Multivariate Time Series Models.
 

Mehr von Alexander Decker

Abnormalities of hormones and inflammatory cytokines in women affected with p...
Abnormalities of hormones and inflammatory cytokines in women affected with p...Abnormalities of hormones and inflammatory cytokines in women affected with p...
Abnormalities of hormones and inflammatory cytokines in women affected with p...
Alexander Decker
 
A usability evaluation framework for b2 c e commerce websites
A usability evaluation framework for b2 c e commerce websitesA usability evaluation framework for b2 c e commerce websites
A usability evaluation framework for b2 c e commerce websites
Alexander Decker
 
A universal model for managing the marketing executives in nigerian banks
A universal model for managing the marketing executives in nigerian banksA universal model for managing the marketing executives in nigerian banks
A universal model for managing the marketing executives in nigerian banks
Alexander Decker
 
A unique common fixed point theorems in generalized d
A unique common fixed point theorems in generalized dA unique common fixed point theorems in generalized d
A unique common fixed point theorems in generalized d
Alexander Decker
 
A trends of salmonella and antibiotic resistance
A trends of salmonella and antibiotic resistanceA trends of salmonella and antibiotic resistance
A trends of salmonella and antibiotic resistance
Alexander Decker
 
A transformational generative approach towards understanding al-istifham
A transformational  generative approach towards understanding al-istifhamA transformational  generative approach towards understanding al-istifham
A transformational generative approach towards understanding al-istifham
Alexander Decker
 
A time series analysis of the determinants of savings in namibia
A time series analysis of the determinants of savings in namibiaA time series analysis of the determinants of savings in namibia
A time series analysis of the determinants of savings in namibia
Alexander Decker
 
A therapy for physical and mental fitness of school children
A therapy for physical and mental fitness of school childrenA therapy for physical and mental fitness of school children
A therapy for physical and mental fitness of school children
Alexander Decker
 
A theory of efficiency for managing the marketing executives in nigerian banks
A theory of efficiency for managing the marketing executives in nigerian banksA theory of efficiency for managing the marketing executives in nigerian banks
A theory of efficiency for managing the marketing executives in nigerian banks
Alexander Decker
 
A systematic evaluation of link budget for
A systematic evaluation of link budget forA systematic evaluation of link budget for
A systematic evaluation of link budget for
Alexander Decker
 
A synthetic review of contraceptive supplies in punjab
A synthetic review of contraceptive supplies in punjabA synthetic review of contraceptive supplies in punjab
A synthetic review of contraceptive supplies in punjab
Alexander Decker
 
A synthesis of taylor’s and fayol’s management approaches for managing market...
A synthesis of taylor’s and fayol’s management approaches for managing market...A synthesis of taylor’s and fayol’s management approaches for managing market...
A synthesis of taylor’s and fayol’s management approaches for managing market...
Alexander Decker
 
A survey paper on sequence pattern mining with incremental
A survey paper on sequence pattern mining with incrementalA survey paper on sequence pattern mining with incremental
A survey paper on sequence pattern mining with incremental
Alexander Decker
 
A survey on live virtual machine migrations and its techniques
A survey on live virtual machine migrations and its techniquesA survey on live virtual machine migrations and its techniques
A survey on live virtual machine migrations and its techniques
Alexander Decker
 
A survey on data mining and analysis in hadoop and mongo db
A survey on data mining and analysis in hadoop and mongo dbA survey on data mining and analysis in hadoop and mongo db
A survey on data mining and analysis in hadoop and mongo db
Alexander Decker
 
A survey on challenges to the media cloud
A survey on challenges to the media cloudA survey on challenges to the media cloud
A survey on challenges to the media cloud
Alexander Decker
 
A survey of provenance leveraged
A survey of provenance leveragedA survey of provenance leveraged
A survey of provenance leveraged
Alexander Decker
 
A survey of private equity investments in kenya
A survey of private equity investments in kenyaA survey of private equity investments in kenya
A survey of private equity investments in kenya
Alexander Decker
 
A study to measures the financial health of
A study to measures the financial health ofA study to measures the financial health of
A study to measures the financial health of
Alexander Decker
 

Mehr von Alexander Decker (20)

Abnormalities of hormones and inflammatory cytokines in women affected with p...
Abnormalities of hormones and inflammatory cytokines in women affected with p...Abnormalities of hormones and inflammatory cytokines in women affected with p...
Abnormalities of hormones and inflammatory cytokines in women affected with p...
 
A validation of the adverse childhood experiences scale in
A validation of the adverse childhood experiences scale inA validation of the adverse childhood experiences scale in
A validation of the adverse childhood experiences scale in
 
A usability evaluation framework for b2 c e commerce websites
A usability evaluation framework for b2 c e commerce websitesA usability evaluation framework for b2 c e commerce websites
A usability evaluation framework for b2 c e commerce websites
 
A universal model for managing the marketing executives in nigerian banks
A universal model for managing the marketing executives in nigerian banksA universal model for managing the marketing executives in nigerian banks
A universal model for managing the marketing executives in nigerian banks
 
A unique common fixed point theorems in generalized d
A unique common fixed point theorems in generalized dA unique common fixed point theorems in generalized d
A unique common fixed point theorems in generalized d
 
A trends of salmonella and antibiotic resistance
A trends of salmonella and antibiotic resistanceA trends of salmonella and antibiotic resistance
A trends of salmonella and antibiotic resistance
 
A transformational generative approach towards understanding al-istifham
A transformational  generative approach towards understanding al-istifhamA transformational  generative approach towards understanding al-istifham
A transformational generative approach towards understanding al-istifham
 
A time series analysis of the determinants of savings in namibia
A time series analysis of the determinants of savings in namibiaA time series analysis of the determinants of savings in namibia
A time series analysis of the determinants of savings in namibia
 
A therapy for physical and mental fitness of school children
A therapy for physical and mental fitness of school childrenA therapy for physical and mental fitness of school children
A therapy for physical and mental fitness of school children
 
A theory of efficiency for managing the marketing executives in nigerian banks
A theory of efficiency for managing the marketing executives in nigerian banksA theory of efficiency for managing the marketing executives in nigerian banks
A theory of efficiency for managing the marketing executives in nigerian banks
 
A systematic evaluation of link budget for
A systematic evaluation of link budget forA systematic evaluation of link budget for
A systematic evaluation of link budget for
 
A synthetic review of contraceptive supplies in punjab
A synthetic review of contraceptive supplies in punjabA synthetic review of contraceptive supplies in punjab
A synthetic review of contraceptive supplies in punjab
 
A synthesis of taylor’s and fayol’s management approaches for managing market...
A synthesis of taylor’s and fayol’s management approaches for managing market...A synthesis of taylor’s and fayol’s management approaches for managing market...
A synthesis of taylor’s and fayol’s management approaches for managing market...
 
A survey paper on sequence pattern mining with incremental
A survey paper on sequence pattern mining with incrementalA survey paper on sequence pattern mining with incremental
A survey paper on sequence pattern mining with incremental
 
A survey on live virtual machine migrations and its techniques
A survey on live virtual machine migrations and its techniquesA survey on live virtual machine migrations and its techniques
A survey on live virtual machine migrations and its techniques
 
A survey on data mining and analysis in hadoop and mongo db
A survey on data mining and analysis in hadoop and mongo dbA survey on data mining and analysis in hadoop and mongo db
A survey on data mining and analysis in hadoop and mongo db
 
A survey on challenges to the media cloud
A survey on challenges to the media cloudA survey on challenges to the media cloud
A survey on challenges to the media cloud
 
A survey of provenance leveraged
A survey of provenance leveragedA survey of provenance leveraged
A survey of provenance leveraged
 
A survey of private equity investments in kenya
A survey of private equity investments in kenyaA survey of private equity investments in kenya
A survey of private equity investments in kenya
 
A study to measures the financial health of
A study to measures the financial health ofA study to measures the financial health of
A study to measures the financial health of
 

Kürzlich hochgeladen

Challenges and Opportunities: A Qualitative Study on Tax Compliance in Pakistan
Challenges and Opportunities: A Qualitative Study on Tax Compliance in PakistanChallenges and Opportunities: A Qualitative Study on Tax Compliance in Pakistan
Challenges and Opportunities: A Qualitative Study on Tax Compliance in Pakistan
vineshkumarsajnani12
 
Al Mizhar Dubai Escorts +971561403006 Escorts Service In Al Mizhar
Al Mizhar Dubai Escorts +971561403006 Escorts Service In Al MizharAl Mizhar Dubai Escorts +971561403006 Escorts Service In Al Mizhar
Al Mizhar Dubai Escorts +971561403006 Escorts Service In Al Mizhar
allensay1
 

Kürzlich hochgeladen (20)

Berhampur 70918*19311 CALL GIRLS IN ESCORT SERVICE WE ARE PROVIDING
Berhampur 70918*19311 CALL GIRLS IN ESCORT SERVICE WE ARE PROVIDINGBerhampur 70918*19311 CALL GIRLS IN ESCORT SERVICE WE ARE PROVIDING
Berhampur 70918*19311 CALL GIRLS IN ESCORT SERVICE WE ARE PROVIDING
 
Falcon Invoice Discounting: Empowering Your Business Growth
Falcon Invoice Discounting: Empowering Your Business GrowthFalcon Invoice Discounting: Empowering Your Business Growth
Falcon Invoice Discounting: Empowering Your Business Growth
 
Pre Engineered Building Manufacturers Hyderabad.pptx
Pre Engineered  Building Manufacturers Hyderabad.pptxPre Engineered  Building Manufacturers Hyderabad.pptx
Pre Engineered Building Manufacturers Hyderabad.pptx
 
Challenges and Opportunities: A Qualitative Study on Tax Compliance in Pakistan
Challenges and Opportunities: A Qualitative Study on Tax Compliance in PakistanChallenges and Opportunities: A Qualitative Study on Tax Compliance in Pakistan
Challenges and Opportunities: A Qualitative Study on Tax Compliance in Pakistan
 
Cannabis Legalization World Map: 2024 Updated
Cannabis Legalization World Map: 2024 UpdatedCannabis Legalization World Map: 2024 Updated
Cannabis Legalization World Map: 2024 Updated
 
Katrina Personal Brand Project and portfolio 1
Katrina Personal Brand Project and portfolio 1Katrina Personal Brand Project and portfolio 1
Katrina Personal Brand Project and portfolio 1
 
Arti Languages Pre Seed Teaser Deck 2024.pdf
Arti Languages Pre Seed Teaser Deck 2024.pdfArti Languages Pre Seed Teaser Deck 2024.pdf
Arti Languages Pre Seed Teaser Deck 2024.pdf
 
Al Mizhar Dubai Escorts +971561403006 Escorts Service In Al Mizhar
Al Mizhar Dubai Escorts +971561403006 Escorts Service In Al MizharAl Mizhar Dubai Escorts +971561403006 Escorts Service In Al Mizhar
Al Mizhar Dubai Escorts +971561403006 Escorts Service In Al Mizhar
 
Getting Real with AI - Columbus DAW - May 2024 - Nick Woo from AlignAI
Getting Real with AI - Columbus DAW - May 2024 - Nick Woo from AlignAIGetting Real with AI - Columbus DAW - May 2024 - Nick Woo from AlignAI
Getting Real with AI - Columbus DAW - May 2024 - Nick Woo from AlignAI
 
UAE Bur Dubai Call Girls ☏ 0564401582 Call Girl in Bur Dubai
UAE Bur Dubai Call Girls ☏ 0564401582 Call Girl in Bur DubaiUAE Bur Dubai Call Girls ☏ 0564401582 Call Girl in Bur Dubai
UAE Bur Dubai Call Girls ☏ 0564401582 Call Girl in Bur Dubai
 
Berhampur CALL GIRL❤7091819311❤CALL GIRLS IN ESCORT SERVICE WE ARE PROVIDING
Berhampur CALL GIRL❤7091819311❤CALL GIRLS IN ESCORT SERVICE WE ARE PROVIDINGBerhampur CALL GIRL❤7091819311❤CALL GIRLS IN ESCORT SERVICE WE ARE PROVIDING
Berhampur CALL GIRL❤7091819311❤CALL GIRLS IN ESCORT SERVICE WE ARE PROVIDING
 
Berhampur Call Girl Just Call 8084732287 Top Class Call Girl Service Available
Berhampur Call Girl Just Call 8084732287 Top Class Call Girl Service AvailableBerhampur Call Girl Just Call 8084732287 Top Class Call Girl Service Available
Berhampur Call Girl Just Call 8084732287 Top Class Call Girl Service Available
 
Lucknow Housewife Escorts by Sexy Bhabhi Service 8250092165
Lucknow Housewife Escorts  by Sexy Bhabhi Service 8250092165Lucknow Housewife Escorts  by Sexy Bhabhi Service 8250092165
Lucknow Housewife Escorts by Sexy Bhabhi Service 8250092165
 
Bangalore Call Girl Just Call♥️ 8084732287 ♥️Top Class Call Girl Service Avai...
Bangalore Call Girl Just Call♥️ 8084732287 ♥️Top Class Call Girl Service Avai...Bangalore Call Girl Just Call♥️ 8084732287 ♥️Top Class Call Girl Service Avai...
Bangalore Call Girl Just Call♥️ 8084732287 ♥️Top Class Call Girl Service Avai...
 
WheelTug Short Pitch Deck 2024 | Byond Insights
WheelTug Short Pitch Deck 2024 | Byond InsightsWheelTug Short Pitch Deck 2024 | Byond Insights
WheelTug Short Pitch Deck 2024 | Byond Insights
 
Ooty Call Gril 80022//12248 Only For Sex And High Profile Best Gril Sex Avail...
Ooty Call Gril 80022//12248 Only For Sex And High Profile Best Gril Sex Avail...Ooty Call Gril 80022//12248 Only For Sex And High Profile Best Gril Sex Avail...
Ooty Call Gril 80022//12248 Only For Sex And High Profile Best Gril Sex Avail...
 
Puri CALL GIRL ❤️8084732287❤️ CALL GIRLS IN ESCORT SERVICE WE ARW PROVIDING
Puri CALL GIRL ❤️8084732287❤️ CALL GIRLS IN ESCORT SERVICE WE ARW PROVIDINGPuri CALL GIRL ❤️8084732287❤️ CALL GIRLS IN ESCORT SERVICE WE ARW PROVIDING
Puri CALL GIRL ❤️8084732287❤️ CALL GIRLS IN ESCORT SERVICE WE ARW PROVIDING
 
Marel Q1 2024 Investor Presentation from May 8, 2024
Marel Q1 2024 Investor Presentation from May 8, 2024Marel Q1 2024 Investor Presentation from May 8, 2024
Marel Q1 2024 Investor Presentation from May 8, 2024
 
Unveiling Falcon Invoice Discounting: Leading the Way as India's Premier Bill...
Unveiling Falcon Invoice Discounting: Leading the Way as India's Premier Bill...Unveiling Falcon Invoice Discounting: Leading the Way as India's Premier Bill...
Unveiling Falcon Invoice Discounting: Leading the Way as India's Premier Bill...
 
JAJPUR CALL GIRL ❤ 82729*64427❤ CALL GIRLS IN JAJPUR ESCORTS
JAJPUR CALL GIRL ❤ 82729*64427❤ CALL GIRLS IN JAJPUR  ESCORTSJAJPUR CALL GIRL ❤ 82729*64427❤ CALL GIRLS IN JAJPUR  ESCORTS
JAJPUR CALL GIRL ❤ 82729*64427❤ CALL GIRLS IN JAJPUR ESCORTS
 

11.distribution of risk and return a statistical test of normality on dhaka stock exchange

  • 1. Research Journal of Finance and Accounting www.iiste.org ISSN 2222-1697 (Paper) ISSN 2222-2847 (Online) Vol 3, No 3, 2012 28 Distribution of Risk and Return: A Statistical Test of Normality on Dhaka Stock Exchange Md. Mahbubul Haque Khan1* Umma Rumana Huq2 1. Department of Business Administration, East West University, Dhaka, Bangladesh 2. School of Business & Economics, United International University, Dhaka, Bangladesh * E-mail of the corresponding author: minmhk@gmail.com Abstract The present study deals with the normal distribution of risk and return of the capital market of Bangladesh. Normal distribution of return is an essential assumption in the field of efficient market hypothesis which posits that the returns of a market must follow the random walk behaviour. Again it is an integral part of Capital Asset Pricing Model, which suggests that if an investor wants to get higher return then he must consider higher risk, this denotes to the normal distribution of risk and return. This study has used a set of parametric and non-parametric tools to examine the returns calculated from the three indices of Dhaka Stock Exchange: DGEN (from 2002 to 2010), DSE20 (from 2002 to 2010) and DSI (from 2006 to 2010). As positive skewness and kurtosis are evident in most of the cases, the returns are found to be suffering from some extremities. Daily, weekly and monthly returns are not normally distributed which shows the contra-evidence of random walk behaviour of market return. Besides the inconsistency between risk and return (daily and weekly) is found, which suggests that additional return may be achieved without having exposure to additional risk. Keywords: Dhaka Stock Exchange, Efficient Market Hypothesis, Kurtosis, Non-parametric Test, Normal Distribution, Parametric Test, Risk and Return, Skewness. 1. Introduction Test of normality is an important study in the field of statistical research, as there are so many statistical tests and models which assume the sample data set to be normally distributed. There are some capital market models which also assume that the data set (returns) must be normally distributed e.g., Capital Asset Pricing Model (CAPM). This paper is going to focus on the normality assumption of Efficient Market Hypothesis (EMH), where EMH posits that stock market return must follow random walk behaviour, which denotes to the normal distribution of risk and return. Basically Efficient Market Hypothesis tells us that the security prices fully reflect all available information (Fama, 1970). For this reason a person having a piece of information cannot expect to predict the future price and have some abnormal gain on that information if the market is held to be efficient. So, the future price must be always random and unpredictable. A person can only earn higher return by bearing higher risk. Hence the efficient market hypothesis can play an important role in investment strategy formulation. In an inefficient market as the return distribution is somewhat skewed, there, the probability for a particular return can be assumed. The technicians by using their technical trading rules can earn riskless profit in this circumstance. Investors can also be able to find out the implication of time horizon in their investment strategy to earn abnormal return. But in an efficient market condition, an investor has to bear an additional amount of risk for an additional amount of return. Basically here return is considered as a compensation for risk. The capital market of Bangladesh is an emerging market in South Asia. Day by day capital market is becoming an integral part of the economy of Bangladesh. Studies performed on market efficiency of the capital market of Bangladesh are not so many. And most of the articles present that the market is still not found weak form efficient (Mollah et al., 2005; Rahman and Hossain, 2006; Mobarek et al., 2008; Mollik and Bepari, 2009; and Nisar and Hanif, 2011). Besides some calendar anomalies like ‘Saturday Effect’, ‘April Effect’ and seasonality in monthly return
  • 2. Research Journal of Finance and Accounting www.iiste.org ISSN 2222-1697 (Paper) ISSN 2222-2847 (Online) Vol 3, No 3, 2012 29 series (Hossain, 2004; and Bepari and Mollik, 2009) are also evident in the capital market of Bangladesh. As the evidence suggests that the market is not efficient in Bangladesh, the risk and return distribution will not be normal. So basically this paper is going to examine whether and to what extent the risk and returns are normally distributed in the capital market of Bangladesh within the sample time period. Again this paper can also be able to validate some of the previous findings from the literature. 2. Literature Review Testing normality and market efficiency of capital markets has been a prime area of interest for researchers for a long time. In this part we are going to present some findings from the literature of both national (Bangladesh) and international (rest of the world) context. And at the end we will try to show the gap in the literature and the justification for the present study. Aggarwal and Rivoli (1989) examined the efficiency in functioning of four large capital markets of Asia by studying to find out seasonal and daily patterns in stock returns of these markets. With twelve years data (September 1976-June 1988), the study concluded on the existence of such seasonal patterns in those markets. The study found out the existence of ‘January effect’ in markets of Hong Kong, Singapore and Malaysia. In addition to that, ‘day-of-the-week effect’ was also present in those markets in the form of low Monday returns and strong ‘Tuesday effect’. Aparacio and Estrada (1997) strongly rejected the notion of normality in daily stock returns in their study on thirteen European securities market. The study used data of period 1990-1995. By using time series of daily stock returns, they argued that normality can be assumed for monthly returns but not for daily returns. Galai and Kedar-Levy (2002), in their working paper series, found the existence of day-of-the-effect on their study on Tel-Aviv stock exchange. They applied non- parametric tests and multiple comparison procedures on a data set of the period 1988-1998. The findings revealed that the first and last trading days’ returns were closely related than to any other day of the week. Aly, Mehdian and Perry (2004) analyzed Day-of-the-week effect on Egyptian stock market with a four-day trading week. The study reported that returns do not vary among days in week indicating the absence of any such patterns. They also concluded on the weak form efficiency on Egyptian capital market. Naqvi (2004) tested the random-walk behavior of Karachi Stock Exchange in his study using KSE-100 index. The research employed normality test, autocorrelation using Q-statistic and Dickey-Fuller test on the data set of the period 1994-2004. The Karachi Stock Exchange was found to be weak form efficient in both weekly and monthly return series. Agrawal (2005) tested how the sample size can have an impact on the normality assumption of stock returns and came up with the conclusion that it really had. According to his research carried out on the stock returns of Nifty and Sensex, daily stock returns with large sample size were not normally distributed while monthly stock returns with small sample size were normally distributed. Onder and Zaman (2005) examined how the test statistics for the normality test of errors can have a different result if the regression residuals from robust regression are used in place of OLS residuals. They actually found out that such use leads to significantly superior ability in detecting lack of normality in suitable situations. O. (2008) attempted to test normality and market efficiency on Nigerian Stock Exchange. He examined that though in recent years Nigerian stock exchange has been growing rapidly in terms of volume trading and market capitalization; the market was not weak form efficient the stock returns were not normally distributed. The study was conducted using monthly all share index from January 1993 to December 2007 and the methods used for the analysis included Skewness, Kurtosis, Jarque-Bera, Runs test etc. He added to recommend reducing transaction costs and minimizing institutional restrictions on trading to improve market activities. Das and Bhattacharjee (2009) attempted to build up a graphical tool to check and visualize the normality of a dataset using empirical distribution function and K-S test statistic. Jeyanthi (2010) tested the weak-form efficiency of Asian emerging stock markets. The study used daily price indices of China, Indonesia, Kuala Lumpur, Korea, Taiwan and India for the period of April 1998 to March 2009. The study showed varying results as the K-S test, runs test, autocorrelation test and LB test proved that these markets were not weak-form efficient but on the other hand unit root test significantly proved the existence of weak-form efficiency among the markets. Kumar and Dhankar (2011) applied a set of parametric and non-parametric tests on Indian Stock Market to find out whether the risk and return of that market are distributed normally. They examined three listed indices of Bombay Stock Exchange for the period 1996 to 2006 and found the evidence of non-normality in case of daily and weekly returns but
  • 3. Research Journal of Finance and Accounting www.iiste.org ISSN 2222-1697 (Paper) ISSN 2222-2847 (Online) Vol 3, No 3, 2012 30 normality in case of monthly and annual returns. Besides their study pointed out negative skewness in returns and emphasized on time horizon in investment strategy. Such research on testing of normality and market efficiency has also been practiced on the stock market of Bangladesh namely Dhaka Stock Exchange (DSE). Hossain (2004) studied on the small banking portfolios in Bangladesh to find out any existence of days-of-the-week effect. The study revealed the existence of ‘Saturday Effect’ as Saturday was the then first trading day following the weekend. The study also identified the existence of ‘beginning of the week effect’ while buying and ‘weekend effect’ while selling securities. Rahman, Salat and Bhuiyan (2004) proved in their study that Dhaka Stock Exchange is weak- form efficient. They used monthly index of DSE for the period of 1990-2003 to apply unit root test and came up to support the null hypothesis of random walk model. Mollah, Rahman and Islam (2005) analyzed the behavior of daily DSE 20 index and prices of the securities. The ARMA, ARIMA, ACF, PACF and Dimson’s Market Model identified that the return series was a stationary time series and the market was not weak-form efficient. Islam and Khaled (2005) applied heteroscedasticity-adjusted methods to test for weak- form efficiency of Dhaka Stock Exchange as historic study results gave conflicting evidences on weak form efficiency. They found that if the heteroscedasticity-robust test is used instead of an autocorrelation test then the result can be transformed from weak form inefficiency to weak form efficiency. Rahman and Hossain (2006) carried out a study to find whether Dhaka Stock Exchange is weak-form efficient assuming the data set is normally distributed. They applied both parametric and non-parametric tests on two renowned indices of the market from 1994-2005. The study concluded on the ground that the daily return series was not normally distributed and the market was not weak-form efficient. Mobarek et al. (2008) sought to find evidence on the randomness and independence of the return series of Dhaka Stock Exchange. Various statistical models like K-S test, Runs test, Auto-Correlation test, ARIMA model etc were run on the daily price index from 1988 to 2000. The study found that security returns did not follow the random walk model. The existence of significant auto-correlation coefficient at different time lags proved the market to be weak-form inefficient. She also added that such inefficiency might be due to delay in dissemination of price-sensitive information or biases in the responses of market participants. Bepari and Mollik (2009) investigated the presence of seasonality in monthly return series of DSE All Share Price Index for the period from 1993 to 2006. Their research confirmed the existence of monthly effect in the form of ‘April effect’ instead of ‘January effect’. They also added to confirm that the market was not weak- form efficient meaning investors could earn above average income. Rahman, Ara and Zheng Sr. (2009) used a variety of volatility models such as GARCH model, Random walk model and Autoregressive model to test the volatility of Dhaka Stock Exchange returns from 1999 to 2004. The study found the market return to be more volatile after 27 November, 2001. Mollik and Bepari (2009) examined the weak-form efficiency of Dhaka Stock exchange by adjusting for the thin trading problem. The data set covered DSE General Index and DSE 20 index for the period of 2002-2007. The study found that the returns are not normally distributed and the market failed to be weak-form efficient. Nisar and Hanif (2011) tested the weak-form efficiency on four emerging stock markets in Asia including Bangladesh. According to their Runs test, Durbin-Watson test and Unit Root test which they applied on the monthly, weekly and daily return series of the markets from 1997 to 2011, none of the markets showed to be weak form efficient. Mollik and Bepari (2011) attempted to measure the risk-return relationship in Dhaka Stock exchange. Their study found pretty straight, anticipated positive relationship between risk and return for both single security and portfolio. Still the less significant positive risk-return relationship for high risk portfolios might suggest existence of mispricing or market anomalies. From the literature it is quite apparent that on the capital market of Bangladesh there is a lack of study particularly on risk and return distribution or normality test, though we know that this is a pre-requisite for so many statistical and financial models. Some researchers have also worked on normality test as a part of their research. Again for testing the normality of return basically researchers have commonly chosen Kolmogorov Smirnov test as a non-parametric test (Rahman and Hossain, 2006; Mobarek et al., 2008; and Kumar and Dhankar, 2011). But Razali and Wah (2011) compared among the Shapiro-Wilk test, Kolmogorov-Smirnov test, Lilliefors and Anderson-Darling test and found that irrespective of the distribution of observations Shapiro Wilk test is the most powerful test and Kolmogorov Smirnov is the
  • 4. Research Journal of Finance and Accounting www.iiste.org ISSN 2222-1697 (Paper) ISSN 2222-2847 (Online) Vol 3, No 3, 2012 31 least powerful test, besides Lilliefors test always outperforms the Kolmogorov Smirnov test. So the present study has incorporated Kolmogorov-Smirnov test with Lilliefors correction and Shapiro Wilk test for conducting the research. We have also found that Kumar and Dhankar (2011) have used F-test or Analysis of Variance test to find out the distribution of risk. But F-test assumes the sample observations to be normally distributed, so in this research we have used Kruskal-Wallis test (a non-parametric test which can be compared with one way ANOVA test) along with F-test. Moreover the present study has completely concentrated on test of normality of risk and return of the capital market of Bangladesh. 3. Methodology and Data Sources Returns calculated from the capital market indices are widely used as the proxies for the market return. Dhaka Stock Exchange (DSE) has three indices to represent the capital market of Bangladesh. In this study we have used the three indices of DSE to calculate the market return on a daily, weekly, monthly and annual basis. DSE General Index (DGEN) consists of A, B, G and N categories of listed shares of Dhaka Stock Exchange. In our study we have considered DGEN from January 2002 to December 2010. DSE20 Index consists of 20 blue chip shares listed in DSE. The sample period for DSE20 is January 2002- December 2010. DSE All Share Price Index (DSI) includes all the shares listed in DSE. The authority of DSE stopped calculating this index from 08 December 2003. The authority reintroduced this index on 28 March 2005. So there was a discontinuity in DSI index and finally here we have considered DSI from January 2006-December 2010 as the sample period. Besides, we have also considered three sub-periods (2002-2004, 2005-2007, and 2008-2010) of DGEN and DSE20 to find out whether the samples have emerged from the same population. During the whole period 2002-2010 we see (Graph 1) the capital market of Bangladesh had an increasing trend. From 2002 to 2004 the market was quite flat and during 2005-2007 the market experienced some fluctuations. But during the period 2008 to 2010 the market really observed a tremendous growth. Basically that time the market was highly influenced by the IPO of Grameen Phone Ltd. (the largest mobile phone operator of Bangladesh). Daily market return jumped at 20.38% on 16 November 2009 after the debut of Grameen Phone share on Dhaka Stock Exchange, which also pulled the market index to a record high. The Financial Express, a popular financial newspaper of Bangladesh reported on 17 November 2009 in the following way: ‘Shares of Grameen Phone (GP) climbed 2.5 times higher than its face value at the Dhaka Stock Exchange (DSE) Monday after the country's largest mobile phone operator made debut, sending the indices to a record high’. In this study we have used natural logarithmic return for the ease and simplicity of use and calculated in the following way: Return on index at time period t = ln ( It / It-1 ), where It is the index price at time period t and It-1 is the price of index at time period previous t. We have considered only the changes in stock price and overlooked any dividend payment. We have used several parametric and non-parametric tests to determine whether the risk and return calculated from our samples are normally distributed. We have used Kolmogorov Smirnov (K-S test with Lilliefors Significance Correction) test and Shapiro Wilk test to find out whether the returns calculated from our sample data fit normal distribution. The significance of the test statistic will reject the assumption of normality in respective sample data (Pallant, 2005). One way ANOVA (Analysis of Variance or F-test) and Kruskal-Wallis (K-W) tests are applied on returns calculated from the three sub-periods’ sample data to find out whether these have emerged from the same population. If these are found not to be emerged from the same population then we have concluded that risk is not normally distributed (Kumar and Dhankar, 2011). All the tests are assumed at 5% level of significance. 4. Major Findings 4.1 Risk and Return Distribution of Daily Return (2002-2010) In this part basically we have three statistical tables presenting the facts related to normality of daily return of Dhaka Stock Exchange. If we have a look on Table 1 then we find that the index DGEN has a positive skewness whereas DSE20 index is negatively skewed. Kurtosis for both the indices is greater than zero. So
  • 5. Research Journal of Finance and Accounting www.iiste.org ISSN 2222-1697 (Paper) ISSN 2222-2847 (Online) Vol 3, No 3, 2012 32 from the perspective of skewness and kurtosis we find a violation of normality. Again test statistics for K-S and Shapiro Wilk tests are significant which means the return distribution is not normal for the daily return within the sample period. This finding is also consistent with other findings where the day of the week effect on this market is evident. From Table 2 we get the statistical summary of daily returns from 2002 to 2010 for three non-overlapping sub-periods- 2002-2004, 2005-2007 and 2008-2010. DGEN exhibits negative skewness in 2005-2007 period and positive skewness for the other two periods. Daily return from DSE20 index is negatively skewed for all the periods. Kurtosis is higher than zero for all the sub-periods, which is a symptom of non- normality. If there is higher kurtosis than normal, then more of the variability can be explained by the fewer observations’ extreme differences from the mean. And we observe kurtosis for DGEN in 2008-2010 is abnormally high. The same is not observed in DSE20. So, the returns of the securities beyond DSE20 are held liable for this abnormality. Information from the market suggests, this has happened for the IPO of Grameen Phone Ltd. (the largest mobile phone operator in Bangladesh) within that sub-period. For both DGEN and DSE20 indices K-S and Shapiro Wilk test statistics are significant. So these show non- normality in daily return of each sub-period. As we see that the Levene Statisitc in Table 3 is significant for both the indices, F-value will not be able to provide a correct decision about the sample. So we need to rely on Welch and Brown-Forsythe test statistic for the decision. And we find both the tests indicate that the three samples have emerged from the same population, hence the risk for the three sub-periods will not significantly differ from each other. By being not significant at 5% level of significance, Kruskal-Wallis (K-W in Table 2) test statistic supports the same finding. 4.2 Risk and Return Distribution of Weekly Return (2002-2010) This part deals with the risk and return distribution of weekly return of Dhaka Stock Exchange. Table 4 shows some statistics of weekly return of DGEN and DSE20 during the period 2002-2010. DGEN shows higher weekly return than that of DSE20. Skewness and kurtosis are positive for both the indices, this denotes to non-normality. Kurtosis in weekly return has been reduced than that we observed in daily return (40.512). So it is quite apparent that due to any abnormally high daily return that situation emerged. But still K-S and Shapiro Wilk tests results are significant which tells us that weekly returns are not normally distributed. From Table 5 we see that the K-S and Shapiro Wilk tests are not significant for DGEN in the sub-period 2005-2007 and for DSE20 in the sub-period 2008-2010, which denotes to normal distribution of return during the respective sub-period for the relevant index. As the Levene Statistic (Table 6) is not significant at 5% level, we can rely on the F-value. F-statistic and K-W value suggest that risk is normally distributed for both the indices during the sample period. 4.3 Risk and Return Distribution of Monthly Return (2002-2010) Table 7 indicates the statistical summary of Monthly Return for the sample period 2002-2010 for DGEN and DSE20. Here the K-S and Shapiro Wilk Statistics are not significant for both of the indices. This signals that the monthly returns are not normally distributed. But if we look at the sub-periods then we find except for DSE20 in 2002-2004 sub-period, all the sub-periods of both the indices are normally distributed. From the F-value and K-W statistic (Table 8) we find the sub-periods for both the indices have emerged from the same population, because we see the test results are not significant at 5% level of significance, which also tells about the normal distribution of risk during the sample period. We can rely on the F-value as Levene test statistic from Table 9 is not significant. 4.4 Risk and Return Distribution of Annual Return (2002-2010) Table 10 presents the statistical summary of the annual returns of two indices for the sample period (2002- 2010). DGEN index provides higher average return than the DSE20 index, though DGEN has a lower standard deviation. As the K-S and Shapiro Wilk test results are not significant at 5% level of significance, we can assume the annual returns of the capital market are normally distributed. But still as the number of observations is too low, we should not rely on these statistics.
  • 6. Research Journal of Finance and Accounting www.iiste.org ISSN 2222-1697 (Paper) ISSN 2222-2847 (Online) Vol 3, No 3, 2012 33 4.5 Risk and Return Distribution of DSI (2006-2010) Earlier in methodology part we mentioned that due to unavailability of data we could not include another stock market index DSI (All Share Price Index) of Dhaka Stock Exchange in our previous analysis. But in this part we are presenting it separately for the time period of 2006-2010. Table 11 presents that the skewness of daily and weekly returns are positive but monthly return is negative. Kurtosis of daily return is abnormally high which also supports the findings from daily return of DGEN for the period of 2008-2010. Shapiro Wilk test statistics are significant for all the daily, weekly and monthly returns. So returns are not normally distributed. 5. Conclusion This study has been conducted to examine the risk and return distribution of the stock market of Bangladesh. This paper has come up with some important points to be noted. In most of the cases returns are found to be positively skewed, which denotes that most of the returns are concentrated on the left side of the mean with some extreme values to the right. We have also noticed on 16 November 2009 market return was 20.38% which is really abnormally high, and it happened due to the debut of Grameen Phone Ltd. shares to the market. The standard deviation overestimates the downside risk and shows a biased result due to this positive skewness. We have found kurtosis is too high for the indices DGEN and DSI which again tells us that more of the variability resulted from the extreme deviations of fewer observations from the mean. From the indices DGEN and DSI it has become evident that the daily, weekly and monthly returns are not normally distributed, which denies the random walk behaviour of stock price. This complies with the previous findings of some researchers who have found calendar anomalies like ‘Saturday Effect’, ‘April Effect’ and seasonality in monthly return series (Hossain, 2004; and Bepari and Mollik, 2009). Again we have observed risks have been distributed normally in all the cases but daily and weekly returns have not been normally distributed, so here we find an asymmetry between risk and return relationship. So investors may have the chance to earn abnormal return i.e., return without bearing sufficient risk. Hence the market is not efficient which also supports some past studies (Mollah et al., 2005; Rahman and Hossain, 2006; Mobarek et al., 2008; Mollik and Bepari, 2009; and Nisar and Hanif, 2011). References Aggarwal, Reena, & Rivoli, Pietra. (1989). Seasonal and Day-of-the-Week Effects in Four Emerging Stock Markets. The Financial Review, 24(4), 541-550. Agrawal, Gaurav. (2005). Impact of Sample Size on the Distribution of Stock Returns- An Investigation of Nifty & Sensex. Paper Presented at 9th Capital Markets Conference of Indian Institute of Capital Markets. Aly, Hassan, Mehdian, Seyed, & Perry, Mark J. (2004). An Analysis of Day-of-theWeek Effects in the Egyptian Stock Market. International Journal of Business, 9(3), 301-308. Aparicio, Felipe Miguel, & Estrada, Javier. (1997, April). Empirical Distribution of Stock Returns: European Securities Market, 1990-95. (Working Paper 97-23). Madrid, Spain: Departmento de Economia de la Empresa. Available at SSRN: http://ssrn.com/abstract=40558. Bepari, Khokan, & Mollik, Abu Taher. (2009). Seasonalities in the Monthly Stock Returns: Evidence from Bangladesh Dhaka Stock Exchange (DSE). International Research Journal of Finance and Economics, 24, 167-176. Das, Kishore K., & Bhattacharjee, Dibyojyoti. (2009). On Using Empirical Distribution Function Plot for Checking the Normality Assumption of a Data Set. Assam Statistical Review, 22(1), 50-58. Debutant GP pulls DGEN to all-time high level. (2009, November 17). The Financial Express, Bangladesh. Fama, Eugene F. (1970). Efficient Capital Markets: A Review of Theory and Empirical Work. Journal of Finance, 25(2), 383-417.
  • 7. Research Journal of Finance and Accounting www.iiste.org ISSN 2222-1697 (Paper) ISSN 2222-2847 (Online) Vol 3, No 3, 2012 34 Galai, Dan, & Kedar-Levy, Haim. (2002, February). Multiple Comparisons of Return Distributions of Return Distributions: A New Look at the Day-of-the-Week Effect. Available at SSRN: http://ssrn.com/abstract=302959. Hossain, Farhad. (2004). Days of the Week Effect in Dhaka Stock Exchange: Evidence from Small Portfolios of Banking Sector. Jahangirnagar Review, Part II: Social Science, XXVIII, 73-82. Islam, Ainul, & Khaled, Mohammed. (2005). Tests of Weak-Form Efficiency of the Dhaka Stock Exchange. Journal of Business Finance & Accounnting, 32(7-8), 1613-1624. Jeyanthi, B. J. Queensly. (2010). Weak-Form Market Efficiency in India and Its Emerging Asian Counterparts. IUP Journal of Public Finance, 8(4), 58-70. Kumar, Rakesh, & Dhankar, Raj S. (2011). Distribution of Risk and Return: A Test of Normality in Indian Stock Market. South Asian Journal of Management, 18(1), 109-118. Mobarek, Asma, Mollah, A. Sabur, & Bhuyan, Rafiqul. (2008). Market Efficiency in Emerging Stock Market: Evidence from Bangladesh. Journal of Emerging Market Finance, 7(1), 17-41. Mollah, A. Sabur, Rahman, Muhammad Zahedur, & Islam, Mohammad Saiful. (2005). Return Behavior of the DSE-20: An Empirical Investigation on the Dhaka Stock Exchange. Journal of Business Studies, 26(2), 151-162. Mollik, Abu Taher, & Bepari, M Khokan. (2009, August 24). Weak-Form Market Efficiency of Dhaka Stock Exchange (DSE), Bangladesh. Paper presented at the 22nd Australasian Finance and Banking Conference 2009. Mollik, Abu Taher., & Bepari, Khokon. (2011, August). Risk-Return Trade-Off in Dhaka Stock Exchange, Bangladesh: An Emerging Market Evidence. Available at SSRN: http://ssrn.com/abstract=1917337. Naqvi, Syed Ali Abbas. (2004, September). Does KSE-100 Index Follows a Random Walk: An Empirical Study. BIMCS Department of Management Sciences Working Paper. Available at SSRN: http://ssrn.com/abstract=693261. Nisar, Saqib, & Hanif, Muhammad. (2011, November). Testing Weak Form of Efficient Market Hypothesis: Empirical Evidence from South Asia. World Applied Science Journal, Forthcoming. Available at SSRN: http://ssrn.com/abstract=1962210. O., Emenike Kalu. (2008, October). Empirical Test for Weak Form Efficient Market Hypothesis of the Nigerian Stock Exchange. Working Paper Series. Available at SSRN: http://ssrn.com/abstract=1291273. Onder, A. Ozlem, & Zaman, Asad. (2005). Robust Tests for Normality of Errors in Regression Models. Economics Letters, 86, 63-68. Pallant, Julie. (2005). Descriptive Statistics. In SPSS Survival Manual: A Step by Step Guide to Data Analysis Using SPSS (2nd ed., pp. 53-58). Australia: Ligare, Sydney. Rahman, Mohammad Masudur, Ara, Laila Arjuman, & Zheng Sr., Zhenlong. (2009, April). Jump, Non- Normal Error Distribution and Stock Price Volatility- A Non-paramedic Specification Test. The Singapore Economic Review, Available at SSRN: http://ssrn.com/abstract=1500988. Rahman, Muhammad Zahedur, Salat, Amirus, & Bhuiyan, Mohammad Mominul Hoque. (2004). Testing Weak-Form Efficiency of the Dhaka Stock Exchange. Journal of Business Studies, 25(2), 175-188. Rahman, Shofiqur, & Hossain, Farhad. (2006). Weak-Form Efficiency: Testimony of Dhaka Stock exchange. Journal of Business Research, 8, 1-12. Razali, Nornadiah Mohd, & Wah, Yap Bee. (2011). Power Comparisons of Shapiro-Wilk, Kolmogorov- Smirnov, Lilliefors and Anderson-Darling Tests. Journal of Statistical Modeling and Analysis, 2(1), 21-33.
  • 8. Research Journal of Finance and Accounting www.iiste.org ISSN 2222-1697 (Paper) ISSN 2222-2847 (Online) Vol 3, No 3, 2012 35 Table 1. Daily Return (2002-2010) Daily Return (2002-2010) Index Mean Return % Standard Deviation % Skewness Kurtosis K-Sa Shapiro Wilk DGEN .10035 1.1815 2.043 40.512 .072* .878* DSE20 .06906 1.1495 -0.144 4.934 .068* .945* Note: a Lilliefors Significance Correction * Significant at 5% level of significance; ** Not significant at 5% level of significance Table 2. Statistical Summary (Daily Return) Statistical Summary (Daily Return) Index Period Mean Return % Standard Deviation % Skewness Kurtosis K-Sa Shapiro Wilk F K-W DGEN 2002- 2004 .1023 .83732 0.042 3.895 .068* .950* .843** 2.73** 2005- 2007 .0589 1.2515 -0.193 4.081 .055* .960* 2008- 2010 .1394 1.4255 3.784 56.631 .087* .801* DSE20 2002- 2004 .0833 .89790 -0.108 5.957 .077* .926* 1.03** 3.44** 2005- 2007 .0195 1.2754 -0.211 4.394 .065* .951* 2008- 2010 .1019 1.2703 -0.061 3.754 .053* .963* Note: a Lilliefors Significance Correction * Significant at 5% level of significance; ** Not significant at 5% level of significance Table 3. Testing the Validity of ANOVA (Daily Return) Testing the Validity of ANOVA (Daily Return) Index Test of Homogeneity of Variances Robust Tests of Equality of Means Levene Statistic Welch Brown-Forsythe DGEN 37.755* .669** .811** DSE20 35.095* .879** 1.001** Note: * Significant at 5% level of significance; ** Not significant at 5% level of significance Table 4. Weekly Return (2002-2010) Weekly Return (2002-2010) Index Mean Return % Standard Deviation % Skewness Kurtosis K-Sa Shapiro Wilk DGEN .48880 2.6132 1.052 7.323 .062* .941* DSE20 .33671 2.7103 0.482 1.660 .057* .975* Note: a Lilliefors Significance Correction * Significant at 5% level of significance; ** Not significant at 5% level of significance
  • 9. Research Journal of Finance and Accounting www.iiste.org ISSN 2222-1697 (Paper) ISSN 2222-2847 (Online) Vol 3, No 3, 2012 36 Table 5. Statistical Summary (Weekly Return) Statistical Summary (Weekly Return) Index Period Mean Return % Standard Deviation % Skewness Kurtosis K-Sa Shapiro Wilk F K-W DGEN 2002- 2004 .54876 2.2959 0.618 2.424 .109* .940* .874** 1.07** 2005- 2007 .27000 2.5724 -0.101 1.163 .062** .985** 2008- 2010 .64662 2.9323 1.998 11.958 .088* .883* DSE20 2002- 2004 .44811 2.5676 0.828 2.038 .092* .959* 1.032** 3.07** 2005- 2007 .08267 2.7801 0.419 2.610 .077* .956* 2008- 2010 .47845 2.7768 0.306 0.563 .069** .985** Note: a Lilliefors Significance Correction * Significant at 5% level of significance; ** Not significant at 5% level of significance Table 6. Testing the Validity of ANOVA (Weekly Return) Testing the Validity of ANOVA (Weekly Return) Index Test of Homogeneity of Variances Robust Tests of Equality of Means Levene Statistic Welch Brown-Forsythe DGEN 2.348** 0.841** 0.874** DSE20 0.685** 0.999** 1.032** Note: * Significant at 5% level of significance; ** Not significant at 5% level of significance Table 7. Monthly Return (2002-2010) Monthly Return (2002-2010) Index Mean Return % Standard Deviation % Skewness Kurtosis K-Sa Shapiro Wilk DGEN 2.2467 6.9290 0.182 1.743 .090* .974* DSE20 1.5971 7.1425 0.459 1.254 .107* .972* Note: a Lilliefors Significance Correction * Significant at 5% level of significance; ** Not significant at 5% level of significance
  • 10. Research Journal of Finance and Accounting www.iiste.org ISSN 2222-1697 (Paper) ISSN 2222-2847 (Online) Vol 3, No 3, 2012 37 Table 8. Statistical Summary (Monthly Return) Statistical Summary (Monthly Return) Index Period Mean Return % Standard Deviation % Skewness Kurtosis K-Sa Shapiro Wilk F K-W DGEN 2002- 2004 2.7645 5.5627 0.621 -0.044 .145** .958** .636** .88** 2005- 2007 1.1823 7.5129 -0.594 1.664 .140** .949** 2008- 2010 2.8077 7.5594 0.878 1.639 .116** .951** DSE20 2002- 2004 2.3679 6.1694 0.977 0.604 .174* .923* .786** 1.74** 2005- 2007 0.3920 7.9709 0.558 2.637 .146** .944** 2008- 2010 2.0528 7.1899 0.271 -0.010 .094** .987** Note: a Lilliefors Significance Correction * Significant at 5% level of significance; ** Not significant at 5% level of significance Table 9. Testing the Validity of ANOVA (Monthly Return) Testing the Validity of ANOVA (Monthly Return) Index Test of Homogeneity of Variances Robust Tests of Equality of Means Levene Statistic Welch Brown-Forsythe DGEN 0.618** 0.592** 0.639** DSE20 0.333** 0.723** 0.457** Note: * Significant at 5% level of significance; ** Not significant at 5% level of significance Table 10. Annual Return (2002-2010) Annual Return (2002-2010) Index Mean Return % Standard Deviation % Skewness Kurtosis K-Sa Shapiro Wilk DGEN 25.5111 34.7213 0.195 -2.110 .198** .867** DSE20 17.5554 35.0942 0.374 -1.411 .199** .912** Note: a Lilliefors Significance Correction * Significant at 5% level of significance; ** Not significant at 5% level of significance Table 11. DSI Return (2006-2010) DSI Return (2006-2010) Index Mean Return % Standard Deviation % Skewness Kurtosis K-Sa Shapiro Wilk Daily .14180 1.3102 2.506 38.414 .061* .875* Weekly .64306 2.7045 1.411 7.857 .053** .928* Monthly 2.0721 7.7413 -0.275 2.013 .094* .959* Note: a Lilliefors Significance Correction * Significant at 5% level of significance; ** Not significant at 5% level of significance
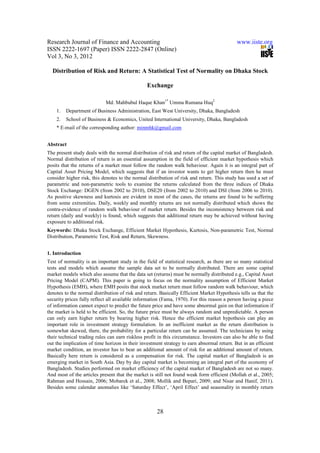
  • 11. Research Journal of Finance and Accounting www.iiste.org ISSN 2222-1697 (Paper) ISSN 2222-2847 (Online) Vol 3, No 3, 2012 38 Graph 1. DSE General Index (DGEN from January 2002-December 2010)
  • 12. International Journals Call for Paper The IISTE, a U.S. publisher, is currently hosting the academic journals listed below. The peer review process of the following journals usually takes LESS THAN 14 business days and IISTE usually publishes a qualified article within 30 days. Authors should send their full paper to the following email address. More information can be found in the IISTE website : www.iiste.org Business, Economics, Finance and Management PAPER SUBMISSION EMAIL European Journal of Business and Management EJBM@iiste.org Research Journal of Finance and Accounting RJFA@iiste.org Journal of Economics and Sustainable Development JESD@iiste.org Information and Knowledge Management IKM@iiste.org Developing Country Studies DCS@iiste.org Industrial Engineering Letters IEL@iiste.org Physical Sciences, Mathematics and Chemistry PAPER SUBMISSION EMAIL Journal of Natural Sciences Research JNSR@iiste.org Chemistry and Materials Research CMR@iiste.org Mathematical Theory and Modeling MTM@iiste.org Advances in Physics Theories and Applications APTA@iiste.org Chemical and Process Engineering Research CPER@iiste.org Engineering, Technology and Systems PAPER SUBMISSION EMAIL Computer Engineering and Intelligent Systems CEIS@iiste.org Innovative Systems Design and Engineering ISDE@iiste.org Journal of Energy Technologies and Policy JETP@iiste.org Information and Knowledge Management IKM@iiste.org Control Theory and Informatics CTI@iiste.org Journal of Information Engineering and Applications JIEA@iiste.org Industrial Engineering Letters IEL@iiste.org Network and Complex Systems NCS@iiste.org Environment, Civil, Materials Sciences PAPER SUBMISSION EMAIL Journal of Environment and Earth Science JEES@iiste.org Civil and Environmental Research CER@iiste.org Journal of Natural Sciences Research JNSR@iiste.org Civil and Environmental Research CER@iiste.org Life Science, Food and Medical Sciences PAPER SUBMISSION EMAIL Journal of Natural Sciences Research JNSR@iiste.org Journal of Biology, Agriculture and Healthcare JBAH@iiste.org Food Science and Quality Management FSQM@iiste.org Chemistry and Materials Research CMR@iiste.org Education, and other Social Sciences PAPER SUBMISSION EMAIL Journal of Education and Practice JEP@iiste.org Journal of Law, Policy and Globalization JLPG@iiste.org New Media and Mass Communication NMMC@iiste.org Journal of Energy Technologies and Policy JETP@iiste.org Historical Research Letter HRL@iiste.org Public Policy and Administration Research PPAR@iiste.org International Affairs and Global Strategy IAGS@iiste.org Research on Humanities and Social Sciences RHSS@iiste.org Developing Country Studies DCS@iiste.org Arts and Design Studies ADS@iiste.org Global knowledge sharing: EBSCO, Index Copernicus, Ulrich's Periodicals Directory, JournalTOCS, PKP Open Archives Harvester, Bielefeld Academic Search Engine, Elektronische Zeitschriftenbibliothek EZB, Open J-Gate, OCLC WorldCat, Universe Digtial Library , NewJour, Google Scholar. IISTE is member of CrossRef. All journals have high IC Impact Factor Values (ICV).