Perceived and actual rainfall trends and variability in eastern uganda implications for community preparedness and response
•
1 gefällt mir•513 views

International peer-reviewed academic journals call for papers, http://www.iiste.org/Journals

Empfohlen
Empfohlen
Weitere ähnliche Inhalte
Was ist angesagt?
Was ist angesagt? (20)
Andere mochten auch
Andere mochten auch (9)
Ähnlich wie Perceived and actual rainfall trends and variability in eastern uganda implications for community preparedness and response
Ähnlich wie Perceived and actual rainfall trends and variability in eastern uganda implications for community preparedness and response (20)
Mehr von Alexander Decker
Mehr von Alexander Decker (20)
Kürzlich hochgeladen
Kürzlich hochgeladen (20)
Perceived and actual rainfall trends and variability in eastern uganda implications for community preparedness and response
- 1. Journal of Natural Sciences Research www.iiste.org ISSN 2224-3186 (Paper) ISSN 2225-0921 (Online) Vol.3, No.8, 2013 179 Perceived and Actual Rainfall Trends and Variability in Eastern Uganda: Implications for Community Preparedness and Response Monica K. Kansiime1* , Stephen K. Wambugu1 and Chris A. Shisanya2 1 School of Agriculture and Enterprise Development, Department of Agribusiness Management and Trade, Kenyatta University, P.O Box 43844 - 00100, Nairobi, Kenya 2 School of Humanities and Social Sciences, Department of Geography, Kenyatta University, P. O. Box 43844- 00100, Nairobi, Kenya *Email of the corresponding author: monkansiime@yahoo.co.uk Abstract This study assessed the extent of rainfall trends and variability in Eastern Uganda and implications for community preparedness and response. Regional and national climate studies have been generalized over large scales and thus are insufficient in capturing variability at local level where management actions occur. This study used both observational rainfall data for the period 1971 to 2010 and primary data on communities’ perceptions of changes in rainfall. The study was conducted in three distinct agro-ecologies covering highland, low land and floodplains. Trends analysis was done using Regression method, while Coefficient of Variation and ANOVA techniques were used to analyze variability. Rainfall satisfaction index was used to assess farmers’ perceptions. The results show statistically significant increasing trends (P ≤ 0.05) in annual and seasonal rainfall for highland areas, and negative, but non-significant trends for low lying areas. Analysis of Variance shows significant within and between season variations for L. Victoria and less significant variations for Mt. Elgon and SE L. Kyoga agro-ecologies. However, Mt. Elgon exhibits a very high coefficient of variation for ASON (CV > 30%), indicating high rainfall variability. Over 90% of the interviewed farming communities perceived change in rainfall pattern, dating as far back as 10 to 15 years. The rainfall subjective index of 0.19 was obtained, which indicates that the rainfall situation for the base year of this study was undesirable. Adaptation to the observed variability may include; development of early warning systems based on a combination of meteorological data and communities’ knowledge, adoption of crops adapted to water logging or stress conditions for the different seasons and agro-ecologies, and local institutional preparedness to anticipate and manage the climate variability induced risks. Key words: Rainfall Variability, Rainfall Trends, Farmers’ Perceptions, Eastern Uganda. 1. Introduction Evidence is emerging that climate change is increasing rainfall variability and the frequency of extreme events such as drought, floods, and hurricanes (IPCC, 2007). Boko et al. (2007) predict that Africa is likely to warm across all seasons during this century with annual mean surface air temperatures expected to increase between 3°C and 4°C by 2099, roughly 1.5 times average global temperatures. Projections in East Africa suggest that increasing temperatures due to climate change will increase rainfall by 5 - 20% from December to February, and decrease rainfall by 5-10% from June to August by 2050 (Hulme et al., 2001; IPCC, 2007). Analyses from General Circulation Models (GCM’s) indicate an upward trend in rainfall under global warming over much of Burundi, Kenya, Rwanda, southern Somali and Uganda (Schreck & Semazzi, 2004; van de Steeg et al., 2009). Studies conducted in Uganda indicate a general lack of scientific consensus on the trend and distribution of annual and seasonal rainfall. McSweeney et al. (2008) report an annual rainfall decrease of 3.5% since the 1960s, with annual rainfall due to decline further. McSweeney et al. (2008) further suggest that rains during the March to May rainy season are falling by 4.7% per decade. However, Government of Uganda (GOU 2007) indicates that the wetter areas of Uganda, around the Lake Victoria basin and the east and northwest are tending to become wetter, indicating an increase in rainfall in these areas. Temperature and rainfall simulations by Goulden (2008) indicate high percentage increases in rainfall for historically dry seasons for many parts of Uganda. In their study of localized precipitation around Kibale National Park in mid Western Uganda, Stampone
- 2. Journal of Natural Sciences Research www.iiste.org ISSN 2224-3186 (Paper) ISSN 2225-0921 (Online) Vol.3, No.8, 2013 180 et al. (2011) found that patterns in annual time series do not reflect the direction and magnitude of seasonal trends nor the spatial variability in intra-annual rainfall. On the seasonal scale, GOU (2007) reports increasing erratic onset and cessation of rainfall seasons across the country in recent years; coupled with increasing frequency of droughts. It has also been observed that falls are heavier and more violent. Non-governmental organizations working in Uganda also report that farmers recognize an increasingly erratic rainfall pattern in the first March to May rainy season, causing drought and crop failure, but also more intense rainfall, especially in the second rains at the end of the year, causing flooding and erosion (Oxfam, 2008). The spatial variability has been attributed to the complex topography and existence of large inland water bodies (Bamanya, 2007), La Niña and El Niño phenomena, with La Niña years tending to bring significant drying and El Niño years heavy rains (GOU, 2009). Despite these evidences in general trends of rainfall withnin the region and Uganda, this information may not be relied upon to make policy and management decisions, due to generalization over large scales. General Circulation Model scenarios are insufficiently precise in terms of spatial resolution or scale of assessment and fail to reasonably differentiate spatiality (Thornton, et al., 2008). Local level studies conducted in Uganda have been based on the magnitudes of monthly and seasonal rainfall (Kigobe et al., 2011; Komutunga & Musiitwa, 2001) and the occurrence of dry and wet spells (Bamanya, 2007, Osbahr et al., 2011), with limited focus on the variability of rainfall within the year and seasons. Yet according to Mukiibi (2001), the magnitude of rainfall is less critical to farmers’ production than distribution through a season. While, Stampone et al. (2011) assessed variability in areas around Kibale National Park, a tropical rain forest, results obtained from this area cannot be easily generalized over other areas in Uganda due to contextual and environmental differences. In addition, the lack of consensus by previous studies in Uganda calls for location-specific analysis to understand where variability is highest in order to support local level decision making on adaptation. This study addressed this information gap by providing empirical evidence of the extent of annual and seasonal rainfall variability in the context of Eastern Uganda for the 40-year period from 1971 to 2010. The region comprises of three distinct agro-ecological zones, ranging from low land to highland, and semi arid to sub humid. Clarity on variability by region and specific agro-ecology is essential to support vulnerable communities to adapt their food systems to emerging climate variability realities. It was hypothesized that there is no significant variation in the pattern of seasonal and inter-annual rainfall pattern in the three agro-ecologies of Eastern Uganda. 2. Study Area and Relevance to Sub-Saharan Africa Uganda lies in East Africa, astride the equator with its area lying between latitude 40 12’N and 10 29’S and longitude 290 34’W and 350 0’E (Ojakol, 2001). The country occupies 241,551 square kilometres of largely fertile arable land. It is bordered to the east by Kenya, to the north by South Sudan, to the west by the Democratic Republic of Congo, and to the south by Rwanda and Tanzania. The country is located on a plateau, averaging about 1100 meters (3,250 ft) above sea level sloping down to the Sudanese Plain to the north. Large parts of the country have fertile soil with regular rainfall and agriculture is the mainstay of both the national economy and the main source of livelihood for most Ugandans. Subsistence farming is the main source of household income for the majority of Ugandans. Agricultural products currently still supply nearly all of Uganda's foreign exchange earnings. The country is divided into four major regions - Western, Central, Eastern and Northern (GOU, 2010). This study was carried out in Eastern Uganda. The region comprises 32 districts (GOU, 2010) with a total population of about 6,301,677 people, which is 25.5% of the total population of Uganda (UBOS, 2002). The region comprises of three distinct agro-ecological zones (AEZs) - Lake Victoria Crescent and Mbale farm lands (L.Victoria Crescent); Southern and Eastern Lake Kyoga basin (SE L. Kyoga); and Mt. Elgon high farmlands (Mt. Elgon) (Wortmann & Eledu, 1999). The AEZs are largely determined by the amount of rainfall, which drives the agricultural potential and farming systems and range from sub-humid to semi-arid (GRID, 1987). They also capture variability in altitude, soil productivity, cropping systems, livestock systems, and land use
- 3. Journal of Natural Sciences Research www.iiste.org ISSN 2224-3186 (Paper) ISSN 2225-0921 (Online) Vol.3, No.8, 2013 181 intensity. Table 1 shows the AEZ in Eastern Uganda, their biophysical characteristics and their relevance to Sub- Saharan Africa (SSA). Although all the AEZs of Uganda are grappling with the effects of climate change and variability, the Eastern region is most affected. This is attributable to the fact that the region is less socially and economically developed, and even among the generally poorer parts of Uganda as a whole. It is characterized by a combination of acute poverty, vulnerability to drought, floods and landslides, and natural resource degradation. Recent floods in the Teso sub region and landslides in Bududa have led to crop loss and subsequent hunger and displacement of people (GOU, 2009). These climate challenges combined constrain crop production, increasing crop failure, thus exacerbating poverty. 3 Materials and Methods 3.1 Data and sampling procedure Data for the study were collected during August – September 2011 from both primary and secondary sources. Primary data were obtained from respondents on their perception of the long term rainfall variability and adequacy. The AEZs formed the study strata and from each, one district was randomly selected for the study. The districts included in this study are; Mbale, Pallisa and Sironko representing L. Victoria Crescent, SE L. Kyoga and Mt. Elgon agro-ecologies respectively. Using random sampling technique, nine sub counties were selected (three per district), and one village per sub-county from which respondents were drawn. Sample size was obtained using coefficient of variation method (Nassiuma, 2000). Three hundred and fifty three household surveys were conducted, nine focus group discussions (FGDs) involving 104 community members, and 23 key informant interviews (KIIs), using structured and semi-structured interview schedules. Observational rainfall data for these AEZs were obtained from Uganda Meteorological Department, of the Ministry of Lands and Environment, for the period extending from 1971 to 2010. At least one weather station exists in each of the AEZ of interest from which data were obtained. 3.2 Analytical methods To identify local rainfall variability in the study areas, this study quantified trends and variability in total seasonal and annual rainfall derived from monthly rainfall observations. Data were first evaluated for discontinuities by inspection of each time series and then tested for homogeneity using the Student’s t-test (von Storch & Zwiers, 1999) and found to be homogenous. Trend analysis was done to reveal the general movement of the rainfall pattern, examining evidence of any changes in the trend of rainfall amounts. Such patterns were investigated by use of both graphical and statistical methods. Graphical methods were used as a tool for visualization of temporal variation of annual rainfall amounts over the study period – 1971 to 2010. Regression analysis was done to determine the magnitude, direction and significance of the trends in annual and seasonal rainfall for each sample district. The regression equation was defined as: Yi = βo + β1Xi + ε Where Y = total annual rainfall, and X = time measure in years. It was hypothesized that there is no trend in the amount of rainfall over time. Thus the null hypothesis was stated as; H0: β1 = 0. Variability of annual and seasonal rainfall was assessed using Coefficient of Variation (CV), and Analysis of Variance (ANOVA) techniques. In addition, first moments of variation (minimum, maximum, mean, and standard deviation) were obtained using descriptive analysis. Standard rainfall anomalies were plotted against time (in years) to visualize the time series variation of annual and seasonal rainfall about the mean. In order to determine communities’ perceptions of rainfall trends and variability, respondents were asked two sets of questions. The first was asking farmers if they have observed any change in rainfall pattern, and if so, how many years back they had noticed this change. The second set consisted of asking farmers their perception of rainfall adequacy in the preceding agricultural season (August – November 2010, the base season for this study). The questions asked on rainfall adequacy included; whether rain came and stopped on time, whether
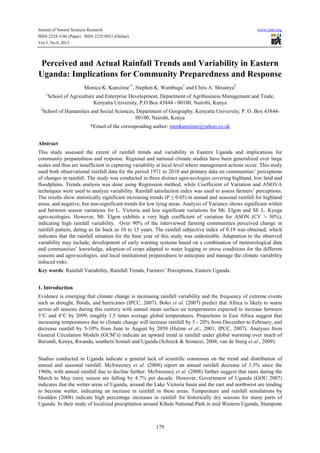
- 4. Journal of Natural Sciences Research www.iiste.org ISSN 2224-3186 (Paper) ISSN 2225-0921 (Online) Vol.3, No.8, 2013 182 there was enough rain at the beginning and during the growing season and whether it rained at harvest time (see Table 2). The responses for these questions were dichotomized in such a way that those who responded “on time” coded into one and others (early /late) into zero. The responses were summed and divided by the number of rain related questions (nine in this case). So the most favourable rainfall outcome is one and the least is zero. Quisumbing (2003) in the study of food aid and child nutrition in Ethiopia followed a similar approach in generating a rainfall satisfaction index. In the same token, Demeke and Zeller (n.d) used the same approach to study impacts of rainfall shock on smallholder food security in Ethiopia. 4 Results 4.1 Rainfall Variables Objective rainfall variables were computed based on observational rainfall data to obtain maximum, minimum and mean annual and seasonal rainfall as well as the standard deviation and coefficients of variation (CV). Table 3 shows summary information of annual and seasonal rainfall variables by AEZ. The two seasons recognized by farming communities were used to compute seasonal rainfall variables. That is, 1st season stretching from March to June (MAMJ), and 2nd season from August to November (ASON). From the table, it is observed that the mean annual rainfall in Eastern Uganda varies from 1374mm in parts SE L. Kyoga to 2058mm in Mt. Elgon. Mean seasonal rainfall varies from 522mm to 905mm in SE L. Kyoga and Mt. Elgon respectively. Results further show highest rainfall amounts both on the annual and seasonal scales in Mt. Elgon and lowest in SE L. Kyoga agro-ecologies. Results of CV for annual and seasonal rainfall amount show CVs less than 30% for all locations, except ASON season for Mt Elgon which shows a CV of 38%. The highest coefficients of variation are noted for Mt. Elgon area for both annual and seasonal rainfall. In addition, the variation is higher for ASON as compared to MAMJ for all locations. In addition to observational rainfall variables, a subjective index was obtained from asking farmers a series of questions related to rainfall adequacy in the previous growing season, in order to understand their perceptions of rainfall variability and how it relates to actual variation computed from weather stations. Over 90% of the farmers interviewed had perceived change in rainfall pattern, dating as far back as 10 to 15 years. The rainfall subjective index of 0.19 was obtained, which indicates that during the growing season of August – November 2010 (the base year for this research), the rainfall situation was undesirable (Table 4). Farmers’ generally reported late on set of rain, poor distribution within the season, and sometimes early cessation. In particular, they noted that the first season had shifted from a start in early March to mid or late March and now ended in June rather than May. Meanwhile, they claimed the second season had shifted from a start in August to September and now ended in November rather than December. During the past 15 years, farmers highlighted specific problems of variability in the duration, timings and intensity of the rains, including in winds and heavy rains at the start of the seasons, such as in 2004, 2006 and 2007. In the lower lying areas (SE L. Kyoga), respondents highlighted drought in the first season as an increasing problem, and more frequent flash floods as a result of increased rainfall intensity. In the highland areas (Mt. Elgon and part of L. Victoria Crescent), increased rainfall intensity leading to increased ground water and water logging and landslides was reported. Comparing means across the sample locations indicates no significant differences in people’s perception of climate variability (P<0.05). 4.2 Annual and Seasonal Rainfall Trends Graphical visualization of annual rainfall data for the period 1971 to 2010 in the studied agro-ecological zones is presented in Figures 1. There is an observed increasing trend of total annual rainfall for L. Victoria Crescent and Mt Elgon and a decreasing trend for SE L. Kyoga. Annual and seasonal rainfall totals were regressed against time scale and regression results are shown in Table 5. The results show statistically significant increasing trends (P ≤ 0.05) in annual and seasonal rainfall for Mt. Elgon. Negative, but non-significant trend is observed for annual rainfall for SE L. Kyoga. On the seasonal scale, MAMJ rainfall shows a negative trend, while ASON shows increasing trend for L. Victoria Crescent and SE L. Kyoga. For Mt. Elgon, both MAMJ and ASON show increasing trends.
- 5. Journal of Natural Sciences Research www.iiste.org ISSN 2224-3186 (Paper) ISSN 2225-0921 (Online) Vol.3, No.8, 2013 183 4.3 Annual and Seasonal Rainfall Variability The year-to-year variation of annual and seasonal rainfall over the studied agro-ecological zones was expressed in terms of normalised rainfall anomaly (Figures 2 and 3). This analysis of rainfall variability shows significant anomalies in annual rainfall in the recent past (2000 to 2010). While Mt. Elgon and L. Victoria Crescent seem to have received above average rainfall, SE L. Kyoga received more or less below average in the years from 2000 to 2010. Analysis of variance (ANOVA) shows significant variation in inter-annual rainfall as well as across AEZs. L. Victoria Crescent exhibits significant within and between season variations as shown in Table 7. 5 Discussion Descriptive study results show that Eastern Uganda experiences a bimodal seasonal pattern: the long rainy season starts around March and runs through to June, with the peak centred on March to May; the short rains run from August and taper off in November. Mean annual rainfall varies from 1374 mm in SE L. Kyoga to 2058 mm in Mt. Elgon. In comparison, the average long-term annual rainfall for Uganda is 1318 mm, which is considered adequate to support agricultural activities (Osbahr et al., 2011). This implies that Eastern Uganda receives adequate rainfall to support agriculture. Despite this seemingly desirable rainfall situation, the study shows significant variation in its distribution both on the annual and seasonal scales. Statistically significant increasing trends in annual rainfall are observed for Mt. Elgon and L. Victoria Crescent AEZs, and negative but non- significant trends for SE L. Kyoga basin. Seasonal trends indicate decreasing rainfall for MAMJ rainfall for L. Victoria Crescent and SE L. Kyoga, while in Mt. Elgon it is increasing, while ASON rainfall is increasing in all the three agro-ecologies. This result confirms earlier studies by Basalirwa (1995) who predict an increase of approximately 10-20% in rainfall for high ground areas, and more drying conditions for low areas like Uganda’s cattle corridor. Other studies in Uganda and government analysis papers also confirm these results indicating increasing trends in inter-annual rainfall, and decreasing trends in March-April-May (MAM) rainfall (GOU, 2007; Goulden, 2008; Hepworth & Goulden, 2008; Osbahr et al., 2011). Although McSweeney et al. (2008) report decrease in annual rainfall, they agree that the MAM rainfall is decreasing. Analysis of Variance shows significant within and between season variations for L. Victoria and less significant variations for Mt. Elgon and SE L. Kyoga. However, Mt. Elgon exhibits a very high coefficient of variation for ASON (CV > 30%). According to Araya and Stroosnijder (2011), a CV > 30% is an indicator of large rainfall variability. This may be linked to the 2007 El Nino rains that characterised the OND season in Uganda (GOU, 2009). Links between El Nino and climate variability have also been suggested by other studies (e.g. Anyah & Semazzi, 2007). Shisanya et al. (2011) also report above normal rainfall during OND season than preceding MAM rainfall in ASALs of Kenya during El Nino years. In terms of variability, seasonal rainfall in Eastern Uganda varies a lot around the mean, with occasions of subsequent below average rainfall. The variations are more pronounced for ASON than MAMJ seasons, and in the years from 2006 to 2010. Mutai et al. (1998), and Phillips and McIntyre (2000) also observed that OND variability is stronger than MAM. Farmers’ perceptions of climate variability are in line with actual climatic data, noting variability in the duration, timing and distribution within seasons, including in winds and heavy rains at the start of the seasons. This is a common finding from other studies on perceptions of resource users of climate change such as in the Sahel (Mertz et al., 2009), Nile basin of Ethiopia (Deressa et al., 2008), Zambia (Nyanga et al., 2011), semi-arid central Tanzania (Slegers, 2008); Uganda (Magrath, 2010), and Asia (Marin, 2010), where farmers perceived increased variability of rainfall and shifts in the growing seasons. Osbahr et al. (2011) indicates that the potential crop growing period is shrinking. Seasonal distribution of rainfall affects the decisions made by farming households on what type of crops to grow and land management practices to adopt (Komutunga and Musiitwa, 2001). In addition, excessive rains both in intensity and duration lead to water logging conditions that negatively affect crops and pasture (GOU, 2007; Komutunga & Musiitwa, 2001). For example drought in 2008 caused an average reduction in yield of 50% of simsim, sorghum, groundnuts, cassava and maize in Uganda (Ocowunb,
- 6. Journal of Natural Sciences Research www.iiste.org ISSN 2224-3186 (Paper) ISSN 2225-0921 (Online) Vol.3, No.8, 2013 184 2009). Heavy rainfall experienced between 2006 and 2010 is responsible for massive floods in the low land areas and numerous landslides in the mountainous regions in Eastern Uganda (GOU, 2009). In related studies in East Africa, Recha et al. (2012) report that persistence of below normal rainfall is a great risk to people’s livelihood in Tharaka district in Kenya, where majority of people have been left vulnerable to hunger and famine. Similar observations have been reported by various scholars studying, for example intra- seasonal factors, such as the timing of the onset of first rains affecting crop-planting regimes (Tennant & Hewitson, 2002), the distribution and length of period of rain during the growing season (Mortimore & Adams, 2001), and the effectiveness of the rains in each precipitation event (Usman & Reason, 2004), are the real criteria that affect the effectiveness and success of farming. IPCC (2007) reported that changes in rainfall amount and patterns also affect soil erosion rates and soil moisture, both of which are important for crop yields. From the farmers’ perspective, this uncertainty in addition to increasing food insecurity due to crop failure, it generally increases the cost of production as sometimes farmers have to re-plough and replant destroyed crop fields. As noted by Olupot John (37 years) from Kadengerwa village, Pallisa district: “We’ve stopped adopting seasonal planting, because it’s useless. Now we just try all the time. We used to plant in March, and that would be it. Now we plant and plant again. We waste a lot of seeds that way, and our time and energy. Sometimes we’ve hired labour and end up losing all that money for preparing land”. 6 Conclusions This study sought to provide empirical evidence of the extent of annual and seasonal rainfall variability in EasternUganda. The null hypothesis being tested was thus: Ho: There is no variation in the pattern of annual and seasonal rainfall in Eastern Uganda. Contrary to the expected direction of trends and variability, this study found significant variation in the amount and distribution of annual and seasonal rainfall. This is attributed to increase in extremes of rainfall on the annual scale such as high intensity rainfall and droughts thus affecting the variability. Significance of the variations varies by agro-ecological zone, attributed to variations in altitude, cropping systems and land use intensity in the specific locations. High land areas showed increasing amounts and higher variability in rainfall as opposed to low lying areas which showed decreasing amounts and less variability within and between seasons. Greater variation was observed for ASON, than MAMJ season for all the locations. Communities’ perceptions of rainfall adequacy were in line with observational data, where they acknowledged late rainfall onset, mid season droughts and early cessation, especially in the first season, and increase in high intensity rainfall, and climate related disasters such as floods, droughts and landslides during second season. Several others studies conducted in Uganda and SSA in general are in agreement with results of this study confirming increasing rainfall trends and variability for ASON, and decreasing trends for MAMJ season. Study findings have the following implications: First, significant within season variability negatively affects crop and livestock production, where in extreme cases there has been total crop failure either due to prolonged droughts or heavy erosive rainfall or floods washing away the crop. An example is the long rains in Uganda in 2007, 2008 and 2010. It is evident that ASON rains are increasing in magnitude and variability as compared to MAMJ rains, and farming communities are aware of the changing trends in seasonal rainfall, which greatly affects their farming decisions. Adaptation to the observed variability may include; development of early warning systems based on a combination of meteorological data and communities’ knowledge, adoption of crops adapted to water logging or stress conditions for the different seasons and locations, and local institutional preparedness to anticipate and manage the climate variability induced risks. Acknowledgements This paper is prepared as part of the PhD research work for the corresponding author, investigating the effectiveness of technological options for reducing production risks under variable climatic conditions in Eastern Uganda. The study was partially funded by Climate, Food and Farming Research Network (CLIFF) of the University of Copenhagen, Denmark. The authors acknowledge the financial support by CLIFF. The authors also
- 7. Journal of Natural Sciences Research www.iiste.org ISSN 2224-3186 (Paper) ISSN 2225-0921 (Online) Vol.3, No.8, 2013 185 thank the Uganda Meteorological Department for providing the rainfall data for this study. The support and participation of farming communities in Mbale, Pallisa and Sironko, and respective district extension personnel and leaders during data collection is also acknowledged. Lastly, the authors acknowledge the contributions of the anonymous reviewers of this paper for their technical input. References Anyah, R.O. & Semazzi, F.H.M. (2007). Variability of East African rainfall based on multiyear RegCM3 simulations. International Journal of Climatology, 27:357–371. Araya, A. & Stroosnijder, L. (2011) Assessing drought risk and irrigation needs in northern Ethiopia. Agricultural and Forestry Meteorology, 151:425–436 Bamanya, D. (2007). Intraseasonal characteristics of daily rainfall over Uganda during the wet seasons. MSc thesis (unpublished), University of Nairobi, Kenya. Basalirwa, C.P.K. (1995). Delineation of Uganda into climatological rainfall zones using principal component analysis. International Journal of Climatology 15:1161-1177. Boko, M., Niang, I., Nyong, A., Vogel, C., Githeko, A., Medany, M., ... Yanda, P. (2007). Africa climate change 2007: Impacts, adaptation and vulnerability. Contribution of working group II to the fourth assessment report of the intergovernmental panel on climate change. Parry, M.L., Canziani, O.F., Palutikof, J.P., van der Linden, P.J. and Hanson, C.E. (Eds.). Cambridge University Press, Cambridge UK. pp. 433-467. Demeke, A.B. & Zeller, M. (n.d). Impacts of Rainfall Shock on Smallholders Food Security and Vulnerability in Rural Ethiopia: Learning from Household Panel Data. Unpublished report for the Department of Agricultural Economics and Social Sciences in the Tropics and Subtropics (490a), University of Hohenheim, 70593 Stuttgart, Germany. Deressa, T., Hassan R.M. & Ringler, C. (2008). Measuring Ethiopian farmers’ vulnerability to climate change across regional states. International Food Policy Research Institute. IFPRI Discussion Paper 00806. GOU (2007). Climate Change: Uganda National Adaptation Programmes of Action in association with Environmental Alert, GEF and UNEP]. Government of Uganda (GOU), Kampala, Uganda. GOU (2009). The state of Uganda population report 2009. Addressing effects of climate change on migration patterns and women. Government of Uganda (GOU), Kampala, Uganda. GOU (2010). Uganda Districts. Source: http://molg.go.ug/local-governments, accessed July 2, 2012. Goulden, M. (2008). Building resilience to climate change in lake fisheries and lake-shore populations in Uganda. Policy briefing note, Tyndall Centre for Climate Change Research, University of East Anglia, UK (unpublished) GRID (1987). Uganda case study: A sampler atlas of environmental resource data sets within GRID. Global Resource Information Database (GRID) Information Series No.8, Nairobi. Accessed November 23, 2010 at http://gridnairobi.unep.org/chm/GridReports/UGANDA. Hepworth, N. & Goulden, M. (2008). Climate Change in Uganda: Understanding the implications and appraising the response. LTS International, Edinburgh Hulme, M., Doherty, R., Ngara, T., New, M. & Lister, D. (2001). African Climate Change: 1900-2100. Climate Research 17 (2):145-168. IPCC (2007). Climate Change 2007: Impacts, Adaptation and Vulnerability. Contribution of Working Group II to the Fourth Assessment Report of the Intergovernmental Panel on Climate Change, Annex I., M.L. Parry, O.F. Canziani, J.P. Palutikof, P.J. van der Linden and C.E. Hanson, Eds., Cambridge University Press, Cambridge, UK, 976pp. Kigobe, M., McIntyre, N., Wheater, H. & Chandler, R. (2011). Multi-site stochastic modelling of daily rainfall in Uganda. Hydrological Sciences Journal, 56(1): 17-33. Accessed August 22, 2011 at http://dx.doi.org/10.1080/02626667.2010.536548, Komutunga, E. & Musiitwa, F. (2001). Characterising drought patterns for appropriate development and transfer of drought resistant maize cultivars in Uganda. Paper presented at the Seventh Eastern and Southern Africa Regional Maize Conference 11-15 February 2001. Pp. 260-262
- 8. Journal of Natural Sciences Research www.iiste.org ISSN 2224-3186 (Paper) ISSN 2225-0921 (Online) Vol.3, No.8, 2013 186 Magrath, J. (2010). The injustice of climate change: Voices from Africa. Local Environment, 15:9-10, 891-901. Accessed August 22, 2011 at http://dx.doi.org/10.1080/13549839.2010.511642, Marin, A. (2010). Riders under storms: Contributions of nomadic herders' observations to analysing climate change in Mongolia. Global Environmental Change, 20(1), 162-176. doi:10.1016/j.gloenvcha.2009.10.004, accessed March 30, 2012 at http://dx.doi.org/10.1016/j.gloenvcha.2009.10.004 McSweeney, C., New, M. & Lizcano, G. (2008). UNDP Climate Change Country Profiles: Uganda. United Nations Development Programme (UNDP), New York. Mertz, O., Mbow, C., Reenberg, A. & Diouf, A. (2009). Farmers’ perceptions of climate change and agricultural adaptation in rural Sahel. Environmental Management 43: 804–816. Mortimore, M.J., & Adams, W.M. (2001). Farmer adaptation, change and crisis in the Sahel. Global Environmental Change, 11: 49-57. Mukiibi, J. K. (Ed.) (2001). Agriculture in Uganda, Volume 1 General Information. Kampala: Fountain Publishers/CTA/NARO Mutai, C.C., Ward, M.N. & Coleman, A.W. (1998). Towards the prediction of the east Africa short rains based on sea surface temperature — atmospheric coupling. International Journal of Climatology 18:975–997 Nassiuma D. K. (2000). Survey sampling: Theory and methods. Njoro, Kenya: Egerton University Press. Nyanga, P. H., Johnsen, F. H. & Aune, J. B. (2011). Smallholder Farmers’ Perceptions of Climate Change and Conservation Agriculture: Evidence from Zambia. Journal of Sustainable Development 4 (4):73-85. doi:10.5539/jsd.v4n4p73. Accessed on line on July 30, 2012 at www.ccsenet.org/jsd. Ocowunb, C. (2009). Uganda: Long droughts, food shortage hit country as victims cry out for help, AllAfrica.com, accessed November 20, 2011 at http://allafrica.com/stories/200907090729.html Ojacor, F.A. (2001). Introduction and organisation. In: Agriculture in Uganda. Volume I. General Information. Edit: J. K. Mukiibi. Fountain Publishers/CTA/NARO. pp. 1-20 Osbahr, H., Dorward, P., Stern, R. & Cooper, S. (2011). Supporting agricultural innovations in Uganda to respond to climate risk: Linking climate change and variability with farmer perceptions. Expl Agric. 47 (2): 293– 316 Cambridge University Press 2011. doi:10.1017/S0014479710000785. Accessed August 22, 2011 at http://creativecommons.org/licenses/by-nc-sa/2.5/ Oxfam (2008). Turning Up the Heat: Climate Change and Poverty in Uganda, July 2008, Oxfam GB Phillips, J. & McIntyre, B. (2000). ENSO and inter-annual rainfall variability in Uganda: implications for agricultural management. International Journal of Climatology, 20:171–182 Quisumbing, A.R. (2003). Food aid and child nutrition in rural Ethiopia. World Development, 31 (7): 1309-1324. Recha, C. W., Makokha, G. L. Traore, P. S., Shisanya, C., Lodoun, T. & Sako, A. (2012). Determination of seasonal rainfall variability, onset and cessation in semi-arid Tharaka district, Kenya. Theoretical and Applied Climatology, 108:479–494. DOI 10.1007/s00704-011-0544-3 Schreck, J. C. & Semazzi, H. M. F. (2004). Variability of the Recent Climate of Eastern Africa. International Journal of Climatology, 24:681-701 Shisanya, C. A., Recha, C. & Anyamba, A. (2011). Rainfall variability and its impact on Normalized Difference Vegetation Index in Arid and Semi-Arid Lands of Kenya. International Journal of Geosciences, 2: 36-47 DOI:10.4236/ijg.2011.21004. Accessed June 30, 2012 at http://www.SciRP.org/journal/ijg. Slegers, M. F. W. (2008). "If only it could rain": Farmers' perceptions of rainfall and drought in semi-arid central Tanzania. Journal of Arid Environments, 72: 2106-2123. doi:10.1016/j.jaridenv.2008.06.011, accessed March 30, 2012 at http://dx.doi.org/10.1016/j.jaridenv.2008.06.011 Stampone, D. M., Hartter, J., Chapman, A. C. & Ryan, J.S. (2011). Trends and Variability in Localized Precipitation Around Kibale National Park, Uganda, Africa. Research Journal of Environment and Earth Sciences, 3(1): 14-23. Tennant, W.J. & Hewitson, B.C. (2002). Intra-seasonal rainfall characteristics and their importance to the seasonal prediction problem. International Journal of Climatology, 22: 1033-1048.
- 9. Journal of Natural Sciences Research www.iiste.org ISSN 2224-3186 (Paper) ISSN 2225-0921 (Online) Vol.3, No.8, 2013 187 Thornton, P.K., van de Steeg, J.A., Notenbaert, A. & Herrero, M. (2008). The livestock-climate-poverty nexus: A discussion paper on ILRI research in relation to climate change. Discussion Paper No. 11. International Livestock Research Institute (ILRI), Nairobi, Kenya. 76 p. UBOS (2002). Uganda National Housing and Census Report. Uganda Bureau of Statistics, Government of Uganda, Kampala Usman, M.T. & Reason, C.J.C. (2004). Dry spell frequencies and their variability over southern Africa. Climate Research, 26: 199-211. van de Steeg, J.A., Herrero, M., Kinyangi, J., Thornton, P.K., Rao, K.P.C, Stern, R. & Cooper, P. (2009). The influence of current and future climate-induced risk on the agricultural sector in East and Central Africa: Sensitizing the ASARECA strategic plan to climate change. Research report 22. ILRI (International Livestock Research Institute), Nairobi, Kenya, ICRISAT (International Crop Research Institute for the Semi-Arid Tropics), Nairobi, Kenya, and ASARECA (Association for Strengthening Agricultural Research in Eastern and Central Africa), Entebbe, Uganda. Von Storch, H. & Zwiers, F. W. (1999). Statistical Analysis in Climate Research. Cambridge University Press, Cambridge. Wasige, J. E. (2009). Assessment of the Impact of climate change and climate variability on crop production in Uganda. End of project report (unpublished), Global Change SysTem for Analysis, Research and Training (START)/ US National Science Foundation (NFS). June 2009 Wortmann, C.S. & Eledu, C.A. (1999). Uganda’s agroecological zones: A guide for planners and policy makers. Kampala, Uganda: Centro International de Agricultural Tropical (CIAT).
- 10. Journal of Natural Sciences Research www.iiste.org ISSN 2224-3186 (Paper) ISSN 2225-0921 (Online) Vol.3, No.8, 2013 188 Table 1: Agro-Ecological Zones in Eastern Uganda, their biophysical characteristics and their relevance to SSA Characteristic Agro-Ecological Zone L. Victoria Crescent SE L. Kyoga Mt. Elgon Soils Petric Plinthosols (Acric) Gleysols (for Kumi area) Vertisols Mean altitude (m.a.s.l) 1174 1075 1299 - 1524 Population density 166.3/km2 (431/sq mi) 252/km2 (650/sq mi) 770/km2 (2,000/sq mi) Mean annual rainfall Bimodal high rainfall >1,200 mm/year Bimodal high rainfall >1,200 mm/year Bimodal high rainfall (>1,200 mm/year) Farming systems Montane (Millet/ Cotton) System Teso Systems Montane (Millet/ Cotton) System, Major crops Arabica coffee, banana, cotton, maize, bean, wheat, millet, rice, Irish potato, sweet potato Cotton, finger millet, sorghum, groundnut, sesame, sweet potato, cassava, Robusta coffee, beans, maize Arabica coffee, banana, cotton, maize, bean, wheat, millet, rice, Irish potato, sweet potato Major climate related disasters Mid to high ground areas vulnerable to floods and landslides Lies in the low land areas and in the cattle corridor vulnerable to droughts Lies in so called highland areas of Uganda vulnerable to landslides and water logging SSA countries with similar biophysical characteristics West-central (Democratic Republic of the Congo, Congo, etc.), and coastal region of western Africa Countries along the desert margin (e.g., Burkina Faso, Northern and central Nigeria, Namibia, central Sudan) Highlands of Cameroon, Ethiopia, Kenya, Malawi, Rwanda, and Tanzania (southern highlands) Sample districts and location Mbale (000 57’N, 340 20’E) Pallisa (010 01’N, 330 43’E) Sironko (010 14’N, 340 15’E) Representative weather station and location Tororo (0.930 N, 33.970 E) Soroti (1.720 N, 33.620 E) Sipi (1.330 N, 34.370 E) Source: Adapted and modified from Komutunga and Musitwa (2001) and Wasige (2009)
- 11. Journal of Natural Sciences Research www.iiste.org ISSN 2224-3186 (Paper) ISSN 2225-0921 (Online) Vol.3, No.8, 2013 189 Table 2: Rainfall Satisfaction Index Construction During the growing season preceding the last main harvest:* Codes Recorded into: 1 Did the rainfall come on time? 1=on time; 2=too early; 3=too late On time Others (2 and 3) 1 0 2 Was there enough rain on your fields at the beginning of the rainy season? 1=enough; 2=too little; 3=too much Enough Others (2 and 3) 1 0 3 Was there enough rain on your fields during the growing season? 1=enough; 2=too little; 3=too much Enough Others (2 and 3) 1 0 4 Did the rains stop on time on your fields? 1=on time; 2=too late; 3=too early On time Others (2 and 3) 1 0 5 Did it rain near the harvest time? 1 = no; 2 = yes No Others (2) 1 0 6 Number of rainfall days 1=No change; 2=Reduced; 3= Increased No change Others (2 and 3) 1 0 7 Frequency of heavy rains 1=No change; 2=Reduced; 3=Increased No change Others (2 and 3) 1 0 8 Frequency of dry spells 1=No change; 2=Reduced; 3=Increased No change Others (2 and 3) 1 0 9 Duration of the growing season 1=No change; 2=Reduced; 3=Increased No change Others (2 and 3) 1 0 * Reference was made to August - November 2010 rainy season
- 12. Journal of Natural Sciences Research www.iiste.org ISSN 2224-3186 (Paper) ISSN 2225-0921 (Online) Vol.3, No.8, 2013 190 Table 3: Summary of Rainfall Variables for the Study Locations Agro-Ecological Zone Rainfall Annual (1971-2010) Mar-Jun (MAMJ) Aug-Nov (ASON) L. Victoria Crescent Minimum (mm) 1018 445 283 Maximum (mm) 2068 932 840 Mean (mm) 1503 659 522 Std. Dev. 226 123 137 Coef. of Variation 15.04 18.66 26.25 SE L. Kyoga Minimum (mm) 895 306 271 Maximum (mm) 1844 936 74 Mean (mm) 1368 574 539 Std. Dev. 231 14 115 Coef. of Variation. 16.89 2.44 21.34 Mt. Elgon Minimum (mm) 1409 528 420 Maximum (mm) 3001 1287 2546 Mean (mm) 2058 812 905 Std. Dev. 349 166 328 Coef. of Variation 16.96 20.44 38.24 Source: Authors’ computation based on observational rainfall data from Meteorological department Table 4: Rainfall Subjective Index During the main growing season of 2010 Mean (Std. Dev.) L. Victoria Crescent SE L. Kyoga Mt. Elgon Overall 1. Did the rainfall come on time? 0.26 (0.44) 0.10 (0.30) 0.13 (0.33) 0.16 (0.37) 2. Was there enough rain at the beginning of the rainy season? 0.52 (0.50) 0.12 (0.32) 0.25 (0.44) 0.30 (0.46) 3. Was there enough rain during the growing season? 0.56 (0.50) 0.18 (0.38) 0.31 (0.46) 0.35 (0.48) 4. Did the rains stop on time? 0.23 (0.42) 0.07 (0.25) 0.18 (0.39) 0.16 (0.37) 5. Did it rain near the harvest time? 0.02 (0.14) 0.88 (0.32) 0.04 (0.19) 0.31 (0.46) 6. Did the number of rainfall days change? 0.26 (0.44) 0.01 (0.10) 0.03 (0.17) 0.10 (0.30) 7. Did the frequency of heavy rains change? 0.30 (0.46) 0.01 (0.10) 0.01 (0.10) 0.11 ()0.31 8. Did the frequency of dry spells change? 0.07 (0.25) 0.00 (0.00) 0.03 (0.17) 0.03 (0.18) 9. Did the duration of the growing season change? 0.38 (0.49) 0.23 (0.42) 0.08 (0.27) 0.23 (0.42) Average 0.29 (0.40) 0.18 (0.24) 0.12 (0.28) 0.19 (0.37) F-value 1.69 P-value 0.21 F crit (5%) 3.40 Source: Field data, 2011
- 13. Journal of Natural Sciences Research www.iiste.org ISSN 2224-3186 (Paper) ISSN 2225-0921 (Online) Vol.3, No.8, 2013 191 Table 5: Summary Statistics of the Regression Analysis AEZ Rainfall Coef. Std. Err. t stat P value R2 L. Victoria Crescent Annual 4.320 2.950 1.465* 0.151 0.052 MAMJ -0.258 1.726 -0.150 0.882 0.001 ASON 2.847 1.870 1.522* 0.136 0.057 SE L. Kyoga Annual -1.502 3.068 -0.490 0.063 0.006 MAMJ -3.090 2.033 -1.520* 0.137 0.057 ASON 1.472 1.592 0.924* 0.361 0.022 Mt. Elgon Annual 4.436 4.617 0.961* 0.341 0.023 MAMJ 3.134 2.167 1.446* 0.156 0.052 ASON 7.466 4.411 1.693* 0.099 0.070 * Significant at Alpha level = 0.05 Source: Field data, 2011 Table 7: ANOVA of Annual and Seasonal Rainfall Source of Variation SS MS F-value F crit. Annual Inter-annual 6324334 158108 1.636* 1.545 Inter-AEZs 12231595 6115797 63.263* 3.111 Total 26289740 Mbale Between Seasons 384928 384928 22.707* 3.960 Within Seasons 1356130 16951 Total 1741058 Pallisa Between Seasons 23783 23783 1.340 3.960 Within Seasons 1419921 17749 Total 1443704 Sironko Between Seasons 178077 178077 2.636 3.960 Within Seasons 5404352 67554 Total 5582429 *Significant at Alpha level =0.05 Source: Field data, 2011
- 14. Journal of Natural Sciences Research www.iiste.org ISSN 2224-3186 (Paper) ISSN 2225-0921 (Online) Vol.3, No.8, 2013 192 (a) (b) (c) Figure 1: Trend of annual rainfall for (a) L. Victoria, (b) SE L. Kyoga and (c) Mt. Elgon Source: Field data, 2011 y = 4.3232x + 1412.3 R² = 0.0522 0 500 1000 1500 2000 2500 1970 1972 1974 1976 1978 1980 1982 1984 1986 1988 1990 1992 1994 1996 1998 2000 2002 2004 2006 2008 2010 Totalannualrainfall(mm) L. Victoria y = -1.5019x + 1399.8 R² = 0.0061 0 200 400 600 800 1000 1200 1400 1600 1800 2000 1970 1972 1974 1976 1978 1980 1982 1984 1986 1988 1990 1992 1994 1996 1998 2000 2002 2004 2006 2008 2010 Totalannualrainfall(mm) SE L. Kyoga y = 4.436x + 1964.8 R² = 0.0231 0 500 1000 1500 2000 2500 3000 3500 1970 1972 1974 1976 1978 1980 1982 1984 1986 1988 1990 1992 1994 1996 1998 2000 2002 2004 2006 2008 2010 Totalannualrainfall(mm) Mt. Elgon
- 15. Journal of Natural Sciences Research www.iiste.org ISSN 2224-3186 (Paper) ISSN 2225-0921 (Online) Vol.3, No.8, 2013 193 (a) (b) (c) Figure 2: Trends in annual rainfall anomalies relative to the 1971-2010 mean rainfall for (a) L. Victoria, (b) SE L. Kyoga and (c) Mt. Elgon Source: Field data, 2011 -3 -2 -1 0 1 2 3 1971 1973 1975 1977 1979 1981 1983 1985 1987 1989 1991 1993 1995 1997 1999 2001 2003 2005 2007 2009 Standardizedanomaly SE L. Kyoga -3 -2 -1 0 1 2 3 1971 1973 1975 1977 1979 1981 1983 1985 1987 1989 1991 1993 1995 1997 1999 2001 2003 2005 2007 2009 Standardizedanomaly Mt. Elgon -3 -2 -1 0 1 2 3 1971 1973 1975 1977 1979 1981 1983 1985 1987 1989 1991 1993 1995 1997 1999 2001 2003 2005 2007 2009 Standardizedanomaly L. Victoria
- 16. Journal of Natural Sciences Research www.iiste.org ISSN 2224-3186 (Paper) ISSN 2225-0921 (Online) Vol.3, No.8, 2013 194 (a) (b) (c) Figure 3: Trend in seasonal rainfall anomalies relative to the 1971-2010 mean rainfall for (a) L. Victoria, (b) SE L. Kyoga and (c) Mt. Elgon Source: Field data, 2011 -4 -2 0 2 4 6 1971 1973 1975 1977 1979 1981 1983 1985 1987 1989 1991 1993 1995 1997 1999 2001 2003 2005 2007 2009 StandardizedAnomaly L. Victoria MAMJ ASON -4 -2 0 2 4 6 1971 1973 1975 1977 1979 1981 1983 1985 1987 1989 1991 1993 1995 1997 1999 2001 2003 2005 2007 2009 StandardizedAnomaly SE L. Kyoga MAMJ ASON -4 -2 0 2 4 6 1971 1973 1975 1977 1979 1981 1983 1985 1987 1989 1991 1993 1995 1997 1999 2001 2003 2005 2007 2009 StandardizedAnomaly Mt. Elgon MAMJ ASON
- 17. This academic article was published by The International Institute for Science, Technology and Education (IISTE). The IISTE is a pioneer in the Open Access Publishing service based in the U.S. and Europe. The aim of the institute is Accelerating Global Knowledge Sharing. More information about the publisher can be found in the IISTE’s homepage: http://www.iiste.org CALL FOR PAPERS The IISTE is currently hosting more than 30 peer-reviewed academic journals and collaborating with academic institutions around the world. There’s no deadline for submission. Prospective authors of IISTE journals can find the submission instruction on the following page: http://www.iiste.org/Journals/ The IISTE editorial team promises to the review and publish all the qualified submissions in a fast manner. All the journals articles are available online to the readers all over the world without financial, legal, or technical barriers other than those inseparable from gaining access to the internet itself. Printed version of the journals is also available upon request of readers and authors. IISTE Knowledge Sharing Partners EBSCO, Index Copernicus, Ulrich's Periodicals Directory, JournalTOCS, PKP Open Archives Harvester, Bielefeld Academic Search Engine, Elektronische Zeitschriftenbibliothek EZB, Open J-Gate, OCLC WorldCat, Universe Digtial Library , NewJour, Google Scholar