1. Environmental Pollution 188 (2014) 27e36
Understanding the paradox of selenium contamination in mercury
mining areas: High soil content and low accumulation in rice
Hua Zhang a,b, Xinbin Feng a,*, Chengxin Jiang c, Qiuhua Li d, Yi Liu e, Chunhao Gu a,
Lihai Shang a, Ping Li a, Yan Lin b, Thorjørn Larssen b
a State Key Laboratory of Environmental Geochemistry, Institute of Geochemistry, Chinese Academy of Sciences, 46 Guanshui Road, Guiyang 550002, China
b Norwegian Institute for Water Research (NIVA), Gaustadalléen 21, 0349 Oslo, Norway
c Academy of Engineering Institute, China University of Geosciences, Wuhan 430074, China
d Key Laboratory for Information System of Mountainous Area and Protection of Ecological Environment of Guizhou Province, Guizhou Normal University,
Guiyang 550001, China
e Guizhou Academy of Geological Survey, Guiyang 55005, China
a r t i c l e i n f o
Article history:
Received 23 October 2013
Received in revised form
10 January 2014
Accepted 14 January 2014
Keywords:
Bioaccumulation
Food consumption
Mercury mining areas
Soil selenium contamination
Sequential partial dissolution
a b s t r a c t
Rice is an important source of Se for billions of people throughout the world. The Wanshan area can be
categorized as a seleniferous region due to its high soil Se content, but the Se content in the rice in
Wanshan is much lower than that from typical seleniferous regions with an equivalent soil Se level. To
investigate why the Se bioaccumulation in Wanshan is low, we measured the soil Se speciation using a
sequential partial dissolution technique. The results demonstrated that the bioavailable species only
accounted for a small proportion of the total Se in the soils from Wanshan, a much lower quantity than
that found in the seleniferous regions. The potential mechanisms may be associated with the existence of
Hg contamination, which is likely related to the formation of an inert HgeSe insoluble precipitate in soils
in Wanshan.
2014 Elsevier Ltd. All rights reserved.
1. Introduction
Selenium (Se) is among the most controversial trace elements
because it can be both toxic and nutritional. It is toxic at high levels
and essential within a physiologically appropriate margin. Se can
have adverse effects on human health in excess or deficiency. Se
exists in human and animal selenoproteins as selenocysteine and
selenomethionine and is incorporated into the active sites of anti-oxidant
selenoenzymes (Rayman, 2012). For many years, gluta-thione
peroxidase was considered the main selenoprotein;
however, later discoveries indicated that glutathione peroxidase is
only one of at least 25 genetically encoded selenoproteins
(including multiple forms of glutathione peroxidases and thio-redoxin
reductases) (Reeves and Hoffmann, 2009). Through its
incorporation into selenoenzymes, Se is involved in important
biological functions that affect such processes as free radical
metabolism, immune function, reproductive function and
apoptosis (Fordyce, 2013; Rayman, 2012). Severe Se deficiencies
(e.g., 10 mg/day) are likely involved in the etiology of a well-known
cardiomyopathy endemic in China (Keshan disease) (KDRG, 1979).
Therefore, adequate Se intake is important to maintain normal
physiological function in humans. The safe intake range of Se as
recommended by the Chinese Nutrition Society is rather narrow:
50e200 mg/day for adults (identical to that recommended by the
U.S. National Research Council) (CNS, 1990; Fordyce, 2013).
The distribution of Se is uneven over the Earth’s surface. Sele-niferous
and Se-deficient geo-ecosystems can be formed within
limited geographic zones (Tan et al., 2002). Several areas, such as
Enshi in Hubei, China; the Great Plains of the USA and Canada; and
portions of Ireland, Colombia and Venezuela are known selenif-erous
areas. However, on a global basis, areas of low-Se or Se-deficient
soil are more common than areas of Se-rich soil. Over
40 countries, including China, Denmark, Finland, New Zealand and
Russia (eastern and central Siberia), have been designated as low-
Se or Se-deficient according to the World Health Organization
(WHO) (Combs, 2001; Li et al., 2007a). Globally, between 0.5 and 1
billion people are estimated to suffer from Se deficiency (Combs,
2001).
On the periodic table, Se belongs to the same group of elements
as sulfur. Consequently, its biogeochemical properties are analo-gous
to those of sulfur, one of the most common elements in Earth’s
* Corresponding author.
E-mail address: fengxinbin@vip.skleg.cn (X. Feng).
Contents lists available at ScienceDirect
Environmental Pollution
journal homepage: www.elsevier.com/locate/envpol
0269-7491/$ e see front matter 2014 Elsevier Ltd. All rights reserved.
http://dx.doi.org/10.1016/j.envpol.2014.01.012
2. 28 H. Zhang et al. / Environmental Pollution 188 (2014) 27e36
3 4 2
2
crust. Selenium is often found in association with sulfur-containing
minerals. In the natural environment, Se typically exists in four
different oxidation states (II, 0, þIV, þVI) as selenide, elemental
Se, dissolved selenates (SeO) and selenites (SeO); under
normal soil conditions, Se exists as insoluble elemental Se (Se0),
selenides (Se2) and organo-selenium compounds (containing Ce
SeeC chemical bonds), such as volatile methyl-selenides, tri-methyl-
selenonium ions and several seleno-amino acids (Bujdos
et al., 2005).
China has abundant Se resources (e.g., Enshi in Hubei province
and Ziyang in Shanxi province, where topsoil Se exceeds
1.0 mg kg1) in some regions and low-Se or Se-deficient soils in
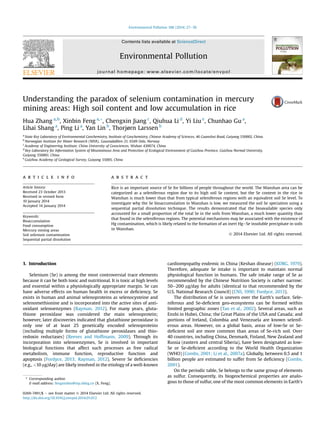
others (over two-thirds of the country) (Tan et al., 2002). As shown
in Fig. 1, a belt of low-Se soil (the “Se deficiency belt”), primarily
composed of brown soil, stretches from the northeast to the
southwest across approximately 22 provinces or districts, including
Heilongjiang, Jilin, Liaoning, Beijing, Shandong, Inner Mongolia,
Gansu, Sichuan, Yunnan, Tibet and Zhejiang (Tan, 1989).
Daily food consumption is typically the primary route for human
Se intake. In addition to fish, which is known to accumulate high Se
loads, dietary rice is of great significance for maintaining sufficient
Se intake for billions of people with a rice-based diet, especially
those in Asian countries, including China, where rice is a staple food
(Zhang et al., 2012). A recent global survey of rice indicated that
approximately 75% of grain samples failed to meet the recom-mended
Se intake quantity for human health (Williams et al.,
2009). Although rice grains typically contain much lower Se con-centrations
than meat and fish (Navarro-Alarcon and Cabrera-
Vique, 2008), rice is one of the primary Se sources (40e70%) for
rice-eating populations due to their high rice intake (e.g., 300e
600 g/day/person) (Williams et al., 2009; Zhang et al., 2012).
Rice can efficiently assimilate inorganic Se into organic forms (Li
et al., 2010), which enhances the nutritional efficacy of Se. Organic
forms of Se are more bioavailable to humans than inorganic forms
are (Rayman et al., 2008). Several studies have revealed that the
total Se content in rice is dominated by an organic form, protein-bound
selenomethionine, which accounts for more than 80% of
the total Se (Fang et al., 2009; Li et al., 2010; Mar et al., 2009).
In addition to serving as a micronutrient, Se can inhibit the
harmful effects of Hg exposure, potentially making it the most
important micronutrient in rice in regions where rice is the staple
food (Khan and Wang, 2009). One good example is a recent study
by Li et al. (2012), which indicated that supplementation with
organic Se substantially improved Hg excretion in individuals and
inhibited the oxidative damage from long-term Hg exposure.
Although usually overlooked by environmental researchers and
policy-makers, Se is an important co-existing elemental compo-nent
of the mineral matrix of Hg ore deposits in mercury mining
areas. For instance, tiemannite (mercury selenide, HgSe) has been
reported in Wanshan since 1975 (Bao, 1975; Zhang et al., 2012).
Wanshan is known as the “mercury capital” of China; it once had
the largest reserves and production of Hg in Asia and the third-largest
reserves and production in the world (Zhang et al., 2010b,
2012). The chemical composition of the tiemannite from this area
was measured as 7074 wt% Hg and 2427 wt% Se (Zhang et al.,
2012). Selenium often occurs as an isomorphous substituent of
sulfur in sulfide crystal lattices. Sulfur atoms in cinnabar ore can be
replaced by Se atoms to form an isomorphous series of HgSeHgSe
because the extremely high binding affinity between Se and Hg for
mercury selenide (HgSe) is much greater than that for mercury
sulfide (HgS) (Zhang et al., 2012). Therefore, cinnabar and ores in
mercury mining areas typically contain considerable Se contents.
Fig. 1. Soil selenium distribution in China and the location of the study area (modified from that found in the literature; Tan, 1989).
3. H. Zhang et al. / Environmental Pollution 188 (2014) 27e36 29
However, the majority of the Se in Hg-mining areas is typically
distributed in cinnabar (the natural ore of mercuric sulfide), with
small quantities found in tiemannite and metacinnabar. In the
Wanshan area, the Se content in common cinnabar was observed to
range from 0.02 to 0.87 wt%, with a maximum Se content in met-acinnabar
of approximately 2.7 wt% (Zhang et al., 2012).
The historic large-scale mining and retorting activities of cin-nabar
and other Se-rich ores can result in the release of large
quantities of Se and Hg into the surrounding environment. The
average (range) paddy soil Se content inWanshan is 2.1 (0.16e36.6)
mg kg1 (Horvat et al., 2003; Zhang et al., 2010b), which is com-parable
to the soil content of 6.5 (0.41e47.7) mg kg1 reported from
the well-known seleniferous area of Enshi, China (known as the
“world capital of selenium”) (Fordyce et al., 2000; Sun et al., 2010;
Zhu et al., 2008). However, contrary to expectations, the Se con-centration
in the rice grains from Wanshan, 0.10 (0.02e
0.67) mg kg1, is approximately 27 times lower than that in Enshi,
2.73 (0.08e9.67) mg kg1 (Sun et al., 2010). A comparison of the Se
concentrations in soil and rice among different countries and re-gions
of China (Table 1) has further revealed that an obvious
discrepancy exists in the Se contamination in Wanshan: unlike
other areas, in Wanshan, high-Se soils produce low-Se rice.
Several plant studies have indicated that the presence of Hg in
the environment plays an important antagonistic role against Se,
influencing its bioavailability, uptake and translocation in aerial
plants (Afton and Caruso, 2009; McNear et al., 2012; Mounicou
et al., 2006a, 2006b; Yathavakilla and Caruso, 2007). However,
our previous field study in the Wanshan area indicated that the
antagonistic effects of Hg on Se uptake by rice plants may only
significantly occur when Se exposure exceeds a certain threshold
(Zhang et al., 2012). A recent study on garlic (Allium sativum) in
laboratory experiments has also indicated that an increase in Hg
levels surrounding the root environment seems to have no inhibi-tive
effects on the plant’s uptake of Se into the aerial tissues when
the Se levels surrounding the root are low. On the contrary, it even
significantly enhanced the plant’s Se uptake (Zhao et al., 2013a). A
possible explanation of this phenomenon is that the plant may have
a special biological function to protect against the toxicity of Hg
exposure through enhanced Se uptake from the soil. However,
when exposed Se and Hg are both high, there is a common phe-nomenon
of antagonism between the two elements (Zhang et al.,
2012; Zhao et al., 2013b), although the processes of uptake and
translocation of Se versus Hg by plants are inconsistent (Zhang
et al., 2012; Zhao et al., 2013b). A significantly negative correla-tion
between rice Se content and soil Hg content was not observed
in Wanshan’s Hg-mining area (Horvat et al., 2003; Zhang et al.,
2012). Therefore, the Se cycling, flux and balance in the soile
plant system is complicated and is associated with the Se levels,
bioavailable fractions, interactions with Hg and other complex
processes.
Table 1
Comparison of the Se concentrations in soil and rice among different countries and regions of China (mg kg1).
Area Soil Se Soil water-soluble Se Reference Rice Se Reference
Earth’s crust 0.05 Fordyce, 2013
Global 0.2 (0.1e2) Swaine, 1995 0.095 Williams et al., 2009
U.S. 0.39 (0.1e4.3) 0.05e0.39 Shacklette and Boerngen, 1984 0.319 Nazemi et al., 2012
England/Wales (general) 0.01e16 Fordyce, 2013
Scotland (general) 0.12e0.88 0.007e0.027 Fordyce, 2013
Northern Ireland (general) 0.02e7.8 Fordyce, 2013
Finland (general) 0.005e1.24 Fordyce, 2013
Iran (general) 0.23 (0.04e0.45) Nazemi et al., 2012
India (Se-deficient) 0.025e0.71 0.019e0.066 Fordyce, 2013
India (seleniferous) 1e19.5 0.05e0.62 Fordyce, 2013
Sri Lanka (Se-deficient) 0.11e5.24 0.005e0.043 Fordyce, 2013
Norway 3e6 Fordyce, 2013
New Zealand (general) 0.1e4 Fordyce, 2013
China (general) 0.29 (0.05e0.99) 0.010 (0.0025e0.018) CNEMC, 1990; Wu et al., 1997 0.032 Wang, 1991
China (Se-deficient) 0.125 0.003 Tan et al., 2000 0.025 Tan et al., 2000
China (Se-marginal) 0.125e0.175 0.003e0.006 Tan et al., 2000 0.025e0.04 Tan et al., 2000
China (Se-optimum) 0.175e0.40 0.006e0.008 Tan et al., 2000 0.04e0.07 Tan et al., 2000
China (Se-rich) 0.175e3 0.008e0.02 Tan et al., 2000 0.07e1 Tan et al., 2000
China (Se-excessive) 3 0.02 Tan et al., 2000 1 Tan et al., 2000
Beijing, China 0.28 0.039 0.005 Yang et al., 1983
Beijing (Zhoukoudian), China 0.21 0.013 Li et al., 2007a 0.034 0.002 Li et al., 2007a
Ganshu, China 0.16 (0.045e0.40) Zhu and Jia, 1991
Guangdong, China 0.23 (0.03e1.42) Zhang et al., 2008
Guangxi, China 0.55 Ban and Ding, 1992
Guizhou, China 0.37 (0.064e1.33) Wang et al., 2008 0.025 (0.011e0.055) Li et al., 2005
Guizhou (Kaiyang), China 0.59 (0.21e2.36) 0.013 (0.0075e0.024) Li et al., 2005 0.081 (0.039e0.134) Li et al., 2005
Hainan, China 0.765 (0.055e2.23) Xu et al., 2010
Heilongjiang, China 0.21 (0.035e0.36) 0.0033 0.0003 Shao and Guan, 1993; Yang et al., 1983
Hong Kong, China 0.76 (0.07e2.26) Zhang et al., 2005
Hunan, China 0.43 (0.08e2.78) Wang et al., 2008
Jiangsu (Rugao), China 0.13 0.02 0.0023 0.0011 Sun et al., 2008 0.097 (0.016e0.40) Sun et al., 2008
Northeast China 0.11 (0.015e0.54) Wang et al., 2008
Shanxi, China 0.12 (0.018e17.62) Wang et al., 2008
Tibet, China 0.15 (0.049e0.37) Wang et al., 2008
Yangtze River Delta, China (0.035) 0.022e0.050 0.0095 (0.0067e0.012) Cao et al., 2001 0.029 (0.02e0.036) Cao et al., 2001
Zhejiang, China 0.29 0.061 Li et al., 2007b
Enshi, Hubei, Chinaa 6.5 (0.41e9.67) 0.354 0.045 Sun et al., 2010; Yang et al., 1983 2.73 (0.08e9.67) Sun et al., 2010
Wanshan, Guizhou, Chinaa 2.1 (0.16e36.6) 0.019 (0.0058e0.046) Zhang et al., 2012,b 0.10 (0.02e0.67) Zhang et al., 2012
a Enshi seleniferous areas versus Wanshan mercury mining areas.
b Present study.
4. 30 H. Zhang et al. / Environmental Pollution 188 (2014) 27e36
The present study was designed (1) to test the hypothesis that
the inhibition of Se uptake by rice plants is associated with the Se
speciation in the soil using a sequential partial dissolution method
and (2) to explore the possible mechanisms behind the low
bioavailability of Se in the soil from the Hg-mining areas. We sus-pected
that the bioavailability was related to Hg contamination.
2. Materials and methods
2.1. Study area
The Wanshan area is a typical mountainous and karstic terrain with elevations
ranging from 205 to 1149 m above sea level. The region has a sub-tropical humid
climate characterized by abundant precipitation and mild temperatures. The annual
average rainfall is 1200e1400 mm, and the annual mean temperature is 17 C. The
upstream portion of the study area is a typical karstic landscape; hence, the outcrops
upstream of the basin are carbonate rocks, including limestone, dolomite and
dolomitic limestone. The area downstream of the study area features a non-karstic
landscape with a bedrock of sandstone and shale and developed tributaries.
2.2. Sample collection and preparation
Building upon our previous studies, 16 typical soil samples were selected from
59 sampling sites in the Wanshan area, for which the total Se in the soil and rice
samples has been previously reported (Zhang et al., 2012). The soil samples were
used to measure the Se speciation. Typical soil samples were identified according to
the total Se content, with a gradient varying widely from 0.65 to 12.2 mg kg1. We
selected soil samples with Se contents (0.65 mg kg1 minimum) over six times
greater than the average for the area (0.1 mg kg1) to ensure the success of the
extraction and the analysis of different Se fractions.
The soil samples were collected from the rice roots (approximately 5e10 cm top
depth). At each sampling site, a composite samplewas composed of five subsamples.
All soil samples were individually sealed in three successive polyethylene bags to
avoid cross-contamination and transferred to the laboratory on the day of sampling
(stored and transferred with ice packs). A detailed description of the sample
collection and preparation is provided in our previous reports (Zhang et al., 2010b,
2012).
2.3. Analytical methods
There is no standard method for soil Se speciation analysis that is commonly
accepted by researchers. For better comparison with the data of previous reports in
other regions in China (Table 1), in the present study, selenium speciation analyses
of the 16 selected typical soil samples were conducted according to a sequential
partial dissolution (SPD) method, which was modified from a previous study (Zhang
et al., 1997). The SPD procedure extracts soil Se into six operationally defined
fractions (Fig. 2): water-soluble (Milli-Q water); ligand-exchangeable (0.1 mol L1
KH2PO4); organic-bound (0.1 mol L1 NaP2O7); Fe/Mn/Al oxide-, amorphous mate-rial-,
hydrate- and carbonate-bound (4.0 mol L1 HCl); sulfide-bound (KClO3 þ HCl);
and residual Se (HF þ HNO3 þ HClO4). To ensure the extraction efficiency, the
procedure for each fraction established by Zhang et al. (1997) was repeated by
dividing the extraction agent into two parts. The procedures are described in detail
in Table 2.
The Se fractions were determined via hydride generation atomic fluorescence
spectrometry (HG-AFS). Measurements of the total Se in the soils and rice grains
were reported in detail in our recent paper (Zhang et al., 2012). The total Se in the six
species accounted for 92% (81e105%) of the measured total Se content; furthermore,
the total Se in the soils was significantly correlated with all species (r2 ¼ 0.25e0.92,
p 0.01 for all; Fig. 3). The results indicate that the SPD technique used in the
present study is suitable for meeting the study objectives.
3. Results and discussion
3.1. Total Se in soil and rice
A comparison of the Se concentrations in soil and rice among
counties and regions of China (including the Wanshan area in the
present study) is shown in Table 1.
Total Se in soil. The overall average soil Se content in the
Wanshan area (2.1 mg kg1) is five times greater than that of all of
Guizhou province, which contains the Wanshan area
(0.39 mg kg1) (Wang et al., 2008); seven times greater than that of
China (0.29 mg kg1) (CNEMC, 1990;Wu et al., 1997); and 40 times
greater than that of the Earth’s upper crust (0.05 mg kg1) (Fordyce,
2013). In addition, the soil Se content in Wanshan (0.16e36.6) is
greater than that in not only many other provinces of China, e.g.,
Heilongjiang, Shanxi, Ganshu, Guangxi, Hainan and Hong Kong
(0.11e0.77 mg kg1) (Table 1), but also many other countries, e.g.,
the US (0.1e4.3 mg kg1), the UK (0.01e18 mg kg1), Finland
(0.005e1.24 mg kg1), Iran (0.04e0.45 mg kg1), India (0.025e
19.5 mg kg1), Sri Lanka (0.11e5.24 mg kg1), Norway (3e6) and
New Zealand (0.1e4 mg kg1) (Fordyce, 2013; Nazemi et al., 2012;
Shacklette and Boerngen, 1984). Furthermore, as previously
mentioned, the average (range) paddy soil Se value inWanshan (2.1
(0.16e36.6 mg kg1)) is comparable to that reported for the well-
Fig. 2. Averages and standard deviations of the concentrations of each speciation and their ratios to total Se in all selected soil samples.
5. H. Zhang et al. / Environmental Pollution 188 (2014) 27e36 31
Table 2
Sequential partial dissolution procedures for Se fractionation in soil (modified from Zhang et al., 1997).
ID. Se fractionation Method description
1 Water-soluble (Milli-Q water) A 0.5e1.0-g soil sample was transferred into a 50-mL centrifuge tube. Next, 10 mL of Milli-Q water at room
temperature was added, and the mixture was shaken for 2 h using a reciprocal laboratory shaker (150/min).
The suspension was then centrifuged at 3500 rpm at 25 C for 30 min, and the extracted solution was removed
into another tube. An additional 10 mL of Milli-Q water was then added to the residue, and the procedure
was repeated. The extracted 20-mL solution was mixed for final analysis.
2 Ligand-exchangeable (0.1 mol L1 KH2PO4) K2HPO4 (10 mL, 0.1 mol/L) was added to the tube containing the residual solids from step (1). The other steps
were identical to those in (1). When the extracted solution was transferred, another 10 mL of K2HPO4 was
added to the residual solids, and the procedure was repeated. The extracted 20-mL solution was mixed for
final analysis.
3 Organic-bound (0.1 mol L1 NaP2O7) The tube containing the residual solids from step (2) was treated with 20 mL of 0.1 mol/L Na4P2O7 (pH ¼ 10) and
shaken for 4 h using a reciprocal laboratory shaker (150/min). The suspension was then centrifuged at 3500 rpm
and 25 C for 30 min, and the extracted solution was removed into a 50-mL PFA beaker. Next, 5 mL of
Milli-Q water was added to the residual solids, which were shaken for 30 min and centrifuged for 20 min. The
extracted solution was transferred into the PFA beaker containing the previous solution. After adding 5 mL
of 16 mol/L HNO3, the PFA beaker was placed on an electric hotplate. The solution was evaporated and reduced
to approximately 5 mL. An additional 5 mL of 16 mol/L HNO3 and 2 mL of HClO4 were added, and the solution
was re-evaporated until the volume reached approximately 1e2 mL. After cooling, the solution was added to
18 mL of HCl (6 mol/L), heated until near ebullition (which was maintained for 10 min), and then diluted to
25 mL with 6 mol/L HCl for final analysis.
known seleniferous areas in Enshi, China (6.5 (0.41e47.7) mg kg1)
(Sun et al., 2010; Yang et al., 1983).
Therewas a weak but significantly negative correlation between
soil pH and soil Se in the present study (r2 ¼ 0.17, p 0.05, log-transformed;
Fig. 4a), suggesting that acidic soils may have
enhanced stability for Se relative to alkaline soils. However, no
significant correlations (p 0.05) were observed between the Se
content and the organic matter content in the paddy soils (Fig. 4d)
despite the well-known strong association between the Se in soil
and organic matter, which may indicate that the Se content in local
soils was not dominated by organic matter. However, the total Se
concentrations in soils decrease significantly with the distance
from the mine-waste calcines (r2 ¼ 0.38, p 0.01; Fig. 5), which
indicated that the mine-waste calcines are significant sources of Se
in soil in the downstream areas.
In previous studies, the total Se content has been used to classify
soil type. As shown in the map in Fig. 1, according to the spatial
coupling between the total soil Se content and its endemic distri-bution
throughout China, soils with different Se contents can be
categorized into five different soil types: Se-deficient
(0.175 mg kg1), Se-marginal (0.125e0.175 mg kg1), Se-sufficient
(0.175e0.4 mg kg1), Se-rich (0.4e3.0 mg kg1) and Se-excessive
(3.0 mg kg1) (Tan, 1989). Based on this classification,
95% of the soils in Wanshan are Se-adequate/rich areas, and
approximately 5% are Se-excessive soils (3.0 mg kg1) (Zhang
et al., 2012). However, the total Se content may not be a good in-dicator
of soil type. Previous studies have demonstrated that the
total Se contents in soils from some Keshan areas were equal to or
greater than those from non-endemic areas (Johnson et al., 2000),
which indicates that the total Se cannot represent all bio-available
soil Se.
Total Se in rice. Due to the high soil Se content, the average Se
content in rice in Wanshan (0.10 mg kg1) is three to four times
greater than that in China (0.032 mg kg1) (Wang, 1991); Guizhou
province (0.025 mg kg1) (Li et al., 2005), which includes the
Wanshan area; Zhoukoudian, Beijing (0.034 mg kg1) (Li et al.,
2007a); and the Yangtze River Delta (0.029 mg kg1) (Cao et al.,
2001). The rice Se in Wanshan is generally higher than the value
of 0.040e0.070mg kg1 recommended for agricultural products by
the Chinese Nutrition Society (Tan et al., 1982). It is comparable
with the rice Se for Se-rich regions, e.g., Rugao county, Jiangsu
(0.097 mg kg1) (Sun et al., 2008) and Kaiyang country, Guizhou
(0.081 mg kg1) (Li et al., 2005), and similar to the average global
rice Se content (0.095 mg kg1) (Williams et al., 2009). However,
the Se content in Wanshan rice (0.10 mg kg1) is approximately 27
times lower than that from the Enshi seleniferous region, a Se-excessive
area (2.73 mg kg1), although the corresponding soil Se
values in the two areas are comparable (2.1 and 6.5 mg kg1,
respectively) (Sun et al., 2010; Zhang et al., 2012). A simple estimate
of the translocation factors (TFs) for Se (grains/soil) demonstrates
that the average TF of the Se in Wanshan (0.047) is approximately
one-tenth of that in Enshi (0.42), suggesting that the bioavailability
of the Se in the Wanshan soils may be much lower than that in
Enshi.
Previous studies in the study area indicated that the correlation
between the total Se in rice grains and the total Se in soils is weak
(r2 ¼ 0.31, p 0.01, log-transformed) (Zhang et al., 2012), which
indicates that the total Se content in soil is not a good indicator of
the total Se absorbed in rice grains. Therefore, the total Se in soil
should not be used for environmental Se risk assessment. In addi-tion,
the pH values in the soils in the present study were positively
(r2 ¼ 0.25, p 0.05) correlated with the TFs of Se (grain/soil)
(Fig. 4b), although the correlation between the soil pH and grain Se
levels was poor (p 0.05) (Fig. 4c). These results indicate that high
soil pH may facilitate Se uptake by rice plants. In general, neutral-to-
alkaline soils might enhance the availability of Se more than
4 Fe/Mn/Al oxide-, amorphous material-,
hydrate- and carbonate-bound Se
(4.0 mol L1 HCl)
The tube containing the residual solids from (3) received 20 mL of 4 mol/L HCl and was heated in a water bath
at 95 C for 45 min, followed by centrifugation for 30 min. Afterwards, the extracted solution was removed
into a 50-mL PFA beaker, and 2 mL of 0.5 g/L FeCl3 was added and heated until slight ebullition (which was
maintained for 10 min). Once cooled, the solution was diluted to 25 mL with 4 mol/L HCl for final analysis.
5 Sulfide-bound (KClO3 þ HCl) The tube containing the residual solids from (4) was mixed with 0.5 g of KClO3. Next, 10 mL of 12 mol/L HCl
was added. After stirring for 45 min, the tube received 10 mL of Milli-Q water and was centrifuged for 30 min.
The extracted solution was transferred into a 50-mL PFA beaker, heated for 45 min at 50 C, and then diluted
to 25 mL with 4 mol/L HCl for final analysis.
6 Residual (HF þ HNO3 þ HClO4) The residual solids from (5) were removed into a PFA beaker containing 10 mL of 16 mol/L HNO3. Next, 5 mL
of HF and 2 mL of HClO4 were added, and the beaker was heated on an electric hotplate until the volume was
reduced to 1e2 mL. After cooling, the beaker received 18 mL of 6 mol/L HCl and 2 mL of 0.5 g/L FeCl3 and was
heated close to ebullition for 10 min. The solution was diluted to 25 mL with 4 mol/L HCl for final analysis.
6. 32 H. Zhang et al. / Environmental Pollution 188 (2014) 27e36
Fig. 3. Total Se concentrations and speciation of Se in the soil samples from the selected sites.
acidic soils. In neutral-to-acidic soils, Se is mainly present as sele-nite
(SeO3 2
), which has very low solubility and plant availability,
whereas in neutral-to-alkaline soils, Se is oxidized to selenate
(SeO4 2
), which is more soluble and better assimilated by crops than
selenite (Navarro-Alarcon and Lopez-Martinez, 2000). Further-more,
the organic matter content in the soils was negatively related
to both the TFs of Se (r2 ¼ 0.20, p 0.01, log-transformed; Fig. 4e)
and the grain Se levels (r2 ¼ 0.13, p 0.05, log-transformed; Fig. 4f),
which is easily attributed to greater association of Se with soil
organic matter being unfavorable for Se absorption by the plant
(see Section 3.2: Organic-bound Se for a more detailed discussion).
However, the weak relationship (r2 ¼ 0.13e0.31, all log-transformed)
between grain Se content (or Se TFs) and soil total
Se (or soil pH or organic matter) mentioned above further indicates
that the Se content in plant or agricultural products is not directly
dependent on the total Se content, pH and organic matter content
of the soils in which they are grown and may instead be dominated
by the bioavailable speciation of the soil Se.
3.2. Fractionation of the Se in soil
Water-soluble Se. The concentrations of different Se fractions
and the corresponding ratios to total Se in soils are shown in Figs. 2
and 3. The water-soluble Se content ranged from 0.0058 to
0.046 mg kg1, with an average of 0.019 0.011 mg kg1. Its pro-portion
of the total Se ranged from 0.45% to 2.70%, with an average
of 1.0% 0.6%. The water-soluble Se primarily included Se(VI), with
some Se(IV) and soluble organic Se (e.g., Se amino acids, proteins,
Fig. 4. Translocation factors (TFs) of Se (seed/soil) and Se in soil and seeds by OM (aec) and pH (dee) in the soil (total Se reported elsewhere (Zhang et al., 2012), soil pH and organic
matter content reported elsewhere (Zhang et al., 2010b)).
7. H. Zhang et al. / Environmental Pollution 188 (2014) 27e36 33
etc.). Water-soluble Se is the Se species most easily absorbed by
plants and, in agriculture, is considered bioavailable Se (Ge et al.,
2000; Olson and Moxon, 1939).
A multiple regression analysis (by IBM SPSS Statistics 21) of the
total Se in the rice grains (as the dependent variable) by total Se and
the corresponding six operationally defined Se fractions (i.e.,water-soluble
Se; ligand-exchangeable Se; organic-bound Se; Fe/Mn/Al
oxide-, amorphous material-, hydrate- and carbonate-bound Se;
sulfide-bound Se; and residual Se) in the soils (as independent
variables) was conducted. The adjusted R2 is 0.87, which indicates
that all seven variables together could predict the value of
approximately 87% of the total Se found in the rice. However, the
results indicate that among the seven variables, water-soluble Se is
the only factor significantly (p 0.01) controlling the total Se
content in the rice, with the ability to predict the value of
approximately 77% of the total Se found in the rice (r2 ¼ 0.81, or
adjusted r2 ¼ 0.77, p 0.01; Fig. 6a). These results indicate that,
compared with total Se and other Se fractions in soils, the water-soluble
Se in soils is very important in determining the Se levels
in rice and can be used as an efficient proxy to evaluate the
bioavailability of soil Se.
As shown in Table 1, the water-soluble Se content in Wanshan
mercury mining areas (0.019 mg kg1) is higher than that in many
other regions in China (e.g., 0.0095 mg kg1 in the Yangtze River
Delta, 0.0023 mg kg1 in Rugao, Jiangsu, and 0.0033 mg kg1 in
Heilongjiang) and comparable with that in Kiayang, Guizhou
(0.013 mg kg1) and Beijing (0.039 mg kg1). However, the water-soluble
Se content inWanshan (0.019 mg kg1) is approximately 18
times less than that in Enshi seleniferous areas (3.54 mg kg1),
although the total Se content in the soils from Wanshan is com-parable
to those in the Enshi areas. The water-soluble Se, which
represents the bioavailable species, can clearly aid in understand-ing
the elevated total Se content in soils and the reduced total Se in
rice grains inWanshan compared with those in Enshi. Furthermore,
the measures taken to prevent Keshan disease and KashineBeck
disease and related studies on the formation of the “Se-deficiency
belt” in China have confirmed that bioavailable Se is primarily
represented by water-soluble Se (Tan, 1989; Tan, 1996; Tan et al.,
1982; Tan et al., 2002). Therefore, water-soluble Se is a key factor
Fig. 5. Relationship between total Se concentration in soil (Zhang et al., 2012) and
distance from mine-waste calcines.
Fig. 6. Relationship between total Se in rice and Se species in soil.
8. 34 H. Zhang et al. / Environmental Pollution 188 (2014) 27e36
in determining the nutrients levels of Se in the local food chain. In
addition to total Se, water-soluble Se can also be used for soil Se
classification in terms of environmental risk assessment. Previous
studies have indicated that the background thresholds of soil Se for
Keshan disease or KashineBeck disease in endemic and non-endemic
areas are 0.11 mg kg1 for total Se and 0.0024 mg kg1
for water-soluble Se (Wei et al., 1991), providing a more reasonable
scientific basis for Se endemic research.
Ligand-exchangeable Se. The average (range) of the ligand-exchangeable
Se content was 0.032 0.027 (0.0062e0.096)
3 mg kg2
1, and the corresponding ratio to the total Se in the soils was
1.83 1.02% (0.53e4.64%) (Figs. 2 and 3). Ligand-exchangeable Se
primarily refers to the tetravalent selenite ion (SeO) associated
with hydrous oxides and surface adsorption by clay and humus.
Loss of this Se species due to leaching primarily occurs through
ligand exchange or anion competition (Zhang et al.,1997). Although
much less bioavailable than selenate, selenite can also be absorbed
by plants (depending on soil conditions). However, in the present
study, no significant correlation was observed between the ligand-exchangeable
Se content and total Se content in rice grains
(p 0.05; Fig. 6b), suggesting that the total Se in rice grains is not
dominated by ligand-exchangeable Se in the soil.
Organic-bound Se. The average (range) of organic-bound Se
and the corresponding ratio to the total Se in the soils were
0.46 0.43 (0.13e1.78) mg kg1 and 24% 6.36% (13.68e37.90%),
respectively (Figs. 2 and 3). Organic-bound Se primarily originates
from plant decomposition, with a small contribution from rainfall.
Se is a pro-biological element that exists and bio-accumulates as
organic compounds in plants or organisms (Fang et al., 2009; Li
et al., 2010; Mar et al., 2009). In soil organic matter, especially in
soils in which Se-rich plants are grown, Se-enriched organic resi-dues
remain in the soil after the plant decays. Organic Se primarily
occurs in soil humus (humic acid and fulvic acid). Humic acid is a
polymer with a stable structure; thus, plants have difficulty
absorbing the Se bound by humic acid (Ge et al., 2000). In com-parison,
the structure of fulvic acid is relatively simple, and the
fulvic-acid-bound Se can be easily mineralized and decomposed
into inorganic forms and low-molecular-weight organic com-pounds,
such as Se amino acids, for easy absorption by plants (Ge
et al., 2000). In the present study, a positive correlation
(r2 ¼ 0.35, p 0.05) was observed between the organic-bound Se
and the total Se in rice grains (Fig. 6c). This correlation, however,
may be only an indirect reflection of a co-variation between the
water-soluble Se and the organic-bound Se (Fig. 3), as a negative
correlation was observed between the translocation factors of Se
(grain/soil) and the organic matter content in the soils (r2 ¼ 0.20,
p 0.01, log-transformed; Fig. 4e), suggesting that an increase in
soil organic matter may inhibit the uptake of Se by a rice plant due
to the strong binding affinity of Se by humic acid in the organic
matter. Typically, 85e90% of the soil organic matter is humic acid
substance (Ge et al., 2000).
Fe/Mn/Al oxide-, amorphous material-, hydrate- and
carbonate-bound Se. The average (range) of the Fe/Mn/Al oxide-,
amorphous material-, hydrate- and carbonate-bound Se content
was 0.049 0.017 (0.026e0.084) mg kg1, and its corresponding
ratio to total Se in the soil was 3.9 3.2% (0.8e14%) (Figs. 2 and 3).
The Fe/Mn/Al oxide-, amorphous material-, hydrate- and
carbonate-bound Se in the present study primarily refers to the Se
fraction bound with Fe/Mn/Al oxides, amorphous materials, hy-drate
and carbonates, which is difficult for plants to take up and is
thus easily lost into solution due to mineral decomposition (Ge
et al., 2000). This phenomenon is reflected in the poor correlation
(p 0.05; Fig. 6d) found between the soil Fe/Mn/Al oxide-, amor-phous
material-, hydrate- and carbonate-bound Se content and the
grain Se content.
Sulfide-bound Se. The average (range) of the sulfide-bound Se
content in soils was 1.21 1.82 (0.21e7.72) mg kg1, and its cor-responding
ratio to the total Se was 50.1 14.0% (19.7e75.5%)
(Figs. 2 and 3). The sulfide-bound Se is the dominant Se species in
the Wanshan soils. In a study from the Keshan disease belt of
Zhangjiakou in Hubei, China, which used methods similar to those
in the present study, the sulfide-bound Se generally accounted for
32% of the total Se in soil (Ge et al., 2000). Under reducing condi-tions,
sulfide is a stable mineral, although strong oxidizing condi-tions
enable decomposition via leaching. Therefore, under normal
circumstances, the sulfide-bound Se is not readily absorbed by
plants, as reflected in the poor correlation (p 0.05; Fig. 6e) found
between the sulfide-bound Se and the total Se in the rice grains.
Residual-bound Se. The average (range) of the residual Se
content in soils was 0.30 0.24 (0.011e0.79) mg kg1, and its
corresponding ratio to the total Se was 18.8 16.0% (1.5e63.3%)
(Figs. 2 and 3). No significant correlation (p 0.05; Fig. 6f) was
observed between the residual Se in the soils and the total Se in the
rice grains. Residual Se primarily occurs in silicate minerals (e.g.,
feldspar, quartz, mica, etc.) and cannot be easily damaged by acide
base reactions (Ge et al., 2000). Obviously, such forms of Se are
unavailable to plants.
3.3. Impact of Hg on Se bioavailability in paddy soil
Previous studies have overlooked the impact of Hg on the
biogeochemical properties of Se in ecosystems due to a preoccu-pation
with Hg (Zhang et al., 2010a, 2010b). Intuitively, the low
bioavailability of Se in Wanshan’s Hg-mining area is likely affected
by the high Hg levels in the soils, especially compared with those in
the Enshi seleniferous area, which has no known Hg contamination
(Sun et al., 2010; Zhang et al., 2012). The Hg content and the Hg
species and fractions in the paddy soils in the Wanshan area have
been reported in our previous studies (Lin et al., 2010; Zhang et al.,
2010b). The translocation of both inorganic Hg and organic Hg in
the soilerice system was observed to decrease with increasing soil
Se concentrations, which may be associated with the formation of
an HgeSe insoluble complex in the rhizospheres and/or roots, as
mentioned earlier (Zhang et al., 2012).
The inorganic Se species most frequently found in soils are
selenite and selenate. Selenate is more available for plant uptake
than selenite because selenate behaves largely as a non-absorbing
solute; however, solid-phase selenite can be strongly adsorbed by
soil (e.g., iron oxides/hydroxides), thus resulting in a reduced
availability in the soil solution (Li et al., 2010). Under highly reduced
paddy soil conditions with prolonged flooding (rice plants typically
grow in flooded paddy soils), selenate is expected to be reduced to
selenite, elemental Se or even selenideemetal complexes (Zhang
et al., 2012). Elemental Se and selenide with low availability for
plants are the most typical stable forms under flooded soil condi-tions
(Elrashidi et al., 1987). Similarly, mercuric chloride and mer-curic
hydroxide are likely to reduce to elemental Hg. Anaerobic
3 flooded paddies 4 are different 2
2
from aerobic bulk soil, which provides
enhanced microbial activity, lower pH and a release of carbon-rich
root exudates that can facilitate the reduction of SeO and SeO
into Se0 or Se2 (or Hg2þCl2 and Hg2þ[OH]2 into Hg0) (McNear et al.,
2012). Selenium has an exceptionally high binding affinity with Hg,
with a constant of 1045, which is one million times greater than the
binding affinity between sulfur and Hg (1039) for the production of
mercury sulfide (HgeS). Therefore, Se should readily bond with Hg
to form inert HgeSe precipitates (according to the equations
Hg0 þ Se0 / HgeSe and/or Hg2þ þ Se2 / HgeSe), which have
extremely low solubility product constants (1058e1065)
compared with those of HgeS precipitates (1052) (Björnberg et al.,
1988; Dyrssen and Wedborg, 1991). The extensive formation of
9. H. Zhang et al. / Environmental Pollution 188 (2014) 27e36 35
unavailable, inert, insoluble HgeSe precipitates due to Se’s
extremely high binding affinity for Hg could compromise the
availability of Se in the soil, thereby resulting in a low Se content in
local rice. In our previous study (Zhang et al., 2012), a positive
correlation was observed between Hg concentrations and Se con-centrations
in paddy soils (r2 ¼ 0.88, p 0.01; log-transformed) and
in rice roots (r2 ¼ 0.99, p 0.01; log-transformed) inWanshan, and
the latter showed a pattern similar to a 1:1 (Hg:Se) molar ratio,
indicating the formation of an HgeSe insoluble complex in the
rhizospheres and/or roots. The independent mineral form of mer-cury
selenide (HgSe) was discovered in Wanshan as early as forty
years ago (Bao, 1975; Zhang et al., 2012), as mentioned earlier.
Recently, studies using X-ray absorption near-edge structure
(XANES) analysis of marine mammals and seabirds by Arai et al.
(2004) have unambiguously confirmed the existence of inert,
insoluble HgeSe complexes, even in vivo. These results indicate that
the antagonistic effects of Hg exposure on Se may be a ubiquitous
phenomenon, although the mechanisms in mammals should be
different from those under natural environmental conditions, a
topic that requires further study. In addition, it has been revealed
that the risk considerations of Hg exposure or Se intake should take
into account the interactions between Hg and Se. More detailed
information on this issue can be found in our recently published
article (Zhang et al., 2014).
4. Conclusion
Elevated total Se content and lowwater-soluble Se content were
observed in the paddy soil in Wanshan mercury mining areas
relative to those in seleniferous regions with an equivalent soil Se
level. The leaching of Se-containing Hg-mining waste may be a
significant source of Se released into the local paddy soils. The Se
level in rice grain is significantly correlated with water-soluble Se,
suggesting that water-soluble Se may play an important role in Se
uptake by rice plants and that water-soluble Se can be used as an
important proxy for reflecting bioavailable Se in soils in high-Se
and high-Hg areas of Wanshan. The low bioavailable Se content
in paddy soil in Wanshan may be associated with the co-existing
high Hg content in the local soil. A possible mechanism explain-ing
the paradox of high soil Se content and low rice accumulation in
Wanshan likely involves the formation of inert and insoluble HgSe
precipitates in paddy soil due to the extremely high binding affinity
between Se and Hg.
Acknowledgments
This work was financed by the “973” Program (2013CB430003)
and the Natural Science Foundation of China (41203092 and
41373135) and partly supported by funds from the Youth Innova-tion
Promotion Association of the Chinese Academy of Sciences.
References
Afton, S.E., Caruso, J.A., 2009. The effect of Se antagonism on the metabolic fate of
Hg in Allium fistulosum. J. Anal. Atomic Spectrom. 24, 759e766.
Arai, T., Ikemoto, T., Hokura, A., Terada, Y., Kunito, T., Tanabe, S., Nakai, I., 2004.
Chemical forms of mercury and cadmium accumulated in marine mammals and
seabirds as determined by XAFS analysis. Environ. Sci. Technol. 38, 6468e6474.
Ban, L., Ding, Y.F., 1992. Distribution Patern of Selenium in Soils of Guangxi. Envi-ronmental
Monitoring of China, pp. 98e101.
Bao, Z., 1975. Discovery of tiemannite and its prospecting significance. Geol. Explor.
11, 35e37.
Björnberg, A., Håkanson, L., Lundbergh, K., 1988. A theory on the mechanisms
regulating the bioavailability of mercury in natural waters. Environ. Pollut. 49,
53e61.
Bujdos, M., Mulová, A., Kubová, J., Medved, J., 2005. Selenium fractionation and
speciation in rocks, soils, waters and plants in polluted surface mine environ-ment.
Environ. Geol. 47, 353e360.
Cao, Z.H., Wang, X.C., Yao, D.H., Zhang, X.L., Wong, M.H., 2001. Selenium
geochemistry of paddy soils in Yangtze River Delta. Environ. Int. 26, 335e339.
CNEMC, 1990. The China National Environmental Monitoring Center (CNEMC),
Background Concentrations of Elements in Soils of China. China Environmental
Science Press, Beijing.
CNS, 1990. Chinese nutrition society, recommended daily dietary nutrient supply.
Acta Nutr. Sin. 12, 1e9.
Combs, G.F., 2001. Selenium in global food systems. Br. J. Nutr. 85, 517e547.
Dyrssen, D., Wedborg, M., 1991. The sulfur-mercury system in nature waters. Water
Air Soil Pollut. 56, 507e519.
Elrashidi, M.A., Adriano, D.C., Workman, S.M., Lindsay, W.L., 1987. Chemical equi-libria
of selenium in soils: a theoretical development. Soil. Sci. 144.
Fang, Y., Zhang, Y.F., Catron, B., Chan, Q.L., Hu, Q.H., Caruso, J.A., 2009. Identification
of selenium compounds using HPLC-ICPMS and nano-ESI-MS in selenium-enriched
rice via foliar application. J. Anal. At. Spectrom. 24, 1657e1664.
Fordyce, F.M., 2013. Selenium deficiency and toxicity in the environment. In:
Selinus, O., et al. (Eds.), Essentials of Medical Geology, revised ed., pp. 375e416.
Fordyce, F.M., Zhang, G.D., Green, K., Liu, X.P., 2000. Soil, grain and water chemistry
in relation to human selenium-responsive diseases in Enshi District, China.
Appl. Geochem. 15, 117e132.
Ge, X.L., Li, J.X., Wan, G.J., Zhang, G.D., Zhang, Z., 2000. Study on characteristics of
selenium geochemical speciation in soil in Zhangjiakou Keshan disease area.
Rock Mineral Anal. 19, 254e258.
Horvat, M., Nolde, N., Fajon, V., Jereb, V., Logar, M., Lojen, S., Jacimovic, R., Falnoga, I.,
Liya, Q., Faganeli, J., Drobne, D., 2003. Total mercury, methylmercury and sele-nium
in mercury polluted areas in the province Guizhou, China. Sci. Total En-viron.
304, 231e256.
Johnson, C.C., Ge, X., Green, K.A., Liu, X., 2000. Selenium distribution in the local
environment of selected villages of the Keshan Disease belt, Zhangjiakou Dis-trict,
Hebei Province, People’s Republic of China. Appl. Geochem. 15, 385e401.
KDRG, 1979. Keshan Disease Research Group. Observations on effect of sodium
selenite in prevention of Keshan disease. Chin. Med. J. 92, 471e476.
Khan, M.A.K., Wang, F.Y., 2009. Mercury-selenium compounds and their toxico-logical
significance: toward a molecular understanding of the mercury-selenium
antagonism. Environ. Toxicol. Chem. 28, 1567e1577.
Li, H.-F., Lombi, E., Stroud, J.L., McGrath, S.P., Zhao, F.-J., 2010. Selenium speciation in
soil and rice: influence of water management and Se fertilization. J. Agric. Food
Chem. 58, 11837e11843.
Li, J., Long, J., Wang, J.R., 2005. Se content of paddy soil in the middle region of
Guizhou Province and its effect on Se content of rice. Chin. J. Soil. Sci. 36, 571e
574.
Li, N., Gao, Z.D., Luo, D.G., Tang, X., Chen, D.F., Hu, Y.H., 2007a. Selenium level in the
environment and the population of Zhoukoudian area, Beijing, China. Sci. Total
Environ. 381, 105e111.
Li, Y.G., Dong, Y.X., Zheng, J., Xie, H.S., Song, M.Y., 2007b. The transport and trans-ormation
of selenium in the soil-paddy plant system affected by geological
factors. Geophys. Geochem. Explor. 31, 77e80.
Li, Y.-F., Dong, Z., Chen, C., Li, B., Gao, Y., Qu, L., Wang, T., Fu, X., Zhao, Y., Chai, Z.,
2012. Organic selenium supplementation increases mercury excretion and de-creases
oxidative damage in long-term mercury-exposed residents from
Wanshan, China. Environ. Sci. Technol. 46, 11313e11318.
Lin, Y., Larssen, T., Vogt, R.D., Feng, X., 2010. Identification of fractions of mercury in
water, soil and sediment from a typical Hg mining area in Wanshan, Guizhou
province, China. Appl. Geochem. 25, 60e68.
Mar, J.L.G., Reyes, L.H., Rahman, G.A.M., Kingston, H.M.S., 2009. Simultaneous
extraction of arsenic and selenium species from rice products by microwave-assisted
enzymatic extraction and analysis by ion chromatography-inductively
coupled plasma-mass spectrometry. J. Agric. Food Chem. 57,
3005e3013.
McNear, D.H., Afton, S.E., Caruso, J.A., 2012. Exploring the structural basis for sele-nium/
mercury antagonism in Allium fistulosum. Metallomics 4, 267e276.
Mounicou, S., Shah, M., Meija, J., Caruso, J.A., Vonderheide, A.P., Shann, J., 2006a.
Localization and speciation of selenium and mercury in Brassica juncea e im-plications
for Se-Hg antagonism. J. Anal. Atomic Spectrom. 21, 404e412.
Mounicou, S., Vonderheide, A.P., Shann, J.R., Caruso, J.A., 2006b. Comparing a se-lenium
accumulator plant (Brassica juncea) to a nonaccumulator plant (Heli-anthus
annuus) to investigate selenium-containing proteins. Anal. Bioanal.
Chem. 386, 1367e1378.
Navarro-Alarcon, M., Cabrera-Vique, C., 2008. Selenium in food and the human
body: a review. Sci. Total Environ. 400, 115e141.
Navarro-Alarcon,M., Lopez-Martinez, M.C., 2000. Essentialityof seleniuminthe human
body: relationship with different diseases. Sci. Total Environ. 249, 347e371.
Nazemi, L., Nazmara, S., Eshraghyan, M.R., Nasseri, S., Djafarian, K., Yunesian, M.,
Sereshti, H., Moameni, A., Shahtaheri, S.J., 2012. Selenium status in soil, water
and essential crops of Iran. Iran. J. Environ. Health Sci. Eng. 9, 11.
Olson, O.E., Moxon, L., 1939. The availability, to crop plants, of different forms of
selenium in the soil. Soil. Sci. 47, 305e311.
Rayman, M.P., 2012. Selenium and human health. Lancet 379, 1256e1268.
Rayman, M.P., Infante, H.G., Sargent, M., 2008. Food-chain selenium and human
health: spotlight on speciation. Br. J. Nutr. 100, 238e253.
Reeves, M.A., Hoffmann, P.R., 2009. The human selenoproteome: recent insights
into functions and regulation. Cell. Mol. Life Sci. 66, 2457e2478.
Shacklette, H.T., Boerngen, J.G., 1984. Element Concentrations in Soils and Other
Surficial Materials of the Conterminous United States. U.S. Geological Survey
Professional Paper 1270. U.S. Government Printing Office, Washington, DC.
10. 36 H. Zhang et al. / Environmental Pollution 188 (2014) 27e36
Shao, G.Z., Guan, G.W., 1993. Soil Selenium Background Values and Endemic Dis-eases
in Heilongjiang, China. Environmental Monitoring of China, pp. 61e62.
Sun, G.-X., Lu, X., Williams, P.N., Zhu, Y.-G., 2010. Distribution and translocation of
selenium from soil to grain and its speciation in paddy Rice (Oryza sativa L.).
Environ. Sci. Technol. 44, 6706e6711.
Sun, W., Biao, X.H.,, Zhao, Y.C., Shi, X.Z., Darilek, J.L., Deng, X.H., Wang, H.J., Zou, Z.,
2008. Spatial variability of soil selenium as affected by geologic and pedogenic
processes and its effect on ecosystem and human health. Geochem. J. 43, 217e
225.
Swaine, D.J., 1995. The Trace Element Content in Soil. Commonwealth Agricultural
Bureau, e Technical Communication of the Commonwealth Bureau of Soil
Science, [Farnham Royal], England, pp. 134e141.
Tan, H., He, J.L., Liang, L., Lazoff, S., Sommer, J., Xiao, Z.F., Lindqvist, O., 2000. At-mospheric
Mercury Deposition in Guizhou, China. Elsevier Science Bv, pp. 223e
230.
Tan, J.A., 1989. The Atlas of Endemic Diseases and Their Environments in the Peo-ple’s
Republic of China. Science Press, Beijing.
Tan, J.A., 1996. Chronic Keshan Disease and Environmental Elements of Life. Chinese
Medicine Science and Technology Press, Beijing.
Tan, J.A., Zheng, D.X., Hou, S.F., Zhu, W.Y., Li, R.B., Zhu, Z.Y., Wang, M.Y., Wang, W.Y.,
Zhao, N.Q., Li, D.Z., Lu, Y.L., Wang, L.Z., Zhu, Z.Y., 1982. The relation of Keshan
disease to the natural environment and the background of selenium nutrition.
Acta Nutr. Sin. 4, 175e180.
Tan, J.A., Zhu, W.Y., Wang, W.Y., Li, R.B., Hou, S.F., Wang, D.C., Yang, L.S., 2002.
Selenium in soil and endemic diseases in China. Sci. Total Environ. 284, 227e
235.
Wang, G., Jiang, J., Zhu, X., 2008. Study on the background level of selenium in soils
and its sources, Guizhou Province. Chin. J. Geochem. 27, 178e182.
Wang, G.Y., 1991. China Food Composition (National Representative Value). People’s
Health Publishing House, Beijing.
Wei, F.S., Chen, J.S., Wu, Y.Y., Zheng, C.J., 1991. Study on the background contents on
61 elements of soils in China. Environ. Sci. 12, 12e19.
Williams, P.N., Lombi, E., Sun, G.-X., Scheckel, K., Zhu, Y.-G., Feng, X., Zhu, J.,
Carey, A.-M., Adomako, E., Lawgali, Y., Deacon, C., Meharg, A.A., 2009. Selenium
characterization in the global rice supply chain. Environ. Sci. Technol. 43, 6024e
6030.
Wu, S.X., Gong, Z.T., Huang, B., 1997. Water-soluble selenium in main soil types of
China and in relation to some soil properties. China Environ. Sci. 17, 522e525.
Xu, W., Tang, W.H., Kuang, C.N., Luo, G.Q., 2010. Selenium content and impact fac-tors
of soils of Hainan province. J. Anhui Agric. Sci. 38, 3026e3027.
Yang, G.Q., Wang, S.Z., Zhou, R.H., Sun, S.Z., 1983. Endemic selenium intoxication of
humans in China. Am. J. Clin. Nutr. 37, 872e881.
Yathavakilla, S.K.V., Caruso, J.A., 2007. A study of Se-Hg antagonism in Glycine max
(soybean) roots by size exclusion and reversed phase HPLC-ICPMS. Anal. Bio-anal.
Chem. 389, 715e723.
Zhang, H., Feng, X., Larssen, T., Qiu, G., Vogt, R.D., 2010a. In Inland China, rice, rather
than fish, is the major pathway for methylmercury exposure. Environ. Health
Perspect. 118, 1183e1188.
Zhang, H., Feng, X., Larssen, T., Shang, L., Li, P., 2010b. Bioaccumulation of methyl-mercury
versus inorganic mercury in Rice (Oryza sativa L.) grain. Environ. Sci.
Technol. 44, 4499e4504.
Zhang, H., Feng, X., Zhu, J., Sapkota, A., Meng, B., Yao, H., Qin, H., Larssen, T., 2012.
Selenium in soil inhibits mercury uptake and translocation in Rice (Oryza sativa
L.). Environ. Sci. Technol. 46, 10040e10046.
Zhang, H., Feng, X.B., Chan, H.M., Larssen, T., 2014. New insights into traditional
health risk assessments of mercury exposure: implications of selenium. Envi-ron.
Sci. Technol. 48, 1206e1212.
Zhang, H.B., Luo, Y.M., Wu, L.H., Zhang, G.L., Zhao, Q.G., Huang, M.H., 2005. Hong
Kong soil research II: soil selenium content, distribution and influencing factors.
Acta Pedol. Sin. 42, 404e410.
Zhang, H.H., Wu, Z.F., Yang, C.L., Xia, B., Xu, D.R., Yuan, H.X., 2008. Spatial distri-butions
and potential risk analysis of total soil selenium in Guangdong prov-ince,
China. J. Environ. Qual. 37, 780e787.
Zhang, Z., Zhou, L.Y., Zhang, Q., 1997. Speciation of selenium in geochemical samples
by partial dissolution technique. Rock Mineral Anal. 16, 255e261.
Zhao, J., Gao, Y., Li, Y.-F., Hu, Y., Peng, X., Dong, Y., Li, B., Chen, C., Chai, Z., 2013a.
Selenium inhibits the phytotoxicity of mercury in garlic (Allium sativum). En-viron.
Res. 125, 75e81.
Zhao, J., Hu, Y., Gao, Y., Li, Y., Li, B., Dong, Y., Chai, Z., 2013b. Mercury modulates
selenium activity via altering its accumulation and speciation in garlic (Allium
sativum). Metallomics 5, 896e903.
Zhu, C.F., Jia, S.C., 1991. An investigation of soil selenium background value in Gansu
Province. Environ. Study Monit. 14, 4e7.
Zhu, J.M., Wang, N., Li, S., Li, L., Su, H., Liu, C.X., 2008. Distribution and transport of
selenium in Yutangba, China: impact of human activities. Sci. Total Environ.
392, 252e261.