DEV meet-up UiPath Document Understanding May 7 2024 Amsterdam
Prioritization Routine for Digital and Visual Magnetic Anomaly Evaluation - FastTimes Special Issue: Unexploded Ordnance
1. Feature
PRIORITIZATION ROUTINE FOR DIGITAL AND VISUAL MAGNETIC
ANOMALY EVALUATION
by Ryan S. Steigerwalt
Weston Solutions, Inc.
West Chester, PA
Introduction various grids across the project site. Review-
Digital geophysical mapping (DGM) ing dig results is a costly and time-consuming
surveys have become a fundamental element endeavor that requires prompt and consistent
in clean-up efforts on project sites contami- attention to maintain schedules.
nated with munitions and explosives of concern To reduce QC time during the dig phase,
(MEC), particularly unexploded ordnance (UXO) an anomaly prioritization scheme has been
in the United States and abroad. DGM surveys developed for implementation on MEC/DGM
must maintain strict project planning guide- project sites. A number rank is assigned to
lines, data processing and analysis metrics, each selected anomaly using a combination
documentation, and quality assurance/quality of characteristics and factors ranging from
control (QA/QC) procedures to determine if response amplitude to spatial size. The rank is
quality goals are being met to achieve project also included in the target list provided to the
objectives. Typically MEC/DGM projects include dig teams for initiation of QC checks on the
two primary elements, the initial DGM phase DGM data in the field during target evaluation.
and the secondary follow-up dig phase. If not Issues pertaining to fit quality between source
carefully managed, segregation of these tasks and anomaly characteristics can often be recti-
may preclude a seamless transition between the fied in the field or easily identified based on
technical and non-technical phases of the MEC anomaly rank during the post-dig review. The
project. following sections document the procedure
During the initial MEC project planning and advantage of ranking anomalies during the
stages, goals and objectives are often techni- initial target selection process.
cally oriented and focused on the DGM outcome.
Geophysicists and engineers from industry and Digital Geophysical Mapping
regulatory agencies provide technical oversight Total field magnetometry (TFM) and
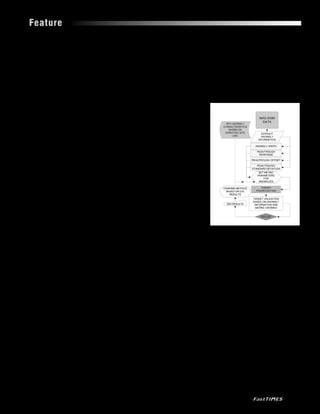
and scientific reasoning to determine the best- electromagnetic induction (EMI) applications Figure 1: Flow diagram displaying the prioritization
fit geophysical application for the presented are commonly used for buried UXO detection. process for magnetic anomalies. Characteristics
circumstance and subsequently follow through EMI methods are frequently chosen over TFM,
by scrutinizing every aspect of the DGM inves- predominately due to ease of interpretation from each selected anomaly are extracted and as-
tigation. Topics for technical discussion during and less susceptibility to geologic and cultural sembled for review and dig list generation.
planning kick-off meetings and QA/QC review background. Results from processed EMI data
stages include data acquisition and survey de- show anomaly characteristics that are closely
sign, geophysical data collection and navigation related to the geometry and location of its sen amplitude. Since TFM data displays positive
systems, and signal processing steps, each of source. Similarly, TFM data display anomaly and negative values depending on the source
which is a critical asset to the DGM process. characteristics related to the buried source, geometry, size and orientation relative to the
Transition between the DGM and dig however delineating source boundaries and geomagnetic field at the site, the analytic signal
phases begins with the selection of anomalies location can be more challenging, due to the is calculated to better estimate source location.
from the digitally recorded geophysical data ubiquitous dipolar response for ferrous objects. The analytic signal provides results needed
and transferring those selections to target lists Each geophysical method has well docu- for most target selection routines, which require
composed of all selected anomalies and their mented advantages and disadvantages ranging positive values and a specified threshold. The
respective locations. The target lists are provided from detection capabilities to geologic and values obtained by calculating the analytic
to dig teams composed of UXO Technicians cultural interference aversion (Butler, 2004). signal, however, may not provide results suitable
who reacquire the selected anomaly locations The prioritization scheme presented below was for discrimination or source characterization.
and manually excavate and evaluate the suspect developed for TFM data collected at multiple On sites with significant amounts of clutter, the
source of the geophysical anomaly. The UXO sites where cultural interference from utility response of small clutter items may produce
Technicians log the physical characteristics of assets both above and below ground is the analytic signals that exceed the established
any materials identified during the evaluation and largest contributor to noise. These interferenc- threshold. In these instances a large percentage
move on to the next listed target. As dig results es, which have been known to hinder detection of selected anomalies result in the excavation
are compiled, a geophysicist compares physical capabilities, can generally affect EMI data more of small buried debris or clutter, not intact UXO.
characteristics of the excavated items back to than TFM data at most locations. The presence of unwanted clutter or false alarms
the processed geophysical data. This QC step is in the compiled dig list decreases the effective-
crucial to each MEC/DGM project to ensure the Target Selection ness of the DGM survey. As a result, project
item is proportional to anomaly characteristics Anomalies are frequently selected based on costs can be significantly increased, with added
therefore achieving data quality goals. Manag- peak response amplitude determined following time needed for target reacquisition and dig
ing this task and the voluminous flow of data initial data processing procedures (Billings et evaluation of false alarm anomalies (Butler et al.,
can become daunting, as dig results flood in al., 2002). A threshold is established to only 2004).
daily from multiple dig teams located in several include those anomalies at or above the cho-
www.eegs.org Summer 2005 31
2. Anomaly Prioritization are then summed together to generate the prior- line defense against QA/QC issues related to the
To reduce the false alarm rate (FAR), an ity rank for the individual targeted anomaly (see DGM process.
anomaly selection routine was developed that Figure 3). The anomaly priority rank allows the dig
assigns a priority rank classification to each team to make in-field decisions regarding the
target selection on the final dig list. TFM data Rank Implementation discovery and validation of false positives,
is initially assembled and processed according The prioritization scheme discussed above magnetic rocks, and MEC intermixed with clutter.
to data quality objectives established during provides a three-fold approach for the transition A typical target selection that displays charac-
the project planning stage. Once anomalies are and closer integration between the DGM and dig teristics of potential UXO would display a high
identified and targeted for dig reacquisition, data phases. First, the process provides a means for priority rank. An item identified other than UXO
is extracted using a pre-specified search radius anomaly selection other than thresholding. Sec- or equivalent magnetic material at this loca-
or halo about each anomaly location and com- ond, anomaly characteristics are documented tion would initiate further QC procedures, either
piled to a central database referenced by target so quality control procedures can be performed visually at the dig location or digitally by the
identification. Figure 1 displays the processing both visually in the field and digitally with processing geophysicist.
flow system used for the anomaly prioritization increased efficiency. Finally, combining both
routine. Information including anomaly width digital quantitative and visual qualitative anomaly Discussion
(distance of anomalous responses along the characteristics has potential to significantly The use of a priority ranking process pro-
survey pathway), response amplitude (both peak reduce the FAR. vides a means to group similar anomalies based
and trough for dipole anomalies), anomaly offset Once the priority rank is established, a dig on multiple characteristics. Anomaly groups can
(distance relationship between target selection list can be prepared that is dictated by project then be filtered from target lists as dig informa-
location and both anomaly peak and trough), and type, objectives and goals. The number of anom- tion is interpreted and reviewed by all parties.
standard deviation between the peak and trough alies selected for excavation can be derived from Groups can also be revisited at any time if atypi-
response (statistical approach to determine the priority rank to meet specific requirements. cal MEC/UXO are discovered in lower prioritiza-
deviation from mean background noise levels) Initially a conservative range of priority ranks will tion ranks. The prioritization process does not
are extracted for each target (Figure 2). Each require selection to build a robust library of dig rely heavily on any single anomaly characteristic
of these characteristics is assigned a quantifier information. As the dig information is analyzed, and is therefore less susceptible to general data
established from known and historical informa- the number of priority ranks may be decreased if quality deficiencies inherent to data acquisition.
tion on buried UXO expected on site. all identified MEC falls within an obvious range. The anomaly priority ranking process for
Metrics are assigned for each characteristic Those anomalies listing priority ranks within digital anomaly selection and in-field target
and are determined from geophysical prove-out that range are then transposed to a target list evaluation provides a more quantifiable means to
(GPO) data and on-going dig information col- provided to the dig teams. determine the most suitable anomalies requir-
lected at the project site. During digital anomaly An instructional briefing prior to the dig ing further investigation on MEC projects. The
evaluation, if the specific characteristic meets phase should be performed to describe the pri- use of anomaly shape properties is also being
the assigned metric, a quantifier of one (1) is oritization routine and excavation and evaluation used to discriminate UXO from shrapnel and
allocated for that characteristic. Conversely, if objectives to each UXO Technician. The briefing clutter (Pasion et al., 2004). Magnetic inversion
the characteristic fails to compare to anomalies should include discussion of items anticipated to techniques have been demonstrated and imple-
representative of buried UXO, a quantifier of zero be found relative to the DGM data and assigned mented on live UXO sites with noted success
(0) is assigned for that metric. The quantifiers anomaly rank. This initial evaluation is the first of reducing the FAR in addition to diminishing
32 Summer 2005 www.eegs.org
3. total number of digs (Billings et al., 2002). Conclusion
However, where data may become ambiguous DGM quality and effectiveness can be signifi-
due to changing data quality issues associated cantly improved by a seamless transition to the
to diverse site conditions, increased noise, or MEC project dig phase. Data quality questions
the addition of slight navigation inaccuracies, the account for a majority of issues recognized by
inversion process may be limited to less than its project stakeholders. To begin reducing un-
intended resolution (Butler et al., 2004). In this necessary data quality hesitancy from reviewers,
situation, additional anomalies may need to be QA/QC procedures should be initiated immedi-
validated to provide a statistical model to resolve ately at project startup. The use of an anomaly
any shortcomings from reviewers. priority-ranking scheme standardizes and closely
Employing the priority ranking routine integrates the DGM and anomaly evaluation
on MEC project sites has reduced the FAR and QA/QC review process.
increased the confidence levels of regulators. Assigning priority ranks to anomalies
A case history from a military housing area creates an efficient means of identifying data
revealed an approximate 30% decrease in false quality issues real-time in the field or digitally
alarms by using the anomaly ranking system. All during the post-dig geophysical data compari-
detected MEC (primarily 60mm training mortars) son. The feedback gained from data analysis aids
was isolated in the upper tier ranks where 100% in interpretation and refines the ranking scheme
of those anomalies were selected and evaluated where total selected anomalies and the FAR can
by dig teams. As a quality control check, 10% of be significantly decreased. The value added in
anomalies listed as lower tier ranks were evalu- MEC/DGM projects may be increased as data
ated to continually test the routine and to provide quality objectives are satisfied and time and
Figure 2: Physical characteristics extracted
additional statistical and dig results for smaller effort in achieving project goals is reduced.
features. In addition to the reduction of total dig for the anomaly prioritization scheme from
numbers, the priority rank decreased dig evalu- References a magnetic dipole anomaly. Figure displays
ation time by providing a qualitative prediction Billings, S.D., J.M. Stanley, and C. Youmans, 2002, map and profile views.
of the anomaly source to the UXO Technicians. Magnetic discrimination that will satisfy regulators:
Once the source item is evaluated and charac- Proceedings from the UXO/Countermine Forum 2002, Butler, D.K., 2004, A workshop on electromagnetic
teristics logged, the Technicians can make a Orlando, FL, September 3-6 2002. induction methods for UXO detection and discrimina-
quantitative judgment to determine if the hole Butler, D.K., D.E. Yule, and H.H. Bennett, 2004, tion: Fast Times: 9, No: 1, 9-15.
was successfully cleared and the pre-determined Employing multiple geophysical sensor systems to Pasion, L.R., S.D. Billings, L. Beran, D.D. Oldenburg,
quality guidelines have been met. enhance buried UXO “target recognition” capability: and R.E. North, 2004, Joint and Cooperative Inversion
Proceedings from the 24th Army Science Conference, of Electromagnetic and Magnetics Data for the Char-
Orlando, FL, November 29-December 2, 2004. acterization of UXO: Proceedings of the UXO/Counter-
mine Forum 2004, St. Louis, MO, March 9-12, 2004.
Figure 3: Example target table, displaying the prioritization ranking process and dig results.
www.eegs.org Summer 2005 33