Axa Assurance Maroc - Insurer Innovation Award 2024
129966863283913778[1]
1. Robust Speech Features Based on LPC
Using Weighted Arcsin Transform
Wei-Wen Hung
Department of Electrical Engineering
Ming-Chi Institute of Technology
84 Gungjuan Road, Taishan, Taipei, Taiwan, 24306, Republic of China
E-mail : wwhung@ccsun.mit.edu.tw
FAX : 886-02-2906-1780
Tel. : 886-02-2906-0379
Reference No. : 2002EDL8047
Paper/Letter : Letter
Issue : ED
Regular/Special : Regular
Title of Special Issue :
Title of Manuscript: Robust Speech Features Based on LPC Using Weighted
Arcsin Transform
Date of Evaluation : October 09, 2002.
Submission Due Date : January 09, 2003.
2. Robust Speech Features Based on LPC
Using Weighted Arcsin Transform
Wei-Wen Hung
Department of Electrical Engineering, Ming-Chi Institute of Technology
Abstract – To increase the discriminating ability of the speech feature based on linear
predictive coding (LPC) and increase its noise robustness, an SNR-dependent arcsin transform
is applied to the autocorrelation sequence (ACS) of each analysis frame in a speech signal.
Moreover, each component in the ACS is also weighted by the normalized reciprocal of the
average magnitude difference function (AMDF) for emphasizing its peak structure.
Experimental results for the task of Mandarin digit recognition indicate that the LPC speech
feature employing the proposed scheme is more robust than some widely used LPC-based
approaches over a wide range of SNR values.
Index Terms – SNR-dependent arcsin transform, Linear predictive coding, Autocorrelation
sequence, Average magnitude difference function.
This research has been partially sponsored by the National Science Council, Taiwan, ROC,
under contract number NSC-90-2213-E-131-001.
3. LIST OF FIGURES AND TABLES
Fig. 1. The log LPC spectra of Mandarin utterance “1” for clean speech with various conditions.
(A) The case without WAT scheme (baseline case).
(B) The case with WAT scheme.
(δmin .= 0 0 , δmax .= 1 0 , SNR dBLB = 20 , SNR dBUB = 30 .)
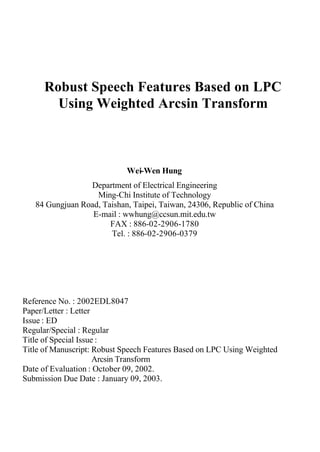
Fig. 2. The 20-dB factory noise distorted log LPC spectra of Mandarin utterance “1” with various
conditions.
(A) The case without WAT scheme (baseline case).
(B) The case with WAT scheme.
(δmin .= 0 0 , δmax .= 1 0 , SNR dBLB = 10 , SNR dBUB = 40 .)
Fig. 3. The two log LPC spectra (without WAT and with WAT) of the 6-th frame for clean Mandarin
utterance “1”(δmin .= 0 0 , δmax .= 1 0 , SNR dBLB = 20 , SNR dBUB = 30 .).
Fig. 4. The two log LPC spectra (without WAT and with WAT) of the 6-th frame for 20-dB
factory-distorted Mandarin utterance “1” ( δmin .= 0 0 , δmax .= 1 0 , SNR dBLB = 10 ,
SNR dBUB = 40 .).
TABLE I. COMPARISONS OF DIGIT RECOGNITION RATES FOR VARIOUS SCHEMES
UNDER WHITE NOISE DISTORTION.
(δmin .= 0 0 , δmax .= 1 0 , SNR dBLB = 20 , SNR dBUB = 30 .)
TABLE II. COMPARISONS OF DIGIT RECOGNITION RATES FOR VARIOUS SCHEMES
UNDER FACTORY NOISE DISTORTION.
(δmin .= 0 0 , δmax .= 1 0 , SNR dBLB = 10 , SNR dBUB = 40 .)
4. I. INTRODUCTION
Linear predictive coding (LPC) is a widely used spectral estimation technique for speech signal
processing. The LPC analysis scheme performs spectral analysis on a speech frame with an all-pole
modeling constraint. This implies that the resulting spectral representation )( jw
eX is constrained to be
of the form )( jw
eAσ , where )( jw
eA is an th
m order polynomial with z -transform
m
m zazazazA −−−
⋅+⋅⋅⋅+⋅+⋅+= 2
2
1
11)( . (1)
The order m is called the LPC analysis order. Thus the output of the LPC spectral analysis for a
speech frame is a vector of coefficients that specify the spectrum of an all-pole model that best matches
the speech spectrum over the period of time in which the samples of a speech frame are considered. In
the autocorrelation domain, Mansour and Juang [1] showed that for both voiced and unvoiced cases, the
all-pole LPC model parameters can be more reliably estimated from the AR model )(22 jw
eAσ than
from the conventional model )( jw
eAσ in a noisy environment. The robustness of the proposed
scheme is achieved by exploiting the coherence between two adjacent speech frames and is thus called
the short-time modified coherence (SMC) representation. Whereas the SMC representation is computed
using a square root spectral shaper, the OSALPC (one-sided autocorrelation LPC) representation
proposed by Hernando and Nadeu [2] is calculated from the causal part of the autocorrelation sequence
(ACS) using the conventional biased autocorrelation estimator. Many robust representations of speech
feature using linear prediction of the ACS have been proposed, however, a novel acoustic representation
that is more resistant to noise corruption is still desired. Accordingly, we shall introduce a new
LPC-based representation of speech feature for noisy speech recognition. In this new approach, we first
use an SNR-dependent arcsin function to adaptively transform the set of ACSs obtained from a speech
5. signal on a frame-by-frame basis. To further emphasize the peak structure of the ACSs, each component
in the transformed ACS is then weighted by the normalized reciprocal of the average magnitude
difference function (AMDF). As a result, a set of LPC-based cepstral features that are more robust to
environmental interference can be obtained for speech recognition.
II. LPC-BASED CEPSTRAL FEATURES USING WEIGHTED ARCSIN TRANSFORM
For a continuous density hidden Markov model (CDHMM), the output likelihood measure of
tht − frame in the testing utterance }1],,[{ yttt TtdcyY ≤≤== based on the statistics of thi −
state of the word model }1),,({)( ,,, wiwiwiw SiNw ≤≤Σ== µλλ can be characterized by a
multivariate Gaussian probability density function (pdf) and formulated as
−⋅Σ⋅−⋅−⋅Σ⋅
−
⋅= −
−
)()(
2
1
exp)2()(
,
1
,,
21
,, iwtiw
T
iwtiwiwt yy
p
yp µµπλ , (2)
where ],[ ,,, iwiwiw dc=µ denotes the mean vector of thi − state of the word model )(wλ and
consists of −p order cepstral vector iwc , and −p order delta cepstral vector iwd , . iw,Σ denotes
the covariance matrix of thi − state of the word model )(wλ and is simplified as a diagonal matrix,
i.e., )]2()2()1([ 2
,
2
,
2
,, pdiag iwiwiwiw ⋅⋅⋅⋅=Σ σσσ . In our approach, the mean vector
],[ ,,, iwiwiw dc=µ is indirectly represented by the normalized autocorrelation vectors of a five-frame
context window [3], that is ],,,,[ 2,,1,,0,,1,,2,, iwiwiwiwiw rrrrr −− , where
T
prrr jiwjiwjiw )](,),1([ ,,,,,, ⋅⋅⋅= ,
j =0 denotes the instantaneous frame, j =-1, -2 the left context frames and j =1, 2 the right context
frames. When the tht − frame ty of a testing utterance Y is evaluated on the state iw,λ , the
normalized autocorrelation sequence (NACS)
T
jtjtjt prrr )](,),1([ ,,, ⋅⋅⋅= are first calculated by
6. ∑
−
=
+⋅⋅=
1
0
,,, )()(
1
)(
N
n
jtjtjt nxnx
N
r ττ , for p≤≤ τ1 (3)
where )(, nx jt represents the speech segment associated with the context frame jty , , and N denotes
the number of speech samples. Then, each component in the NACS jtr, is transformed by means of the
weighted arcsin function [4][5]
[ ]{ }
[ ]{ }
,
)(10.1sin
)(1)(sin
]0.1)([
]0.1)([
)(~
,
1
,,
1
1
1
,
1
,
,
jt
jtjt
P
jt
jt
jt
SNR
SNRr
r
δ
δτ
αφ
τφ
τ
α
+
+
⋅
+
+
= −
−
=
−
−
∑
for 22 ≤≤− j and p≤≤ τ1 . (4)
In above equation, the smoothing factor )( , jtSNRδ is empirically formulated as
( )
>
≤≤+−⋅
−
−
<
=
UBjt
UBjtLBLBjt
LBUB
LBjt
jt
SNRSNRif
SNRSNRSNRifSNRSNR
SNRSNR
SNRSNRif
SNR
,max
,min,
minmax
,min
, ,)(
δ
δ
δδ
δ
δ (5)
and the jtSNR , value is determined by
},)({log10 10, nnjtjt EEESNR −⋅= + (6)
where tE is the energy of the tht − testing speech frame, nE the background noise energy and can
be roughly estimated by calculating the mean energy of the five frames with lowest energy in the testing
utterance Y . Moreover, )(, τφ jt specifies the average magnitude difference function (AMDF) that can
be expressed as
∑
−
=
+−⋅=
1
0
,,, )()(
1
)(
N
n
jtjtjt nxnx
N
ττφ . (7)
The weighted arcsin transform (WAT) scheme utilizes the fact that the segment of clean speech with less
energy (i.e., lower SNR value) is influenced most by ambient noises and thus requires heavily smoothing
(using smaller smoothing factor) to suppress its impact to the output likelihood measure. As to the clean
7. segment and the segment with high SNR value, larger smoothing factor is selected to preserve their
original spectral information. Besides performing arcsin transform along the temporal trajectory of the
NACS, each component in the NACS jtr, is also weighted by the normalized reciprocal of the AMDF
to emphasize its peak structure. Due to the characteristic that the noise components included in the ACS
and AMDF are uncorrelated each other [6], it is expected that the true peak is emphasized and as a
result the speech recognition accuracy is improved. Once the weighted normalized autocorrelation
sequence (WNACS) jtr,
~ , are obtained, the weighted testing cepstral vector jtc ,
~ of jty ,
~ can be
calculated by means of the LPC to cepstrum conversion formula. Moreover, the weighted version of the
testing delta cepstral vector td
~
can also be solved by
∑∑ −=−=
⋅=
2
2
2
2
2
,
~~
jj
jtt jcjd (8)
Thus, the weighted testing feature vector ]
~
,~[~
ttt dcy = can be taken as the term ]
~
,~[~
0,0, ttt dcy = .
Similarly, to avoid introducing mismatch between testing speech and reference models, the NACS
],,,,[ 2,,1,,0,,1,,2,, iwiwiwiwiw rrrrr −− of state iw,λ should be also transformed in the same manner described
above with the same smoothing factor )( , jtSNRδ . In addition, based on the maximum likelihood (ML)
principle, we can obtain the optimal weighted covariance matrix
~
,Σw i , i.e.,
( ) ( )
.
2
)()(
~
)(
~
)()(~)(~
~
,
2
1 1
,,
2
,,
, iw
p
m
p
m
iwiwtiwiwt
iw
p
mpmdmdmmcmc
Σ⋅
⋅
+−+−
=Σ
∑ ∑
= =
σσ
(9)
Finally, the resulting weighted output likelihood measure can be rewritten as
−⋅Σ⋅−⋅−⋅Σ⋅
−
⋅= −
−
)~~(
~
)~~(
2
1
exp
~
)2()
~~(~
,
1
,,
21
,, iwtiw
T
iwtiwiwt yy
p
yp µµπλ . (10)
8. III. EXPERIMENTS AND DISCUSSIONS
A task of multi-speaker isolated Mandarin digit recognition [5] was conducted to demonstrate the
effectiveness of the proposed scheme. There were three sessions of data collection from 50 male and 50
female speakers. For each session, a speaker uttered 10 Mandarin digits. Speech signals are sampled at
8 kHz. Each frame contains 256 samples with 128 samples overlapped, and is multiplied by a 256-point
Hamming window. The first two sessions were used for training the word models and the other for testing.
Each digit is modeled as a left-to-right HMM without jumps in which the output of each state is a
2-mixture Gaussian distribution of feature vectors. Each word model contains seven to nine states
including the pre-silence and post-silence states. Also, the feature vector consists of 12 LPC-derived
cepstral coefficients and 12 delta cepstral coefficients. A conventional hidden Markov model without
incorporating the WAT scheme is referred as a baseline for comparison. The factory noise extracted
from the NOISEX-92 noise database [7] was added to clean speech with predetermined SNRs at 20,
15, 10, 5 and 0 dB to generate various noisy speech signals. Moreover, the parameters used in the
proposed WAT scheme under different noisy conditions are determined empirically as follows. Firstly,
the smoothing factor δ is initially set to 0 and increased with increment ∆δ = 0 1. while SNRLB
and SNRUB are kept constant. It is observed that when the smoothing factor δ is beyond 1 , the
smoothing operation has little effect on digit recognition rates. This phenomenon also happens in the cases
of using different sets of parameters SNRLB and SNRUB . Therefore, the maximum value of smoothing
factor can be well approximated by setting δmax .= 1 0 and employed throughout all experiments.
Similarly, we chose a SNR lower bound from the interval 0 30~ dB while a SNR upper bound from the
interval 20 50~ dB with increment 5dB to test which set of SNR parameters can achieve better digit
9. recognition accuracy. It is found that no any pre-determined SNR lower and upper bounds can always
work well for various noisy conditions, i.e., the parameters minδ , maxδ , SNRLB and SNRUB are
tightly related to the kind of background noise and sensitive to recognition rates.
Fig. 1 and Fig. 2 show the log LPC spectra of the Mandarin utterance “1” for the baseline case and
the case with WAT scheme under clean and 20-dB factory-distorted conditions, respectively. Moreover,
we also plot the two spectra (without WAT and with WAT) of the 6-th frame under the same
experimental conditions in Fig. 3 and Fig. 4, respectively. From those figures, we can find that for clean
utterance, the WAT scheme is useful in emphasizing the formant structure as well as keeping the spectral
shape almost unchanged. When the utterance “1” is distorted by factory noise, there gradually appears an
abnormal formant peak in the log LPC spectra at about 1000 Hz ~ 1375 Hz. Comparing with the
distorted case, the WAT scheme makes the abnormal spectral distortion less pronounced. This feature
verifies the robustness of the WAT scheme in a noisy environment. In Table 1 and 2, we assess the
accuracy of baseline, SMC, OSALPC and the WAT scheme for recognition of noisy speech under the
influence of white noise and factory noise, respectively. From the experimental results, we can observe
that the WAT scheme provides better performance than the other methods we evaluated in noisy
environments.
10. IV. CONCLUSIONS
In this paper, the weighted arcsin transform scheme was proposed as a novel technique for enhancing
the robustness of LPC-based cepstral features. The WAT scheme performs arcsin transform along the
temporal trajectory of the NACS and weights each component in the NACS by using the normalized
reciprocal of the AMDF. The digit recognition results show that for clean speech, the WAT-based
recognizer achieves performance comparable to that obtained with the standard LPC-based cepstral
features. For noisy conditions, the WAT scheme provides a moderate improvement in recognition
accuracy relative to the baseline, the SMC and the OSALPC over a wide range of SNR values.
11. REFERENCES
[1] D. Mansour and B. H. Juang, “The short-time modified coherence representation and its application
for noisy speech recognition,” IEEE Trans. Acoust., Speech, Signal Processing, vol. ASSP-23, pp.
67-72, 1975.
[2] J. Hernando and C. Nadeu, “Linear prediction of the one-sided autocorrelation sequence for noisy
speech recognition,” IEEE Trans. Speech and Audio Processing, vol. 5, no. 1, pp. 80-84, 1997.
[3] L. M. Lee and H. C. Wang (1995), “Representation of hidden Markov model for noise adaptive
speech recognition”, Electronics Letters, vol. 31, no. 8, pp. 616-617.
[4] C. H. Lee and C. H. Lin, “On the use of a family of signal limiter for recognition of noisy speech,”
Speech Communication 12, 383-392, 1993.
[5] W. W. Hung, ”Using adaptive signal limiter together with weighting techniques for noisy speech
recognition,” accepted and to appear in International Conference on Spoken Language
Processing (ICSLP’2002) (Paper id 1679), 2002.
[6] T. Shimamura and H. Kobayashi, “Weighted autocorrelation for pitch extraction of noisy speech,”
IEEE Trans. Speech and Audio Processing, vol. 9, no. 7, pp. 727-730, 2001.
[7] A. P. Varga, H.J.M. Steeneken, M. Tomlinson and D. Jones, “The NOISEX-92 study on the effect
of additive noise on automatic speech recognition,” Technical Report, DRA Speech Research Unit,
Malvern, England, 1992.
12. Fig. 1. (A)
0 375 750 1125 1500 1875 2250 2625 3000 3375 3750
1
6
11
-2
-1
0
1
2
3
4
magnitude(dB)
frequency (Hz)
frame index
clean log LPC spectra
without WAT
Fig. 1. (B)
0 375 750 1125 1500 1875 2250 2625 3000 3375 3750
1
7
13
-1.5
-1
-0.5
0
0.5
1
1.5
2
2.5
3
magnitude(dB)
frequency (Hz)
frame index
clean log LPC spectra
with WAT
13. Fig. 2. (A)
0 375 750 1125 1500 1875 2250 2625 3000 3375 3750
1
7
13
-1.5
-1
-0.5
0
0.5
1
1.5
2
2.5
3
3.5
magnitude(dB)
frequency (Hz)
frame index
distorted log LPC spectra
without WAT
Fig. 2. (B)
0 375 750 1125 1500 1875 2250 2625 3000 3375 3750
1
7
13
-1.5
-1
-0.5
0
0.5
1
1.5
2
2.5
magnitude(dB)
frequency (Hz)
frame index
distorted log LPC spectra
with WAT
14. Fig. 3.
Fig. 4.
clean log LPC spectra of the 6-th frame
-2
-1.5
-1
-0.5
0
0.5
1
1.5
2
2.5
3
3.5 0
250
500
750
1000
1250
1500
1750
2000
2250
2500
2750
3000
3250
3500
3750
frequency (Hz)
magnitude(dB)
without WAT
with WAT
distorted log LPC spectra of the 6-th frame
-1.5
-1
-0.5
0
0.5
1
1.5
2
2.5
3
0
375
750
1125
1500
1875
2250
2625
3000
3375
3750
frequency (Hz)
magnitude(dB)
without WAT
with WAT
15. TABLE I.
Mandarin digit recognition rates (%)
Schemes
∞ dB 20 dB 15 dB 10 dB 5 dB 0 dB
Baseline 98.9 80.2 65.7 48.8 25.6 10.6
SMC 97.5 87.5 79.6 70.1 60.7 50.5
OSALPC 97.3 86.4 78.1 67.9 56.4 44.9
WAT 97.8 88.3 80.1 72.2 63.1 54.8
TABLE II.
Mandarin digit recognition rates (%)
Schemes
∞ dB 20 dB 15 dB 10 dB 5 dB 0 dB
Baseline 98.9 91.2 81.4 65.9 46.9 25.4
SMC 97.5 91.7 87.6 77.8 69.6 55.6
OSALPC 97.3 91.5 86.9 75.3 65.1 50.3
WAT 97.8 92.2 88.9 79.9 71.7 58.8