SlideShare ist ein Scribd-Unternehmen logo
1 von 110
Downloaden Sie, um offline zu lesen
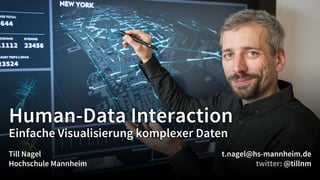
Human-Data Interaction
Einfache Visualisierung komplexer Daten
Till Nagel
Hochschule Mannheim
t.nagel@hs-mannheim.de
@tillnm
Diplom-Medieninformatik (FH)
Leiter Software-Entwicklung
Berater und Konzepter
Mindblower. […] Infractor is
a stunning example of what
you can do with Times APIs.
New York Times, First Look
PhD an der KU Leuven
Gastforscher am MIT Senseable City Lab
Unfolding Maps
the true measure of the toolkit’s value lies in the
creation […] of successful visualizations by others”
“
Bostock, M., Heer, J. Protovis: A graphical toolkit for
visualization. IEEE TVCG 15 (6), 2009, pp. 1121–1128.
Mäandern
Visualisierungsprozess
maeve
https://vimeo.com/1766968
https://vimeo.com/1751327
Touching Transport
LIVE Singapore!
LIVE Singapore!
Bus network in Singapore
AM peak
PM peak
Touching Transport
Time-Series View
https://youtu.be/wQpTM7ASc-w
User study
Nagel, et al. Touching Transport - A Case Study on
Visualizing Metropolitan Public Transit on Interactive
Tabletops, AVI’14, ACM, pp. 281-288
Nagel, et al. Sankey Arcs – Visualized edge
weights in path graphs, EuroVis - Short Papers
(2012), Eurographics Association, pp. 55–59.
cf. city flows
• Anregende Ästhetik bieten
Design
• Vergleichende Analyse unterstützen
Funktional
• Einen Raum für Diskussion öffnen
Sozial
Gestaltungsziele
London
Santander Cycles
Berlin
Call a Bike
New York
Citibike
London
Santander Cycles
Berlin
Call a Bike
New York
Citibike
20° C
3 Juni 2015
21° C 21° C
Rohdaten
• Stadtweite Sicht
• Stationssicht
• Small-Multiple Sicht
Drei Ansichten
Stadtweite Sicht
Stationssicht
Small-Multiple Sicht
https://vimeo.com/173787508
Ästhetisch, Funktional und Sozial
Nagel, T., Pietsch, C., Dörk, M. Staged Analysis:
From Evocative to Comparative Visualizations of
Urban Mobility. IEEE VISAP 2016, pp. 23-30
Forschendes Lernen
MetropolitanTownPlanningCommission,ca.1920ies
http://isoscope.fh-potsdam.de
The Atlantic
A striking new way to visualise mobility
Fast Co Design
Infographic of the day
Gortana, F., et al. Isoscope - Visualizing
temporal mobility variance with isochrone
maps. Poster Abstracts of IEEE VIS (2014)
http:// liquidata.org/
https://vimeo.com/43120464
http://infovis-mannheim.de
…
Vielen Dank.
Prof. Dr. Till Nagel
nagel@hs-mannheim.de
5. Juli 2017
Intuity Stuttgart

Weitere ähnliche Inhalte

Ähnlich wie Human-Data Interaction

Ist interaktives Fernsehen wirklich interaktiv?
Ist interaktives Fernsehen wirklich interaktiv?Ist interaktives Fernsehen wirklich interaktiv?
Ist interaktives Fernsehen wirklich interaktiv?Maik Wiesegart
 
Avatars at work: Lernen und arbeiten im Web 3D
Avatars at work: Lernen und arbeiten im Web 3DAvatars at work: Lernen und arbeiten im Web 3D
Avatars at work: Lernen und arbeiten im Web 3DHanno Tietgens
 
Multiscreen Experience (Mai 2012, IA Konferenz, Essen)
Multiscreen Experience (Mai 2012, IA Konferenz, Essen)Multiscreen Experience (Mai 2012, IA Konferenz, Essen)
Multiscreen Experience (Mai 2012, IA Konferenz, Essen)Wolfram Nagel
 
Projektvorstellung des EU-Forschungsprojekts WeGov im Bundestag
Projektvorstellung des EU-Forschungsprojekts WeGov im BundestagProjektvorstellung des EU-Forschungsprojekts WeGov im Bundestag
Projektvorstellung des EU-Forschungsprojekts WeGov im BundestagTimo Wandhoefer
 
#GATEMAKO Keynote Oppermann VR/AR
#GATEMAKO Keynote Oppermann VR/AR#GATEMAKO Keynote Oppermann VR/AR
#GATEMAKO Keynote Oppermann VR/ARLeif Oppermann
 
Vision elektromobile-stadt
Vision elektromobile-stadtVision elektromobile-stadt
Vision elektromobile-stadtGorka Espiau
 
Lernanwendungen im mobilen Web – technische Herausforderungen und Lösungen, v...
Lernanwendungen im mobilen Web – technische Herausforderungen und Lösungen, v...Lernanwendungen im mobilen Web – technische Herausforderungen und Lösungen, v...
Lernanwendungen im mobilen Web – technische Herausforderungen und Lösungen, v...Multimedia Communications Lab
 
Social TV - Die Zukunft des Fernsehens? Studie des Instituts für Journalistik...
Social TV - Die Zukunft des Fernsehens? Studie des Instituts für Journalistik...Social TV - Die Zukunft des Fernsehens? Studie des Instituts für Journalistik...
Social TV - Die Zukunft des Fernsehens? Studie des Instituts für Journalistik...Christopher Buschow
 
Giovanni Coppa - The integrate Mobility Concept.pdf
Giovanni Coppa - The integrate Mobility Concept.pdfGiovanni Coppa - The integrate Mobility Concept.pdf
Giovanni Coppa - The integrate Mobility Concept.pdfFIWARE
 
Events in Berlin 01-15 Mai 2011
Events in Berlin 01-15 Mai 2011Events in Berlin 01-15 Mai 2011
Events in Berlin 01-15 Mai 2011m. dubsky
 
Vortrag Prof. Dr. Heinrich Arnold
Vortrag Prof. Dr. Heinrich ArnoldVortrag Prof. Dr. Heinrich Arnold
Vortrag Prof. Dr. Heinrich ArnoldThomas Gawlitta
 
Smart City: Daten als Innovationstreiber der intelligenten Stadt
Smart City: Daten als Innovationstreiber der intelligenten StadtSmart City: Daten als Innovationstreiber der intelligenten Stadt
Smart City: Daten als Innovationstreiber der intelligenten StadtStephan Haller
 
2016 - IoT - Service Design development
2016 - IoT - Service Design development2016 - IoT - Service Design development
2016 - IoT - Service Design developmentJohannes Waibel
 

Ähnlich wie Human-Data Interaction (20)

Ist interaktives Fernsehen wirklich interaktiv?
Ist interaktives Fernsehen wirklich interaktiv?Ist interaktives Fernsehen wirklich interaktiv?
Ist interaktives Fernsehen wirklich interaktiv?
 
2015-10 PM Projekt 3D-GUIde gestartet
2015-10 PM Projekt 3D-GUIde gestartet2015-10 PM Projekt 3D-GUIde gestartet
2015-10 PM Projekt 3D-GUIde gestartet
 
Avatars at work: Lernen und arbeiten im Web 3D
Avatars at work: Lernen und arbeiten im Web 3DAvatars at work: Lernen und arbeiten im Web 3D
Avatars at work: Lernen und arbeiten im Web 3D
 
VDC Newsletter 2005-11
VDC Newsletter 2005-11VDC Newsletter 2005-11
VDC Newsletter 2005-11
 
Multiscreen Experience (Mai 2012, IA Konferenz, Essen)
Multiscreen Experience (Mai 2012, IA Konferenz, Essen)Multiscreen Experience (Mai 2012, IA Konferenz, Essen)
Multiscreen Experience (Mai 2012, IA Konferenz, Essen)
 
VDC Newsletter 2009-01
VDC Newsletter 2009-01VDC Newsletter 2009-01
VDC Newsletter 2009-01
 
Vom Büro ins Bauwerk
Vom Büro ins BauwerkVom Büro ins Bauwerk
Vom Büro ins Bauwerk
 
Projektvorstellung des EU-Forschungsprojekts WeGov im Bundestag
Projektvorstellung des EU-Forschungsprojekts WeGov im BundestagProjektvorstellung des EU-Forschungsprojekts WeGov im Bundestag
Projektvorstellung des EU-Forschungsprojekts WeGov im Bundestag
 
#GATEMAKO Keynote Oppermann VR/AR
#GATEMAKO Keynote Oppermann VR/AR#GATEMAKO Keynote Oppermann VR/AR
#GATEMAKO Keynote Oppermann VR/AR
 
Vision elektromobile-stadt
Vision elektromobile-stadtVision elektromobile-stadt
Vision elektromobile-stadt
 
Lernanwendungen im mobilen Web – technische Herausforderungen und Lösungen, v...
Lernanwendungen im mobilen Web – technische Herausforderungen und Lösungen, v...Lernanwendungen im mobilen Web – technische Herausforderungen und Lösungen, v...
Lernanwendungen im mobilen Web – technische Herausforderungen und Lösungen, v...
 
Social TV - Die Zukunft des Fernsehens? Studie des Instituts für Journalistik...
Social TV - Die Zukunft des Fernsehens? Studie des Instituts für Journalistik...Social TV - Die Zukunft des Fernsehens? Studie des Instituts für Journalistik...
Social TV - Die Zukunft des Fernsehens? Studie des Instituts für Journalistik...
 
Giovanni Coppa - The integrate Mobility Concept.pdf
Giovanni Coppa - The integrate Mobility Concept.pdfGiovanni Coppa - The integrate Mobility Concept.pdf
Giovanni Coppa - The integrate Mobility Concept.pdf
 
Quellen zum "Internet der Dinge"
Quellen zum "Internet der Dinge"Quellen zum "Internet der Dinge"
Quellen zum "Internet der Dinge"
 
VDC Newsletter 2010-01
VDC Newsletter 2010-01VDC Newsletter 2010-01
VDC Newsletter 2010-01
 
Events in Berlin 01-15 Mai 2011
Events in Berlin 01-15 Mai 2011Events in Berlin 01-15 Mai 2011
Events in Berlin 01-15 Mai 2011
 
Vortrag Prof. Dr. Heinrich Arnold
Vortrag Prof. Dr. Heinrich ArnoldVortrag Prof. Dr. Heinrich Arnold
Vortrag Prof. Dr. Heinrich Arnold
 
Smart City: Daten als Innovationstreiber der intelligenten Stadt
Smart City: Daten als Innovationstreiber der intelligenten StadtSmart City: Daten als Innovationstreiber der intelligenten Stadt
Smart City: Daten als Innovationstreiber der intelligenten Stadt
 
VDC Newsletter 2006-01
VDC Newsletter 2006-01VDC Newsletter 2006-01
VDC Newsletter 2006-01
 
2016 - IoT - Service Design development
2016 - IoT - Service Design development2016 - IoT - Service Design development
2016 - IoT - Service Design development
 

Mehr von Till Nagel

Visually analyzing urban mobility - Results and insights from three student r...
Visually analyzing urban mobility - Results and insights from three student r...Visually analyzing urban mobility - Results and insights from three student r...
Visually analyzing urban mobility - Results and insights from three student r...Till Nagel
 
GeoVisualisierung in der Lehre - Wie forschendes Lernen zu funktionalen Proto...
GeoVisualisierung in der Lehre - Wie forschendes Lernen zu funktionalen Proto...GeoVisualisierung in der Lehre - Wie forschendes Lernen zu funktionalen Proto...
GeoVisualisierung in der Lehre - Wie forschendes Lernen zu funktionalen Proto...Till Nagel
 
Einführung in die Datenvisualisierung - Workshop
Einführung in die Datenvisualisierung - WorkshopEinführung in die Datenvisualisierung - Workshop
Einführung in die Datenvisualisierung - WorkshopTill Nagel
 
cf. city flows - A comparative visualization of bike sharing systems
cf. city flows - A comparative visualization of bike sharing systemscf. city flows - A comparative visualization of bike sharing systems
cf. city flows - A comparative visualization of bike sharing systemsTill Nagel
 
Meandering - On the design process of visualizations
Meandering - On the design process of visualizationsMeandering - On the design process of visualizations
Meandering - On the design process of visualizationsTill Nagel
 
Unfolding the City - Urban Mobility Visualizations
Unfolding the City - Urban Mobility VisualizationsUnfolding the City - Urban Mobility Visualizations
Unfolding the City - Urban Mobility VisualizationsTill Nagel
 
Touching Transport - A Case Study on Visualizing Metropolitan Public Transit ...
Touching Transport - A Case Study on Visualizing Metropolitan Public Transit ...Touching Transport - A Case Study on Visualizing Metropolitan Public Transit ...
Touching Transport - A Case Study on Visualizing Metropolitan Public Transit ...Till Nagel
 
Unfolding the City
Unfolding the CityUnfolding the City
Unfolding the CityTill Nagel
 
Unfolding - Workshop at RCA
Unfolding - Workshop at RCAUnfolding - Workshop at RCA
Unfolding - Workshop at RCATill Nagel
 
Unfolding - A Library for Interactive Maps and Geovisualizations
Unfolding - A Library for Interactive Maps and GeovisualizationsUnfolding - A Library for Interactive Maps and Geovisualizations
Unfolding - A Library for Interactive Maps and GeovisualizationsTill Nagel
 
Unfolding - A Simple Library for Interactive Maps and Geovisualizations in Pr...
Unfolding - A Simple Library for Interactive Maps and Geovisualizations in Pr...Unfolding - A Simple Library for Interactive Maps and Geovisualizations in Pr...
Unfolding - A Simple Library for Interactive Maps and Geovisualizations in Pr...Till Nagel
 
Multitouch Lab Intro - Urbane Ebenen
Multitouch Lab Intro - Urbane EbenenMultitouch Lab Intro - Urbane Ebenen
Multitouch Lab Intro - Urbane EbenenTill Nagel
 
Sankey Arcs - Visualizing edge weights in path graphs
Sankey Arcs - Visualizing edge weights in path graphsSankey Arcs - Visualizing edge weights in path graphs
Sankey Arcs - Visualizing edge weights in path graphsTill Nagel
 
Interactive Exploration of Geospatial Network Visualization
Interactive Exploration of Geospatial Network Visualization Interactive Exploration of Geospatial Network Visualization
Interactive Exploration of Geospatial Network Visualization Till Nagel
 
Unfolding Library for Interactive Maps
Unfolding Library for Interactive MapsUnfolding Library for Interactive Maps
Unfolding Library for Interactive MapsTill Nagel
 
GeoVis - More than Zoom and Pan
GeoVis - More than Zoom and PanGeoVis - More than Zoom and Pan
GeoVis - More than Zoom and PanTill Nagel
 
GeoVisualization for Understanding Cities
GeoVisualization for Understanding CitiesGeoVisualization for Understanding Cities
GeoVisualization for Understanding CitiesTill Nagel
 
Unfolding Data - Interaction Design for Visualizations of Geospatial Data
Unfolding Data - Interaction Design for Visualizations of Geospatial DataUnfolding Data - Interaction Design for Visualizations of Geospatial Data
Unfolding Data - Interaction Design for Visualizations of Geospatial DataTill Nagel
 
Creative Coding 1 - 2 Variables
Creative Coding 1 - 2 VariablesCreative Coding 1 - 2 Variables
Creative Coding 1 - 2 VariablesTill Nagel
 

Mehr von Till Nagel (20)

Visually analyzing urban mobility - Results and insights from three student r...
Visually analyzing urban mobility - Results and insights from three student r...Visually analyzing urban mobility - Results and insights from three student r...
Visually analyzing urban mobility - Results and insights from three student r...
 
GeoVisualisierung in der Lehre - Wie forschendes Lernen zu funktionalen Proto...
GeoVisualisierung in der Lehre - Wie forschendes Lernen zu funktionalen Proto...GeoVisualisierung in der Lehre - Wie forschendes Lernen zu funktionalen Proto...
GeoVisualisierung in der Lehre - Wie forschendes Lernen zu funktionalen Proto...
 
Einführung in die Datenvisualisierung - Workshop
Einführung in die Datenvisualisierung - WorkshopEinführung in die Datenvisualisierung - Workshop
Einführung in die Datenvisualisierung - Workshop
 
cf. city flows - A comparative visualization of bike sharing systems
cf. city flows - A comparative visualization of bike sharing systemscf. city flows - A comparative visualization of bike sharing systems
cf. city flows - A comparative visualization of bike sharing systems
 
Meandering - On the design process of visualizations
Meandering - On the design process of visualizationsMeandering - On the design process of visualizations
Meandering - On the design process of visualizations
 
Unfolding the City - Urban Mobility Visualizations
Unfolding the City - Urban Mobility VisualizationsUnfolding the City - Urban Mobility Visualizations
Unfolding the City - Urban Mobility Visualizations
 
Touching Transport - A Case Study on Visualizing Metropolitan Public Transit ...
Touching Transport - A Case Study on Visualizing Metropolitan Public Transit ...Touching Transport - A Case Study on Visualizing Metropolitan Public Transit ...
Touching Transport - A Case Study on Visualizing Metropolitan Public Transit ...
 
Unfolding the City
Unfolding the CityUnfolding the City
Unfolding the City
 
Unfolding - Workshop at RCA
Unfolding - Workshop at RCAUnfolding - Workshop at RCA
Unfolding - Workshop at RCA
 
Unfolding - A Library for Interactive Maps and Geovisualizations
Unfolding - A Library for Interactive Maps and GeovisualizationsUnfolding - A Library for Interactive Maps and Geovisualizations
Unfolding - A Library for Interactive Maps and Geovisualizations
 
Unfolding - A Simple Library for Interactive Maps and Geovisualizations in Pr...
Unfolding - A Simple Library for Interactive Maps and Geovisualizations in Pr...Unfolding - A Simple Library for Interactive Maps and Geovisualizations in Pr...
Unfolding - A Simple Library for Interactive Maps and Geovisualizations in Pr...
 
mæve
mævemæve
mæve
 
Multitouch Lab Intro - Urbane Ebenen
Multitouch Lab Intro - Urbane EbenenMultitouch Lab Intro - Urbane Ebenen
Multitouch Lab Intro - Urbane Ebenen
 
Sankey Arcs - Visualizing edge weights in path graphs
Sankey Arcs - Visualizing edge weights in path graphsSankey Arcs - Visualizing edge weights in path graphs
Sankey Arcs - Visualizing edge weights in path graphs
 
Interactive Exploration of Geospatial Network Visualization
Interactive Exploration of Geospatial Network Visualization Interactive Exploration of Geospatial Network Visualization
Interactive Exploration of Geospatial Network Visualization
 
Unfolding Library for Interactive Maps
Unfolding Library for Interactive MapsUnfolding Library for Interactive Maps
Unfolding Library for Interactive Maps
 
GeoVis - More than Zoom and Pan
GeoVis - More than Zoom and PanGeoVis - More than Zoom and Pan
GeoVis - More than Zoom and Pan
 
GeoVisualization for Understanding Cities
GeoVisualization for Understanding CitiesGeoVisualization for Understanding Cities
GeoVisualization for Understanding Cities
 
Unfolding Data - Interaction Design for Visualizations of Geospatial Data
Unfolding Data - Interaction Design for Visualizations of Geospatial DataUnfolding Data - Interaction Design for Visualizations of Geospatial Data
Unfolding Data - Interaction Design for Visualizations of Geospatial Data
 
Creative Coding 1 - 2 Variables
Creative Coding 1 - 2 VariablesCreative Coding 1 - 2 Variables
Creative Coding 1 - 2 Variables
 

Human-Data Interaction