
Empfohlen
Weitere ähnliche Inhalte
Was ist angesagt?
Was ist angesagt? (20)
Andere mochten auch
Andere mochten auch (9)
Ähnlich wie Worksheets on graphs of trigonometry 2010
Ähnlich wie Worksheets on graphs of trigonometry 2010 (20)
Mehr von bryan
Mehr von bryan (20)
Worksheets on graphs of trigonometry 2010
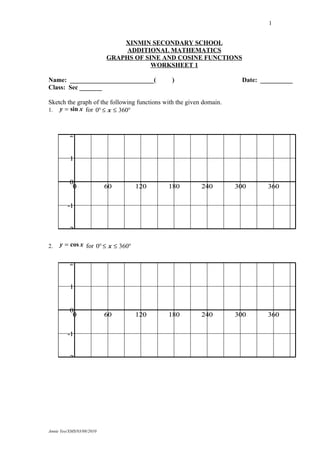
- 1. 1 XINMIN SECONDARY SCHOOL ADDITIONAL MATHEMATICS GRAPHS OF SINE AND COSINE FUNCTIONS WORKSHEET 1 Name: __________________________( ) Date: __________ Class: Sec _______ Sketch the graph of the following functions with the given domain. 1. y = 3 x for 0° ≤ x ≤ 360° sin 2 1 0 -60 0 60 120 180 240 300 360 420 -1 -2 3 2. y = cos x for 0° ≤ x ≤ 360° -3 2 1 0 -60 0 60 120 180 240 300 360 420 -1 -2 -3 Annie Yeo/XMS/03/08/2010
- 2. 2 3. y = tan x for 0° ≤ x ≤ 360° 10 5 0 -60 0 60 120 180 240 300 360 420 -5 -10 -15 Annie Yeo/XMS/03/08/2010
- 3. 3 XINMIN SECONDARY SCHOOL ADDITIONAL MATHEMATICS GRAPHS OF SINE, COSINE and TANGENT FUNCTIONS WORKSHEET 2 Name: _____________________________( ) Date: _________ Class: Sec _______ Log into ACE Learning Platform Sec 3 Express Additional Mathematics Section, Chapter T3 W7: Graphs and Properties of sinx, cosx and tanx Topic: Graphs of Trigonometric Functions Interactive Labs: • Graphs of y = a cos bx + c • Graphs of y = a sin bx + c • Graphs of y = a tan bx + c • 1 1 1 View the graphs of y = sin 2 x , y = sin 4 x , y = sin x and y = sin x separately for 2 4 0° ≤ x ≤ 360° and −1.5 ≤ y ≤ 1.5 . 2 Refer to each of the graphs, complete the following statements. (a) The amplitude of the graph of y = sin 2 x is ________ and its frequency is _________. (b) The amplitude of the graph of y = sin 4 x is ________ and its frequency is __________. 1 (c) The amplitude of the graph of y = sin x is ________ and its frequency is _________. 2 1 (d) The amplitude of the graph of y = sin x is ________ and its frequency is _________. 4 In general, the graph of y = sin bx has an amplitude of ______, a frequency of ________ and a period of ___________ for 0° ≤ x ≤ 360° . 1 3 3 View the graphs of y = 2sin x , y = 4sin x , y = sin x and y = sin x separately for 2 2 0° ≤ x ≤ 360° and −5 ≤ y ≤ 5 . 4 Refer to each of the graphs, complete the following statements. Annie Yeo/XMS/03/08/2010
- 4. 4 (a) The amplitude of the graph of y = 2sin x is ________ and its frequency is _________. (b) The amplitude of the graph of y = 4sin x is _______ and its frequency is ________. 1 (c) The amplitude of the graph of y = sin x is ________ and its frequency is _______. 2 3 (d) The amplitude of the graph of y = sin x is ________ and its frequency is ________. 2 In general, the graph of y = a sin x has an amplitude of ______, a frequency of _____ and a period of ________ for 0° ≤ x ≤ 360° . Hence, the graph of y = a sin bx has an amplitude of ______, a frequency of _____ and a period of ________ for 0° ≤ x ≤ 360° . 1 5 5 View the graphs of y = cos 3 x , y = cos x , y = cos 5 x and y = cos x separately for 3 2 0° ≤ x ≤ 360° and −1.5 ≤ y ≤ 1.5 . 6 Refer to each of the graphs, complete the following statements. (a) The amplitude of the graph of y = cos 3 x is _______ and its frequency is ________. 1 (b) The amplitude of the graph of y = cos x is _______ and its frequency is ________. 3 (c) The amplitude of the graph of y = cos 5 x is ________ and its frequency is _______. 5 (d) The amplitude of the graph of y = cos x is ________ and its frequency is _______. 2 In general, the graph of y = cos bx has an amplitude of _____, a frequency of ____ and a period of ________ for 0° ≤ x ≤ 360° . Annie Yeo/XMS/03/08/2010
- 5. 5 1 5 7 View the graphs of y = 3cos x , y = cos x , y = 5cos x and y = cos x separately for 3 2 0° ≤ x ≤ 360° and −5.5 ≤ y ≤ 5.5 . 8 Refer to each of the graphs, complete the following statements. (a) The amplitude of the graph of y = 3cos x is ________ and its frequency is _______. 1 (b) The amplitude of the graph of y = cos x is _______ and its frequency is _______. 3 (c) The amplitude of the graph of y = 5cos x is ________ and its frequency is _______. 5 (d) The amplitude of the graph of y = cos x is _______ and its frequency is _______. 2 In general, the graph of y = a cos x has an amplitude of _____, a frequency of ____ and a period of _____ for 0° ≤ x ≤ 360° . Hence, the graph of y = a cos bx has an amplitude of _____, a frequency of ______ and a period of ________ for 0° ≤ x ≤ 360° 1 5 9 View the graphs of y = tan 3x , y = tan x , y = tan 5 x and y = tan x separately for 3 2 0° ≤ x ≤ 360° and −1.5 ≤ y ≤ 1.5 . 10 Refer to each of the graphs, complete the following statements. (a) The amplitude of the graph of y = tan 3x is __________ and its frequency is ________. 1 (b) The amplitude of the graph of y = tan x is __________ and its frequency is _______. 3 (c) The amplitude of the graph of y = tan 5 x is __________ and its frequency is _______. 5 (d) The amplitude of the graph of y = tan x is __________ and its frequency is _______. 2 In general, the graph of y = tan bx has an ___________ amplitude, a frequency of ____ and a period of ________ for 0° ≤ x ≤ 360° . Annie Yeo/XMS/03/08/2010
- 6. 6 1 5 11 View the graphs of y = 3 tan x , y = tan x , y = 5 tan x and y = tan x separately for 3 2 0° ≤ x ≤ 360° and −5.5 ≤ y ≤ 5.5 . 12 Refer to each of the graphs, complete the following statements. (a) The amplitude of the graph of y = 3 tan x is ___________ and its frequency is _______. 1 (b) The amplitude of the graph of y = tan x is __________ and its frequency is _______. 3 (c) The amplitude of the graph of y = 5 tan x is ___________ and its frequency is _______. 5 (d) The amplitude of the graph of y = tan x is ___________ and its frequency is ______. 2 In general, the graph of y = a tanx has an __________ amplitude, a frequency of _____ and a period of _____ for 0° ≤ x ≤ 360° . Hence, the graph of y = a tanbx has an ___________amplitude, a frequency of ______ and a period of ________ for 0° ≤ x ≤ 360° . Annie Yeo/XMS/03/08/2010
- 7. 7 XINMIN SECONDARY SCHOOL ADDITIONAL MATHEMATICS GRAPHS OF SINE AND COSINE FUNCTIONS WORKSHEET 3 Name: _____________________________( ) Date: _________ Class: Sec _______ 1 The graph of y = sin x for 0° ≤ x ≤ 360° is shown below. Sketch the graph of the function 1.5 y = sin 3 x for 0° ≤ x ≤ 360° on the same axes: 1 0.5 0 -60 0 60 120 180 240 300 360 420 -0.5 -1 y=sinx 2 Sketch the graph of the function y = 3sin x for 0° ≤ x ≤ 360° . -1.5 6 4 2 0 -60 0 60 120 180 240 300 360 420 -2 -4 -6 Annie Yeo/XMS/03/08/2010
- 8. 8 3 The graph of y = cos x for 0° ≤ x ≤ 360° is shown below. Sketch the graph of the function 1.5 1 y = cos x for 0° ≤ x ≤ 360° on the same axes: 3 1 0.5 0 -60 0 60 120 180 240 300 360 420 -0.5 -1 y=cosx 1 4 Sketch the graph of the function y = cos x for 0° ≤ x ≤ 360° . 1.5 -1.5 2 1 0.5 0 -60 0 60 120 180 240 300 360 420 -0.5 -1 -1.5 Annie Yeo/XMS/03/08/2010
- 9. 9 5 The graph of y = tan x for 0° ≤ x ≤ 360° is shown below. Sketch the graph of the function y = tan 2 x for 0° ≤ x ≤ 360° on the same axes: 8 6 4 asymptote asymptote 2 0 -60 0 60 120 180 240 300 360 420 -2 -4 -6 -8 y=tanx -10 x=90 Vertical line through ( 2701 ,0 ) 6 Sketch the graph of the function y = tan x for 0° ≤ x ≤ 360° . 3 8 6 4 2 0 -60 0 60 120 180 240 300 360 420 -2 -4 -6 -8 7 Sketch the graph of the function y = −3sin 2 x for 0° ≤ x ≤ 360° . Annie Yeo/XMS/03/08/2010
- 10. 10 6 4 2 0 -60 0 60 120 180 240 300 360 420 -2 -4 8 -6 Sketch the graph of the function y = 5cos 3 x for 0° ≤ x ≤ 360° . 8 6 4 2 0 -60 0 60 120 180 240 300 360 420 -2 -4 -6 -8 Annie Yeo/XMS/03/08/2010