L & T Metro Rail Impact Assessment Study - Stage 3

Pragna Research Consultancy Services, Hyderabad did an Impact Assessment Study of Hyderabad Metro Rail Project for L&T Metro Rail. 4 Reports on the 4 different Stages with numerous errors and repetitions done using cut, copy and paste of content across reports were delivered to L & T Metro Rail. The junk contained in the Reports had to be processed to enable reuse and recycle of content for the Presentations. A staffer in L&T Metro Rail was given my telephone number for contact by a lady from Pragna for assistance in converting the Reports into Presentations. The staffer said that she couldn’t do it herself as she was busy with personal matters and had to seek help on personal request and compensate for it out of her salary. The staffer grossly underestimated the costs, labor and time involved in the work, for reasons best known to her, which was far beyond her ability to pay for it. She and the lady from Pragna insist that L&T Metro Rail and Pragna have nothing to do with this work and this was expected to be done on a personal capacity for a payment that is less than 1/10th of the cost involved to do it. The Report on Stage 3 was converted into a Presentation and sent to the staffer. Since either of the organizations involved in the creation of these Reports say they have nothing to do with it, the staffer has no ability to pay a realistic price for the conversion of Reports into Presentations and given the prevalent poverty (not necessarily in the material sense) of these organizations and staff working with them, I decide to leave this presentation with them as a donation. To discourage full or partial use of the contents without acknowledgement of source by these organizations and their staff, as well as to get a bit of personal mileage as return for this unpaid free effort (can we call it voluntary?) and provide some insights on what is perceived to be happening by people of Hyderabad on the Metro Rail Project, the Presentation on Stage 3 (Begumpet to Shilparamam) is available online for those who may be interested in it.

Empfohlen
Empfohlen
Weitere ähnliche Inhalte
Was ist angesagt?
Was ist angesagt? (20)
Andere mochten auch
Andere mochten auch (14)
Ähnlich wie L & T Metro Rail Impact Assessment Study - Stage 3
Ähnlich wie L & T Metro Rail Impact Assessment Study - Stage 3 (20)
Mehr von Ramesh Satyam
Kürzlich hochgeladen
Kürzlich hochgeladen (20)
L & T Metro Rail Impact Assessment Study - Stage 3
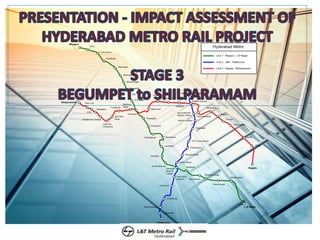
- 2. STAGE 3 COVERS THE FOLLOWING POINTS: BEGUMPET AMEERPET MADHURA NAGAR YOUSUFGUDA JUBLIEHILLS ROAD NO.5 JUBILEE HILLS CHECK POST PEDDAMMA TEMPLE MADHAPUR DURGAMCHERUVU HITECH CITY SHILPARAMAM RESEARCH STUDY –STAGE 3 OBJECTIVE: Assess the impact of Metro Rail on the lives of the people of Greater Hyderabad Educate the people about the positive impact and specific advantages of Metro Rail
- 3. CLASSIFICATION OF KEY FINDINGS I. Socio-Economic & Demographic Profile of the Respondents II. Mode of Transport used at present III. Perception about Metro Rail Project IV. Respondents’ Opinion on Opportunities from Metro Rail Project to the people and the city V. Impact on people and the environment during Construction Phase VI. Overall Opinion on the Metro Rail Project VII. Recommendations
- 4. SOCIO-ECONOMIC & DEMOGRAPHIC PROFILE OF THE RESPONDENTS
- 5. 301 333 371 334 296 291 275 307 300 276 344 0 50 100 150 200 250 300 350 400 Count Location Total Respondents = 3428 Average No. of Respondents = 311.67 Stage 3 - Point-wise Distribution of Sample Size
- 6. 39 39 41 41 41 37 39 41 40 41 40 61 61 59 59 59 63 61 59 60 59 60 0 10 20 30 40 50 60 70 FEMALE MALE Stage 3 – Point-wise Gender Ratio •The overall gender ratio for Stage 3 is 37 per cent females as against 63 per cent males. •The lower share of female respondents is attributable to the presence of many corporate units in the vicinity, where female population is comparatively low.
- 7. 11 63 22 3 1 0 10 20 30 40 50 60 70 0-20 20-30 30-45 45-60 60+ Percentage Stage 3 – Age Distribution of Respondents About 85% (2934 out of 3428) of the total respondents in stage 3 were between the age group of 20 years to 45 years. The maximum (63%) were in the age group of 20-30 years.
- 8. Stage 3 – Occupation Mix (Gender-wise) The overall occupational distribution shows that a significant number of people from all four categories were included , although those employed in the service sector predominate. Within the occupation classification – Service, Student and Business the male proportion of respondents was significantly higher. However, under Household, the female proportion was significantly higher indicating that most of the respondents were housewives.
- 9. Stage 3 – Income-wise Distribution during field investigations, one major difficulty experienced was that most of the respondents showed reluctance to divulge details related to their income. Hence, it is possible that the income reported is on the lower side
- 10. Stage 3 – Income-wise Distribution (Occupation-wise) Student included in this with projected salaries of parents considered as income Under Household, which largely comprises of women, the income represented is the total family income
- 11. MODE OF TRANSPORT USED AT PRESENT
- 12. Stage 3 – Average Distance Travelled To and Fro per Day About 40% of the total respondents travel distances of over 20 km per day (to and fro). Of these around 15% travel distances ranging between 20-30 km per day and around 25% travel distances over 30 km per day. About 28 % of the total respondents travel distances between 10 km to 20 km. Over 32 % of total respondents travel less than 10 km per day.
- 13. 50 301 426 164 141 50 343 507 61 14 25 160 289 25 10 48 405 389 17 3 0 100 200 300 400 500 600 CAR BUS BIKE AUTO OTHER uptp 10 10-20km 20-30km 30+ Stage 3 - Distance-wise Mode of Transport Respondents in Stage 3 region prefer motor-bikes / two-wheelers and bus transport for their long distance travel vis-à-vis auto-rickshaws / cars. The major reasons for these choices are availability, cost of travel and comfort.
- 14. Stage 3 – Average Distance Travelled (Occupation & Gender-wise) A large share of male respondents travel a distance of more than 30 km daily (40% of males in Service and 39% of males in Business ) Most female respondents travel less than 20 km and 82%, 75%,74% and 92% of female commuters in Student , Service, Business and Household segments respectively travel less than 20 Km.On an overall gender-wise basis, male respondents travel comparatively larger distances than women and their purposes and timings for travel are different
- 15. Stage 3 – Preferred Mode of Transport (Occupation & Gender-wise)
- 16. Men Within the student category, the maximum numbers of respondents use bus transport. Within the service and business segments, the maximum number of respondents use two-wheelers/bikes. Within the students’ category, bike is the second largest used mode of transport. Within the service and business segments, bus is the second largest used mode of transport Women Across various occupations, maximum number of respondents use bus transport. The use of two-wheelers/bikes has got the second largest share excluding the student category. The third largest mode of transport used by women in the business sector is auto- rickshaws. Cars are only used by women in the service, business and household segments. The maximum percentage of car users are in the household segment Transport Preferences (Occupation & Gender-wise)
- 17. Stage 3 - Mode of Transport Over 47% of the total respondents used bus transport and nearly 35% used bikes/two-wheelers. Relatively smaller percentages of respondents used autos, cars or walked
- 18. Stage 3 – Choice of Commute (Based on Income & Distance Travelled) as income increases, choice of commute options change from mass transit modes to personal transit modes
- 19. 192 1009 1106 154 90 0 200 400 600 800 1000 1200 AUTO BUS BIKE CAR PEDESTRIAN SAFETY COMFORTABILITY AVAILABILITY TIME SAVING MONEY SAVING Stage 3 – Reasons for Using a Specific Mode of Commute Respondents favor buses for their overall comfort, availability and money saving; whereas respondents use bikes for commuting mainly from the comfort point of view. This shows that there is a demand in the public for a better commute option that is comfortable and time saving. Making the commuters understand this specific advantage of the metro will be very important for the campaign
- 20. 120.5 97.5 74.9 109.7 51.5 182.5 76.5 61.3 35.9 12.6 0.0 20.0 40.0 60.0 80.0 100.0 120.0 140.0 160.0 180.0 200.0 CAR BIKE AUTO BUS PEDESTRIAN Avg Time Spent Avg. Money Spent Stage 3 –Time & Money Spent for Commuting The average time spent daily on commuting (to and fro) by two wheelers was around 1.5 hours, bus 1.75 hours and for cars was nearly 2 hours. The average time spent on commuting in auto- rickshaws was low as compared with two wheelers/bus/cars, as the distances travelled in the former were shorter than the latter. In terms of money spent, car owners spent the largest sum as against respondents travelling by bus who spent the least amount. The second highest amount was spent by respondents using bikes. It is observed that between Begumpet and Shilparamam, one of the busiest routes in the city, even bike riders get stuck in traffic leading to higher travel times.
- 21. 768 1708 742 68 32 0 200 400 600 800 1000 1200 1400 1600 1800 Rank 1 Issue Rank 2 Issue Rank 3 Issue Rank 4 Issue Rank 5 Issue Volume of Traffic Pollution Accidents Cost of Travel Others Traffic Induced Stress Stage 3 – Major Issues Related to Commuting in the City The Top 3 Issues of concern are Volume of Traffic, Pollution and Traffic Induced Stress
- 22. PERCEPTION ABOUT METRO RAIL PROJECT
- 23. 3340 9 6 70 3 0 500 1000 1500 2000 2500 3000 3500 4000 LESS MORE SAME CANT SAY NILL 96% of the total respondents perceive metro rail to consume less travelling time Perception on Time Taken to Travel by Metro Rail this response was after the respondents were educated by the survey team on the frequency/speed of metro rail (rail available after every 90 seconds; maximum speed of 90 km per hour; and average speed of 30-35 km per hour)
- 24. 3165 (92%) 127 (4%) 30 74 (3%) 4 0 500 1000 1500 2000 2500 3000 3500 LESS MORE SAME CANT SAY NILL Perception on Cost of Travel in Hyderabad Metro Rail 92 % of total respondents (3165 out of 3458) perceived that with the advent of Metro Rail, their transportation costs will reduce. For travelling longer distances there is no proper connectivity at present; one has to change / hop at multiple points which results in higher travelling cost / time. With the advent of Metro Rail, the perception is that the connectivity to longer distances will be direct and easier and travel cost will be less.
- 25. Perception of Respondents: Cost of Travel in Hyderabad Metro Rail (Gender & Occupation-wise) Across occupations over 90% of female respondents feel that, on commissioning of Metro Rail, their travel cost will be less than their present: 92% in female-Student 92% in female-Service, 91% in female-Household 91% in female-Business Across occupations, over 90% of male respondents feel that on commissioning of the Metro Rail, their travel cost shall be less than their present: 94% in male-Students 94% in male-Service 92% in male-Business 94% in male-Household The perception that cost of travel will be less than what it is at present is a little higher among male respondents as compared with female respondents
- 26. Awareness regarding Routes (Occupation & Age-wise) Respondents aged between 20-30 years possessed comparatively higher knowledge about the metro routes when compared with those between 30-45 years. Among the respondents, Student (20 years and below) and Service (20-45 years) have the highest level of knowledge regarding the metro routes.
- 27. Perception of Respondents: Whether Metro Rail is of Advantage to Hyderabad YES 99% NO 1% NIL 0% An overwhelming 99 % of the total respondents perceive that the advent of Metro Rail would be of Advantage to Hyderabad
- 28. 3072 2721 612 15 8 28 0 500 1000 1500 2000 2500 3000 3500 Perception of Respondents: Benefits of Metro Rail Project to the City The maximum number of respondents feel that “Ease in Traffic” and “Reduction in Pollution Levels” are the two key benefits that Metro Rail will bring to the City. About 8 % of the total respondents (612 out of 3458) perceived that the number of accidents would reduce significantly in the city, as they felt that the reduction in traffic on roads and increase in sky walks will reduce congestion on roads and hence reduce accidents.
- 29. 14 22 120 427 65 2627 1528 0 500 1000 1500 2000 2500 3000 Traffic Pollution Safety Greater Reach Reduced Stress Time Saving Money Saving Perception of Respondents: Benefits of Metro Rail Project to Citizens Most of the respondents perceived that the time spent by them in travel would reduce considerably. 96 % of the total respondents perceived that the commissioning of the Metro Rail will benefit them.
- 30. Perception of Respondents: Benefits of Metro Rail Project to Citizens (Yes/No) Over 98% of respondents of either gender and across age groups perceive that the metro rail will bring in benefits to them.
- 31. Awareness related to Facilities in Metro Rail (Yes/No) 82 % of the respondents have no knowledge regarding the facilities and amenities that would be provided in the train and the stations/depots
- 32. Awareness related to Facilities in Metro Rail (Based on Occupation, Gender and Age) On an overall basis among both genders it can be seen that maximum ignorance regarding Metro Rail is observed in the 20-30 and 30-45 age groups. Among the female respondents: Respondents aged between 20-30 years and 30-45 years showed maximum lack of awareness. In terms of occupation, women in Business between 30 years and 45 years showed maximum lack of awareness about facilities in Metro Rail. Among the male respondents: Respondents under Student and Service have the maximum ignorance levels. Under occupation, men in Business in the 30-45 age group has shown the maximum ignorance levels. Of the 82% respondents who have “No” knowledge regarding the facilities and amenities that would be provided in trains, stations and depots:
- 33. TV 10% INTERNET 30% NEWS PAPER 41% NO IDEA 19% Source of Information About 30% of the respondents said that they got information regarding Metro Rail from the internet; 41% said they relied on newspapers for information; 10% said that they got information from TV; while 19% had no idea regarding any sources of information about the project
- 34. Opinion of Respondents: Use of Metro Rail (Yes/No) An overwhelming 91 % of the total respondents said they would want to use the metro rail for commuting, while another 11 % where either skeptical or negative at his juncture.
- 35. Use of Metro Rail – Positive Response (Based on Occupation, Gender and Age) Of the 91% of the total respondents willing to use the metro upon completion: Among female respondents, Student below the age of 30 (99%) are more interested. Women in Service in the 20-30 age group was more enthusiastic (77%). Women in Household in the age group of 20-45 are more interested in utilizing Metro Rail. Among male respondents, persons belonging to Student and Service in the 20-30 age group are more eager to use Metro Rail, whereas in Business, men in 30-45 age group are more interested.
- 36. Use of Metro Rail – Negative Response (based on Occupation, Gender and Age) Of the 9 % of the total respondents who said they would not use Metro Rail upon commencement: Among female respondents, all Service and Business personnel showed interest in Metro Rail and hence there were no negative responses. Negative responses were from Student below 30 years and in Household 30-45 age group. Among male respondents, Student and Service between 20 years and 30 years and those between 30-45 years in Business suggested that they may not use the Metro Rail. Persons aged between 20 -45 years among males and 30 -45 years among females are major segments that need to be targeted by media campaign along with a separate campaign for students.
- 37. RESPONDENTS’ OPINION ON OPPORTUNITIES FROM METRO RAIL PROJECT TO THE PEOPLE AND THE CITY
- 38. Business Opportunities 72 % of the respondents said that there would be a positive impact while 23% said that there may be a negative impact because of Metro Rail. With regard to increase in reach of their business due to Metro Rail, 69% of the respondents have said that there would be a positive impact and 25% said that there would be negative impact. 5 to 6 % of the respondents in both the cases were unclear about the impact of the metro on their business at this stage.
- 39. Business Opportunities by Metro Rail: Business Improvement People in the income range of Rs 2 lakhs to Rs 8 lakhs and the age group of 20 to 45 feel more negative about the impact than other segments. Respondents in the 30-45 age group in the above Rs. 8 lakhs groups have considerable negative feedback regarding business improvement possibility due to Metro Rail.
- 40. Business Opportunities by Metro Rail: Business Enhanced Reach People in the income range of Rs 2 lakhs to Rs 6 lakhs and the age group of 20 to 60 feel more negative about the impact than other segments. Respondents in the 30-45 age group in the above Rs 8 lakhs age groups have considerable negative feedback regarding business improvement possibility due to Metro Rail. Respondents felt that the presence of barricades has made it hard for most of the customers to walk across the streets and hence customers are buying from shops that are on their side of the road itself. Some were apprehensive as to whether their businesses or shops would be asked to relocate after some time.
- 41. Opportunities created for Service Sector by Metro Rail 82 % of the respondents said that there would be a positive impact while 13% said that there may be a negative impact because of Metro Rail. With regard to increase in reach of their business due to Metro Rail, 90% of the respondents said that there would be a positive impact and 9% said that there would be negative impact or that it was unclear at this stage. 3 to 4 % of the respondents in both the cases were unclear about the impact of the metro on their jobs at this stage. One of the major reasons for the negative impact was the influx of people from other cities and increase in competition.
- 42. Opportunities(Service Sector): Better Job Opportunities People in the income range of Rs 2 lakhs to Rs 4 lakhs and the age group of 20 to 30 feel more negative about the impact than other segments. Respondents in the 45-60 age group in the Rs 2 to Rs 4 lakhs salary segment have considerable negative feedback regarding business improvement possibility due to Metro Rail. Respondents felt that the shortened time taken to travel from Begumpet to areas such as Hi-tech City, where job prospects are higher, would be advantageous to both professionals and job seekers.
- 43. Opportunities (Service Sector): Job Demand They felt that the availability of a safe, fast and comfortable alternative to their present modes of transport would significantly improve their work life balance. It can be observed that respondents from almost all age groups in the service sector believe in the potential of the metro to create job opportunities and demand for jobs. Job seekers felt that the construction of Metro Rail and its associated projects would create demand for job opportunities in numerous fields and would help them in getting employment in their desired fields. Working women expressed that, they hardly have enough time while balancing professional and family responsibilities, and hence with reduced travel time by the metro, it may provide them time for themselves and family.
- 44. Opportunities (Students Group): Daily Life 90 % of the respondents said that there would be a positive impact while 5 % said that there may be a negative impact because of Metro Rail. With regard to increase in reach of their education opportunities due to Metro Rail, 82% of the respondents said that there would be a positive impact and 12% said that there would be negative impact or that it was unclear at this stage. 3 to 4 % of the respondents in both the cases were unclear about the impact of the metro on their education or daily life at this stage. One of the major reasons for the positive impact was the increase in comfort and opportunity to search for classes and jobs over a larger distance.
- 45. Opportunities (Students Group) Daily Life & Greater Reach Students in the above 20 age category are more skeptical about the advantages of Metro Rail. Since long distance travelling college students fall in this category a student campaign targeting them may be beneficial. Students travel some of the largest distances in Hyderabad for going to college, tutorial classes and for recreational activities and hence a faster commute would reduce their travel fatigue and help them spend their time in a more productive manner. They were also optimistic that the advent of the metro would create more job opportunities for the qualified in the future. Tutorial classes far away shall be reachable; female students, in particular, expressed the view that the advent of metro rail might help in making their travel safer and make sure they reach faster to their destinations.
- 46. Opportunities (Household Sector) 97 % of the respondents said that there will be a positive impact while 2 % said that there may be a negative impact because of Metro Rail. One of the major reasons for the positive impact was the increase in comfort and safety. With regard to advantages due to Metro Rail, 97% of the respondents said that there would be a positive impact and 3% said that there would be negative impact or that it is unclear at this stage. About 1 % of the respondents in both the cases were unclear about the impact of the metro on their daily life at this stage.
- 47. Opportunities (Household Sector) Daily Life & Advantages About 95% of the total respondents in the household category, mostly housewives and senior citizens, responded that Metro Rail would significantly improve their daily lives. The major advantages stated by housewives was that they could return quickly however far they went, before their children reached home and that the journeys would be relatively stress free. Around 94% of the respondents, particularly housewives, expressed the view that it would improve the way they travel significantly. They feel the metro may be better, safer and comfortable alternative to their current modes of transport.
- 48. IMPACT ON PEOPLE AND ENVIRONMENT DURING THE CONSTRUCTION PHASE
- 49. 2389 281 12 0 267 746 38 07 0 59 259 35 50 51 0 0 500 1000 1500 2000 2500 3000 TRAFFIC POLLUTION ACCIDENTS ROAD CROSSING Stage 3 – Construction related Issues Based on the opinion of the respondents it was identified that the biggest concerns cited were related to accidents and traffic issues. The respondents expressed this view as because of construction works, barricades and traffic congestion, the number of minor accidents and issues have risen considerably. Traffic stress related issues and pollution also rank as major issues faced by the respondents.
- 50. Stage 3 – Point-wise Response on Loss of Property A total of 84 respondents reported instances of loss of their own property or of people they know. It can be observed from the data that there were respondents from all the eleven points who had witnessed loss of property.
- 51. OVERALL OPINION ON THE METRO RAIL PROJECT
- 52. 81% 82% 52% 88% 18% 16% 48% 12% 1% 2% 0% 1% 0% 10% 20% 30% 40% 50% 60% 70% 80% 90% 100% STUDENT SERVICE HOUSEHOLD BUSINESS YES NO NILL Stage 3 – Temporary Hassles of Mobility Since many of the respondents had expressed concerns regarding the loss of business and traffic issues etc, the interviewers provided information to the respondents to make them carefully analyze the advantages and disadvantages of Metro Rail. About 3/4th of the respondents were ready to face the temporary discomfort during Metro Rail construction even though they had to face losses in their mobility or business opportunities temporarily.
- 53. Stage 3 – Impact of Increase in Awareness 100% 99% 99% 88% 0% 0% 1% 12% 80% 82% 84% 86% 88% 90% 92% 94% 96% 98% 100% 102% STUDENT SERVICE HOUSEHOLD BUSINESS NILL NO YES It can be clearly seen that there has been increase in respondents who believe that Metro Rail would bring improvement to their personal and professional lives. About 98% (except in the case of business sector) of the respondents expressed the view that they were better informed about the metro rail on interaction with the interviewers.
- 54. Most female respondents from Household segment and male respondents from Student and Service segments said that they wish to know more about Metro Rail. Interest levels on Metro Rail (Gender-wise)
- 55. While 75 % of respondents felt that campaign through television (TV) would be their most preferred choice of media for spreading the message, 5 % felt that campaign through Newspaper is preferable over other modes for spreading the message. About 11% preferred the Internet. Preferred Mode of Mass Media
- 56. Preferred Mode of Mass Media (TV): Gender & Age-wise Classification of people who suggested TV as their preferred mode of mass media is as follows: In males the majority belong to the Student and Service segments in the 20- 30 age group. In females, 20-30 years and 30-45 years, are the major age groups, that prefer TV.
- 57. Preferred Mode of Mass Media (Newspaper): Gender & Age-wise Males in Student, Service and Business and persons in the age group 20-45 years in the Household segment prefer Newspapers among different modes of mass media.
- 58. The respondents stated that barricades, pillars and sky walks are going to congest the roads, particularly small and narrow roads, in the future. They feel that construction works may cause more accidents. Almost all of the auto drivers who were interviewed expressed the view that there business might reduce considerably. Although the interviewers explained to them as to how Metro Rail might actually help their business, most of them still are of the opinion that it might cut their business significantly. Loss in road side business options was expressed by both customers and vendors unanimously. Some stated that they might no longer be able to sell in some of the prime areas. Although they were happy about the opportunities that may be created by Metro Rail, they were apprehensive as to how it would be advantageous to them. Some of the respondents expressed the opinion that they have already started experiencing increase in real estate prices in the areas covered by Metro Rail. They stated that the increased prices of the properties is pushing up the rents and making the business unviable in certain scenarios. A few of the respondents expressed concerns that, there might be further shortage in electricity in the state after the advent of the metro. Most of the housewives and senior citizens expressed concerns about the speed and height at which the metro would operate. They were tense about travelling at high speeds at such heights and believe it might be dangerous to senior citizens. The respondents were curious about the parking spots for the metro stations as it seems that they might not be available in all the stations. Apprehensions & Shortcomings Some of the major apprehensions and shortcomings expressed by the respondents are listed below :
- 59. RECOMMENDATIONS An analysis of the modes of transport being used by respondents interviewed during this study, revealed that motorcycles and two wheelers were the most popular among the respondents and that they travelled long distances on them. A media campaign targeting the commuters who use two wheelers would create more inflow of traffic to Metro Rail. Student in 20-30 age group, Service in 20-30 and 30-45 age group, Business in 20-30 and 45-60 age group, Household in the 20-30 age group are the ones more interested in utilizing Metro Rail facilities. Student, Service in 30-45 age group, Business in 30-45 age group and Household in 20- 30 age group need specific media campaigns to address them. Television (TV) and Newspapers stand out as the major modes of mass media preferred by the respondents. Comfort and availability have been pointed out by the commuters as the major reasons while selecting a particular mode of transport. As the metro supersedes most of the current modes of transport in these particular attributes, making this particular aspect more visible in the campaign will be advantageous To reduce the impact and risk from traffic induced stress, pollution and accidents that are identified as major issues faced with the current modes of transport more commuters would opt for Metro Rail. Continued…..
- 60. Internet, Newspapers and Television TV are the major sources of information for most of the respondents to get information regarding Metro Rail. A more elaborate media campaign focusing on media tools would increase the visibility of the project significantly. Although the website of L&T Metro Hyderabad contains most up to date information regarding the project, the inability of majority population to utilize internet is hampering its visibility. In all segments i.e. Business, Service, Student and Household it was identified that most of the respondents were only dwelling on the loss of opportunities and discomfort caused by the construction process. Most of the respondents were not able to visualize the specific advantages and long term impacts of the metro to their lives until the discussions with the investigators. Household respondents are predominantly viewing at Metro Rail as a very important improvement to their lives. They feel that they can spend more time with family by commuting in Metro Rail. They strongly felt that Metro Rail would provide for a safer mode of transport than the current modes of transport. A very common point raised by females from most of the categories was the need for separate female bogies if it could be possible. RECOMMENDATIONS…..Continued