SlideShare ist ein Scribd-Unternehmen logo
1 von 12
Downloaden Sie, um offline zu lesen
Shivaprasad H et al Int. Journal of Engineering Research and Applications www.ijera.com 
ISSN : 2248-9622, Vol. 4, Issue 7( Version 1), July 2014, pp.112-123 
www.ijera.com 112 | P a g e 
A Study on Physico-Chemical Characteristics of Borewell Water In Sugar Town, Mandya City, Karnataka State, India Shivaprasad H1 , Nagarajappa D P2 , Sham Sundar K M3 1Post Graduate Student, Department of Studies in Civil Engineering, University BDT College of Engineering, Davangere-5770 04, India 2Professor, Department of Studies in Civil Engineering, University BDT College of Engineering, Davangere- 5770 04, India 3Professor, Department of Studies in Civil Engineering, University BDT College of Engineering, Davangere- 5770 04, India Abstract Groundwater is a natural resource for drinking water .In addition to the population growth, urbanization and industrialization also extend the demand of water. Providing safe drinking water supply to the ever growing urban and sub-urban population is going to be a challenge to the civil authorities, city planners, policy makers and environmentalists. Groundwater is a major source of drinking water in both urban and rural areas of Mandya. Mandya city is rapidly raising population, changing lifestyle and intense competition among users- agriculture, industry and domestic sectors is driving the groundwater table lower. Besides, discharge of untreated wastewater through bores and leachate from unscientific disposal of solid wastes also contaminate groundwater, thereby reducing quality of fresh water resources. 
The present work is aimed at assessing the water quality index for the ground water samples of Sugar town, Mandya city. The groundwater samples of about 40 samples were collected and subjected for a comprehensive physicochemical analysis. The purposes of this investigation are to provide an overview of present ground water quality for the following 12 parameters such as pH, total hardness, calcium, magnesium, chloride, nitrate, sulphate, total dissolved solids, iron, fluoride, alkalinity are to be considered for calculating the WQI. The results are analyzed by WQI method for predicting water quality. Water Quality Index (WQI) is a very useful and effective way for assessing the quality of water. WQI is a very useful tool for communicating the information on overall quality of water. Keywords: Groundwater, Water quality standards, Water quality characteristics, Water quality index. 
I. Introduction 
Groundwater is used for domestic, industrial, water supply and irrigation all over the world. In the last few decades, there has been a tremendous increase in the demand for fresh water due to rapid growth of population and the accelerated pace of industrialization. Human health is threatened by unsanitary conditions through open drain carrying and disposing wastewater into natural water bodies. Rapid urbanization, especially in developing countries like India, has affected the availability and quality of groundwater due to its overexploitation and improper waste disposal, especially in urban areas. According to WHO organization, about 80% of all the diseases in human beings are caused by water. Water quality index is one of the most effective tools to communicate information on the quality of water to the concerned citizens and policy makers. It, thus, becomes an important parameter for the assessment and management of groundwater. WQI is defined as a rating, reflecting the composite influence of different water quality parameters. WQI is calculated from the point of view of the suitability of groundwater for human consumption. The objective of the present work is to discuss the suitability of groundwater for human consumption based on computed, groundwater characteristics, quality assessment and water quality index values. 
II. Materials and Methods 
2.1 Description of the study area 
Mandya district is lies between North latitude 12013‟ to 13004‟ and East longitudes 76019‟ to 77020‟ and is bounded on northwest by Hassan district, on the north and northeast by Tumkur district, on the east by Ramanagar district and south by Mysore and Chamarajnagar district. Total geographical area of the district is 4961 Sqkms. The city is situated at an elevation of 669.47 m above MSL.The district is divided into seven taluks coming under two subdivisions (Mandya and Pandavapura). The Mandya subdivision comprises Mandya, Maddur and Malavalli taluks. The Pandavapura subdivision 
RESEARCH ARTICLE OPEN ACCESS
Shivaprasad H et al Int. Journal of Engineering Research and Applications www.ijera.com 
ISSN : 2248-9622, Vol. 4, Issue 7( Version 1), July 2014, pp.112-123 
www.ijera.com 113 | P a g e 
comprises of Pandavapura, Srirangapattana, Nagamangala and K.R.Pet taluks. 2.2 Population growth and density As per provisional reports of Census India, population of Mandya in 2011 is 1,37,735; of which male and female are 68,748 and 68,987 respectively. The sex ratio of Mandya city is 1003 per 1000 males. In education section, total literates in Mandya city are 105,938 of which 55,442 are males while 50,496 are females. Average literacy rate of Mandya city is 85.11 percent of which male and female literacy was 89.54 and 80.74 percent. Total children (0-6) in Mandya city are 13,269 as per figure from Census India report on 2011. There were 6,826 boys while 6,443 are girls. Child sex ratio of girls is 944 per 1000 boys. In Mandya city more than 99% of the population speaks Kannada. Mandya City Municipality Council (CMC) is spread up to 17.03 Sq.km in which 1, 37,735 persons reside. The population density on an average in 8,629 per Sq.km which is thickly populated and the city is developing steadily; the projected population growth in the CMC is given in the Table2.1. Since the city is the district head quarter the floating population is moderate and works out to be 15000 per day. Table3.2 shows details of ward wise population distribution and there components, these details will be use full to design solid waste management system. 2.3 Geomorphology 
The district is located in the southern maiden region of the state. The surface topography is in the form of undulating plain situated at an average elevation of 750- 900m above MSL. There are few sporadic out crops of rocks as hills and few fertile shallow valleys. In the south-eastern part of the district the Biligirirangana hill ranges extending from Mysore District tapers off here. In this portion Cauvery river breaks through the hill ranges and forms the famous Gaganachukki and Barachukki waterfalls. The Melukote range of hills fallen a broken series of conspicuous peaks, which reach the altitude of 1159m above MSL, 1064m above MSL, 1050m above MSL and 1046m above MSL.The Hulikere-Kartigatta hill range near S.R.Patna and bold rugged low peaks near Sindhugatta are also conspicuous. The general slope in the district is in southeast direction. 2.4 Groundwater sampling in the Study area Careful planning and preparation of a groundwater- sampling trip was made to save time and help reduce the number of difficulties that commonly occur with fieldwork. Correct sampling procedure begins with thorough preparation in the office and laboratory before sample collection. Each sample bottle is to be thoroughly cleaned and protected from any contamination during sample collection, preservation, and shipment to assure a high quality sample. Filtering equipment is to be rinsed thoroughly to remove any mineral deposits in hoses or support container vessels. The sample containers and hoses for organic analyses are to be acid-washed and rinsed several times with deionised water. Grab sampling has been adopted to collect groundwater samples. 40 groundwater samples were collected in polythene containers of 2 litres capacity for chemical analysis after pumping out sufficient quantity of water from the source such that, the sample collected served as a representative sample. The samples thus collected were transported to the laboratory condition. 2.5 Analysis of Groundwater Samples 
The groundwater quality was assessed by the analysis of chemical parameters such as pH, Electrical Conductivity, Total Dissolved Solids, Alkalinity, Chlorides, Total Hardness, Calcium Hardness, Nitrates, Sulphates, Iron and Fluorides. The Bureau of Indian Standards (BIS) for drinking water quality for various parameters is presented in the table 2.The analytical methods used to measure chemical parameters of groundwater samples collected from all the sampling stations are listed in the table 1.The water samples were analysed adopting standard methods in the Environmental Laboratory.
Shivaprasad H et al Int. Journal of Engineering Research and Applications www.ijera.com 
ISSN : 2248-9622, Vol. 4, Issue 7( Version 1), July 2014, pp.112-123 
www.ijera.com 114 | P a g e 
MANDYA DISTRICT, KARNATAKA LOCATION,INDIA (NOT FOR SCALE) 
SUGAR TOWN AREA 
Figure 2.1: Layout of Sugar town area, Mandya city.
Shivaprasad H et al Int. Journal of Engineering Research and Applications www.ijera.com 
ISSN : 2248-9622, Vol. 4, Issue 7( Version 1), July 2014, pp.112-123 
www.ijera.com 115 | P a g e 
2.6 Physico-Chemical analysis of groundwater samples: All the reagents used were of analytical grade and solutions were made of distilled water. Various water quality parameters such as alkalinity, hardness, chlorides etc., were determined using standard analytical methods and procedures (table-1). The instruments used were calibrated before use for observing readings. The repeated measurements were made to ensure precision and accuracy of results Table 1: Methods Used for Groundwater analysis (Laboratory analytical methods) 
Sl.No 
Physico-chemical Parameters 
Methods 
1 
pH 
Potentiometry (pH meter) 
2 
Conductivity 
Conductivity probe 
3 
Alkalinity 
Argentometry (Titration) 
4 
Chloride 
Argentometry (Titration) 
5 
Total Hardness 
Complexometry by EDTA titration 
6 
Calcium 
Argentometry (Titration) 
7 
Magnesium 
Argentometry (Titration) 
8 
Total Dissolved Solids 
TDS Probe 
9 
Fluoride 
Ion Analyser 
10 
Iron 
Spectrophotometry 
11 
Nitrate 
Spectrophotometry 
12 
Sulphate 
Spectrophotometry 
Table 2: Bureau of Indian Standards (BIS) for drinking water (IS 10500: 2003) 
Sl. No. 
Characteristics 
Desirable limit 
Permissible limit 
1 
Colour, (Hazen units) 
5 
25 
2 
Odour 
Unobjectionable 
Unobjectionable 
3 
Taste 
Agreeable 
Agreeable 
4 
pH value 
6.5-8.5 
No relaxation 
5 
Total hardness (mg/l as CaCO3) 
300 
600 
6 
Iron (Fe), mg/l 
0.3 
1.0 
7 
Manganese 
0.1 
0.3 
(Mn), mg/l 
8 
Chloride, mg/l 
250 
1000 
9 
Total dissolved solids, mg/l 
500 
2000 
10 
Calcium, mg/l 
100 
200 
11 
Sulphate, mg/l 
200 
400 
12 
Nitrate, mg/l 
45 
100 
13 
Fluoride, mg/l 
- 
1.5 
14 
Alkalinity, mg/l 
200 
600 
15 
Mercury, mg/l 
0.001 
- 
16 
Cadmium, mg/l 
0.01 
- 
17 
Lead, mg/l 
0.05 
- 
18 
Zinc, mg/l 
5 
15 
III. Results and Discussions 
In this chapter for the purpose of revealing the water quality of 40 bore wells of covering the study area have been established by determining the physical and chemical characteristics as per standard methods4. They have been listed systematically and represented in table2. The parameters viz., pH, total dissolved solids and Electrical conductivity know the physical characteristics of the ground water under the study area. The chemical characteristics of the ground water under the study area are known by the parameters viz., total hardness, calcium hardness, magnesium hardness, iron, fluoride, nitrate, chloride, sulfate, and alkalinity. 
The pH of the groundwater samples are neutral or close to it as they all range from 6.45 to 7.89 which are within the permissible limits 6.5- 8.5 given by Indian Standards, also complies with standard 0f 7.0-8.0 given by WHO17. One of the main objectives in controlling pH is to produce water that minimizes corrosion or incrustation. These processes, which can cause considerable damage to the water supply systems, result from complex interactions between pH and other parameters, such as dissolved solids, dissolved gases, hardness, alkalinity, and temperature. The variation of pH in the study period is shown figure 3.1
Shivaprasad H et al Int. Journal of Engineering Research and Applications www.ijera.com 
ISSN : 2248-9622, Vol. 4, Issue 7( Version 1), July 2014, pp.112-123 
www.ijera.com 116 | P a g e 
Figure 3.1: pH- Hydrogen ion concentration variations during the study period 
The Conductivity of the groundwater in Sugar town, Mandya city ranges from 585-1109μs/cm. Conductivity itself is not a human or aquatic health concern, but because it is easily measured, it can serve as an indicator of other water quality problems. Water with high mineral content tends to have higher conductivity, which is a general indication of high dissolved solid concentration of the water10. Therefore, conductivity measurements can be used as a quick way to locate potential water quality problems. The variation of Electrical conductivity in the study period is shown figure 3. 
Total dissolved solids level in ground water is 359-665 mg/L which exceeds the permissible limit of 500 mg/L as per Indian standards and 1000 mg/l as per WHO Standards. The term total dissolved solids refer mainly to the inorganic substances that are dissolved in water. The effects of TDS on drinking water quality depend on the levels of its individual components; excessive hardness, taste, mineral depositions and corrosion are common properties of highly mineralized water. 
The variation of total dissolved solids in the study period is shown figure 3.2. 
Figure 3.2: EC- Electrical conductivity, TDS- Total dissolved solids concentration variations during the study period 
Total Hardness varies from 255-410 mg/l as CaCO3. The hardness values for the study area are found to be hard for almost all locations and determined to fall higher edge of the desirable limit 
0 
1 
2 
3 
4 
5 
6 
7 
8 
9 
1 
3 
5 
7 
9 
11 
13 
15 
17 
19 
21 
23 
25 
27 
29 
31 
33 
35 
37 
39 
Concentrated variations 
Sample locations 
pH 
pH 
0 
200 
400 
600 
800 
1000 
1200 
1 
3 
5 
7 
9 
11 
13 
15 
17 
19 
21 
23 
25 
27 
29 
31 
33 
35 
37 
39 
Concentration variations 
Sample locations 
EC, μS/cm 
TDS, ppm
Shivaprasad H et al Int. Journal of Engineering Research and Applications www.ijera.com 
ISSN : 2248-9622, Vol. 4, Issue 7( Version 1), July 2014, pp.112-123 
www.ijera.com 117 | P a g e 
of WHO specification and Indian standards. According to Sawyer and McCarty‟s classification for hardness, water samples collected from study area are falls under the hard class 28.21%. The variation of total alkalinity and total hardness in the study period is shown figure 3.3. Hardness is caused by polyvalent metallic ions dissolved in water, which in natural water are principally magnesium and calcium. So the adverse effects of such hard water are i. Soap consumption by hard water cause economic loss to water, ii. MgSO4 has laxative effects in person unaccustomed to it, iii. precipitation by hard water adhere to the surface of tubs and sinks and may stain clothing, dishes and other items1 Table-3: Classification of water based on hardness by Sawyer and McCarthy 
Hardness as CaCO3 (mg/l) 
Water quality 
Percent 
0-75 
Soft 
10.26 
75-150 
Moderately hard 
33.33 
150-300 
Hard 
28.21 
Above 300 
Very hard 
28.21 
Alkalinity of the samples are in the range of 352-465 mg/L. The alkalinity levels of all the water samples are high thus, resisting acidification of the groundwater samples. The variation of total alkalinity and total hardness in the study period is shown figure 4 
Figure 4: TH- Total Hardness, TA- Total Alkalinity variations during the study period 
The presence of calcium in water results from its passage through the deposits of limestone, dolomite, gypsum and other calcium bearing rocks. Calcium contributes to the total hardness of water and is an important micro nutrient in aquatic environment. Small concentrations of calcium carbonate prevent corrosion of metal pipes by laying down a protective coating. But increased concentration of calcium precipitates on heating to form harmful scales in boilers, pipes and utensils. As per BIS and WHO standards, the permissible limit for calcium is 200 mg/l. In the present study, the groundwater samples have calcium concentration varying from 48-84.8 mg/l. Variation of calcium in the study area is shown in the figure 5 
Magnesium is one of the abundant elements in the earth„s crust, It is found in all natural waters and its source lies in rocks. It is an important element contributing to hardness and a necessary constituent of chlorophyll. High concentrations of magnesium reduce utility of water for domestic use, while a concentration above 500mg/l imparts an unpleasant taste to water and renders it unfit for drinking. As per IS 10500: (2003), the desirable limit of magnesium is 30 mg/l and permissible limit is 100 mg/l. In the present study, the groundwater samples have magnesium concentration varying from 32.80-52.08 mg/l. Variations of Magnesium in the study area is shown in the figure 5. 
0 
50 
100 
150 
200 
250 
300 
350 
400 
450 
500 
1 
3 
5 
7 
9 
11 
13 
15 
17 
19 
21 
23 
25 
27 
29 
31 
33 
35 
37 
39 
Concentration variations 
Sample locations 
TH,mg/L 
TA, mg/L
Shivaprasad H et al Int. Journal of Engineering Research and Applications www.ijera.com 
ISSN : 2248-9622, Vol. 4, Issue 7( Version 1), July 2014, pp.112-123 
www.ijera.com 118 | P a g e 
Figure 5: Ca- Calcium, Mg- Magnesium variations during the study period 
Chloride present in ground water samples are in the range of 80.12-120.12 mg/l, which exceeds the permissible limit of 250 mg/l as per Indian standards as well as WHO Standards and this obviously affects the taste of the water. Similarly study of Chemical characteristics of groundwater in and around Sugar town, Mandya city chloride content is beyond the permissible limit24. This occurs may be due to saline water intrusion. Chloride is a widely distributed element in all types of rocks in one or the other form. Its affinity towards sodium is high. Therefore, its concentration is high in ground waters, where the temperature is high and rainfall is less. Soil porosity and permeability also has a key role in building up the chlorides concentration17. The variation of Chlorides in the study period is shown figure 6 
Sulphate concentration in collected groundwater samples is ranged from 69.1-183 mg/l as in the permissible limit of 200mg/l as per Indian standards and 250mg/l as per WHO Standards. Health concerns regarding sulphate in drinking water have been raised because of reports that diarrhoea may be associated with the ingestion of water containing high levels of sulphate. The variation of Sulphate in the study period is shown figure 6 
Figure 6: Cl- Chloride, SO4- Sulphate variations during the study period 
In the groundwater of Sugar town, Mandya City, Nitrate is varies from 6.20-8.45 mg/l which complies with the permissible limit of 45 mg/l as per Indian standards and 50 mg/L as per WHO Standards. Nitrates themselves are relatively non-toxic. Nitrogen essential component of amino acids, and therefore all proteins and nucleic acids, and therefore needed for all cell division and reproduction. The formation of 
0 
10 
20 
30 
40 
50 
60 
70 
80 
90 
1 
3 
5 
7 
9 
11 
13 
15 
17 
19 
21 
23 
25 
27 
29 
31 
33 
35 
37 
39 
Concentration variations 
Sample locations 
Ca2+,mg/L 
Mg2+,mg/L 
0 
20 
40 
60 
80 
100 
120 
140 
160 
180 
200 
1 
3 
5 
7 
9 
11 
13 
15 
17 
19 
21 
23 
25 
27 
29 
31 
33 
35 
37 
39 
Concentration variations 
Sample locations 
Cl-,mg/L 
SO42-,mg/L
Shivaprasad H et al Int. Journal of Engineering Research and Applications www.ijera.com 
ISSN : 2248-9622, Vol. 4, Issue 7( Version 1), July 2014, pp.112-123 
www.ijera.com 119 | P a g e 
nitrates is an integral part of the nitrogen cycle in our environment. Nitrate levels above 45 mg/l NO3 may cause methemoglobinemia (Blue baby disease) in infants .Sources of nitrate contamination in Sugar town, Mandya city may include septic tanks and municipal sewage treatment systems. The ability of nitrate to enter well water depends on the type of soil and bedrock present, and on the depth and construction of the well13.The variation of Nitrate in the study period is shown figure7 
Figure 7: NO3- Nitrate variations during the study period 
The levels of Flouride in the groundwater samples ranged from 0.60-0.72 mg/l which are within the permissible limit of 1 mg/l as per Indian standards as well as WHO Standards. The variation of fluoride is dependent on a variety of factors such as amount of soluble and insoluble fluoride in source rocks, the duration of contact of water with rocks and soil temperature, rainfall, oxidation- reduction process12. The presence of small quantities of fluoride in drinking water may prevent tooth decay. Fluoride is poisonous at high levels, and while dental fluorosis is easily recognized, skeletal damage may not be clinically obvious until advanced stages have occurred. Often, ground waters will contain more than 1.0 ppm, and in these cases, the water should probably be deflouridated for drinking. The variation of Fluoride in the study period is shown figure 8 
Iron concentration of groundwater samples in the study area are varies from 0.32-0.56 mg/L and The Bureau of Indian Standards has recommended 0.3 mg/l as the desirable limit and 1.0 mg/L as the maximum permissible limit for iron in drinking water (BIS, 1991). Hence it is within the permissible limit. The ground water samples exhibited high Iron contamination which is an indication of the presence ferrous salts that precipitate as insoluble ferric hydroxide and settles out as rusty silt. High concentration of iron is may contributed by industrial estate located at the sampling site, Iron is an essential element in human nutrition. Toxic effects have resulted from the ingestion of large quantities of iron, but there is no evidence to indicate that concentrations of iron commonly present in food or drinking water constitute any hazard to human health. At concentrations above 0.3 mg/l, iron can stain laundry and plumbing fixtures and cause undesirable tastes. Iron may also promote the growth of certain microorganisms, leading to the deposition of a slimy coat in piping14 .The variation of Iron in the study period is shown figure 8 
0 
1 
2 
3 
4 
5 
6 
7 
8 
9 
10 
1 
3 
5 
7 
9 
11 
13 
15 
17 
19 
21 
23 
25 
27 
29 
31 
33 
35 
37 
39 
Concentration variations 
Sample locations 
NO32-,mg/L
Shivaprasad H et al Int. Journal of Engineering Research and Applications www.ijera.com 
ISSN : 2248-9622, Vol. 4, Issue 7( Version 1), July 2014, pp.112-123 
www.ijera.com 120 | P a g e 
Figure 8: F- Fluoride, Fe- Iron variations during study period Table-4: Comparison of groundwater quality with drinking water standards, Indian and WHO 
Parameters 
Indian Standard 
Percentage compliance 
WHO Standard 
pH 
6.5-8.5 
100 
7.0-8.0 
TH, mg/L 
300 
100 
100 
Ca2+ ,mg/L 
75 
0 
75 
Mg2+,mg/L 
30 
100 
30 
Cl- , mg/L 
250 
100 
250 
TDS, ppm 
500 
100 
1000 
Fe, mg/L 
0.3 
83 
0.1 
F, mg/L 
1.0 
100 
1.0 
NO32,mg/L 
45 
100 
50 
SO42,mg/L 
200 
100 
250 
TA, mg/L 
200 
100 
- 
Table 5 : Groundwater physico-chemical characteristics of Sugar town, Mandya city 
Sample no 
pH 
EC μs/cm 
TDS ppm 
TH mg/l 
Ca2+ mg/l 
Mg2+ mg/l 
Cl mg/l 
TA mg/l 
F mg/l 
Fe mg/l 
NO32- mg/l 
SO42- mg/l 
B1 
6.85 
979 
587 
312 
67.2 
36.48 
90.12 
352 
0.69 
0.56 
8.11 
98.9 
B2 
7.11 
888 
533 
266 
48.4 
34.8 
82.01 
376 
0.6 
0.37 
7.98 
89.5 
B3 
6.89 
912 
547 
298 
52 
40.32 
89.87 
344 
0.65 
0.44 
6.2 
95.3 
B4 
7.45 
1109 
665 
333 
67.6 
39.36 
95.85 
349 
0.67 
0.52 
6.66 
98.7 
B5 
7.32 
998 
599 
319 
66 
36.96 
93.84 
366 
0.66 
0.56 
6.99 
152 
B6 
7.01 
645 
387 
373 
70 
47.52 
104.58 
385 
0.69 
0.38 
7.01 
168 
B7 
7.56 
698 
419 
380 
74.4 
46.56 
123 
400 
0.7 
0.42 
7.77 
175 
B8 
6.98 
801 
481 
300 
48.8 
42.72 
124.2 
340 
0.6 
0.56 
7.98 
183 
B9 
6.45 
777 
466 
268 
48 
35.52 
90.14 
370 
0.62 
0.5 
8.02 
98.7 
B10 
6.55 
613 
368 
287 
50.4 
38.64 
92.42 
379 
0.64 
0.48 
8.18 
150.6 
B11 
6.98 
599 
359 
255 
47.2 
32.88 
80.12 
345 
0.67 
0.42 
8.44 
95.8 
B12 
6.77 
800 
480 
269 
48.4 
35.52 
82.32 
370 
0.7 
0.32 
8.45 
85.2 
B13 
6.85 
666 
400 
302 
51.6 
41.52 
118.2 
344 
0.68 
0.38 
8.13 
74.5 
0 
0.1 
0.2 
0.3 
0.4 
0.5 
0.6 
0.7 
0.8 
1 
3 
5 
7 
9 
11 
13 
15 
17 
19 
21 
23 
25 
27 
29 
31 
33 
35 
37 
39 
Concentration variations 
Sample locations 
F,mg/L 
Fe,mg/L
Shivaprasad H et al Int. Journal of Engineering Research and Applications www.ijera.com 
ISSN : 2248-9622, Vol. 4, Issue 7( Version 1), July 2014, pp.112-123 
www.ijera.com 121 | P a g e 
B14 
7.01 
713 
428 
333 
54 
47.52 
95.84 
352 
0.62 
0.49 
6.88 
72.6 
B15 
7.11 
798 
479 
364 
66.4 
47.52 
103.1 
395 
0.61 
0.53 
8.02 
70.9 
B16 
7.23 
733 
440 
290 
49.6 
39.84 
91.9 
333 
0.66 
0.36 
7.12 
76.2 
B17 
7.56 
658 
395 
369 
67.6 
48 
120.2 
399 
0.7 
0.41 
5.54 
84.6 
B18 
7.65 
698 
419 
348 
55.6 
50.16 
101 
402 
0.72 
0.51 
8.54 
98 
B19 
7.89 
623 
374 
316 
53.2 
43.92 
98.89 
360 
0.65 
0.56 
6.54 
85.1 
B20 
6.85 
705 
423 
288 
48 
40.32 
82.28 
364 
0.61 
0.48 
7.54 
84.6 
B21 
6.55 
789 
473 
299 
49.6 
42 
84.32 
342 
0.65 
0.32 
7.01 
86.8 
B22 
6.45 
585 
351 
321 
52 
45.84 
85.58 
358 
0.69 
0.39 
7.77 
79.3 
B23 
6.33 
599 
359 
354 
63.6 
46.8 
88.25 
398 
0.7 
0.45 
8.15 
69.1 
B24 
6.85 
701 
421 
400 
84 
45.6 
120 
450 
0.63 
0.51 
8.02 
86.2 
B25 
6.42 
658 
395 
368 
67.6 
47.76 
94.25 
389 
0.6 
0.55 
8.33 
84.9 
B26 
6.75 
988 
593 
321 
54 
44.64 
95.25 
360 
0.66 
0.49 
8.45 
97.34 
B27 
7.06 
1025 
615 
268 
48 
35.52 
82.01 
362 
0.69 
0.45 
8.66 
84.5 
B28 
7.45 
598 
359 
279 
50 
36.96 
84.23 
368 
0.72 
0.33 
7.55 
89.2 
B29 
7.33 
912 
547 
299 
49.2 
42.24 
86.96 
375 
0.71 
0.48 
7.96 
79.8 
B30 
7.66 
888 
533 
312 
51.6 
43.92 
84.36 
382 
0.68 
0.56 
6.66 
76.2 
B31 
7.84 
645 
387 
354 
64 
46.56 
95.25 
400 
0.6 
0.52 
6.54 
85.6 
B32 
7.65 
633 
380 
387 
68 
52.08 
102.3 
421 
0.66 
0.49 
6.12 
116 
B33 
6.45 
655 
393 
395 
71.6 
51.84 
111.1 
435 
0.63 
0.46 
6.09 
80.35 
B34 
6.66 
1000 
600 
410 
75.2 
53.28 
120.2 
465 
0.61 
0.43 
7.87 
123 
B35 
6.85 
987 
592 
265 
47.8 
35.28 
88.25 
360 
0.62 
0.4 
7.68 
99.8 
B36 
6.39 
658 
394 
284 
49.2 
38.64 
89.98 
355 
0.66 
0.46 
7.95 
106.8 
B37 
6.49 
845 
507 
302 
51.6 
41.52 
91.25 
350 
0.67 
0.39 
8.01 
94.12 
B38 
7.04 
888 
533 
333 
52.8 
48.24 
94.25 
375 
0.69 
0.51 
8.02 
136 
B39 
6.94 
869 
521 
400 
84.8 
45.12 
115.2 
465 
0.7 
0.48 
7.12 
142 
B40 
7.28 
1021 
613 
270 
48 
36 
82.25 
343 
0.6 
0.39 
7.65 
99.89 
Where B indicates borewell water 
Estimation of Water Quality Index (WQI) 
For computing WQI three steps are followed. In the first step, each of the all parameters has been assigned a weight (wi) according to its relative importance in the overall quality of water for drinking purposes (table-7). The maximum weight of 5 has been assigned to the parameter nitrate due to its major importance in water quality assessment. Magnesium which is given the minimum weight of 1 as magnesium by itself may not be harmful. In the second step, the relative weight (Wi) is computed from the following equation: 
..…………………….(1) Where, Wi is the relative weight, wi is the weight of each parameter and n is the number of parameters. Calculated relative weight (Wi) values of each parameter are also given in table-7
Shivaprasad H et al Int. Journal of Engineering Research and Applications www.ijera.com 
ISSN : 2248-9622, Vol. 4, Issue 7( Version 1), July 2014, pp.112-123 
www.ijera.com 122 | P a g e 
In the third step, a quality rating scale (qi) for each parameter is assigned by dividing its concentration of each water sample by its respective standard according to the guideline laid down in the BIS 10500 and the result is multiplied by 100. 
…..……………………(2) Where, qi is the quality rating, Ci is the concentration of each chemical parameter of each water sample in mg/l,Si is the sta ndard value for each chemical parameter, mg/l according to the guidelines of BIS (BIS 10500-1991). For computing the WQI, the sub index SI is first determined for each chemical parameter, which is then used to determine the WQI using the following equation SIi = Wi * qi ...........…………………………... (3) 
………………………………….(4) Where, SIi is the sub index of Ith parameter, qi is the rating based on concentration of ith parameter and n is the number of parameter. The computed WQI values are classified into five types and are as shown in table no. 6 Table 6: Water quality classification based on WQI value 2, 1 
WQI Value 
Water Quality 
<50 
Excellent 
50-100 
Good 
100-200 
Poor 
200-300 
Very poor 
>300 
Water Unsuitable for drinking 
Table 7: Relative weight (Wi) of each parameters 
Sl. Nos 
Parameters 
Indian Standards 
Weightage (wi) 
Relative Weight (Wi) 
Quantity Rating (qi) 
Sub Index (SIi) 
1 
pH 
6.5-8.5 
4 
0.0952 
82.47 
7.85 
2 
EC, μS/cm 
2000 
4 
0.0952 
39.19 
3.73 
3 
TDS, ppm 
500-1500 
4 
0.0952 
23.51 
2.23 
4 
TH, mg/l 
300-600 
3 
0.071 
53.7 
3.81 
5 
Ca2+ , mg/l 
75-200 
2 
0.0476 
28.95 
1.37 
6 
Mg2+ , mg/l 
30-100 
2 
0.0476 
42.6 
2.02 
7 
Fe, mg/l 
0.3-1.0 
4 
0.0952 
45 
4.28 
8 
TA, mg/l 
200-600 
3 
0.071 
62.8 
4.45 
9 
Cl- , mg/l 
250-1000 
3 
0.071 
9.63 
0.68 
10 
F, mg/l 
1-1.5 
4 
0.0952 
43.33 
4.12 
11 
NO32- , mg/l 
45-100 
5 
0.119 
7.54 
0.89 
12 
SO42- , mg/l 
200-400 
4 
0.0952 
25.32 
2.41 
wi=42 
Wi=0.998 
qi=464.04 
WQI=37.84 
Hence, WQI for the groundwater samples from the study area is 37.84 
IV. Conclusions 
After the careful study of analysis, interpretation and discussions of the numerical data following conclusions have been drawn for the ground water of Sugar town, Mandya city. The groundwater is crystal clear, odorless, and palatable. Most of the bore wells yield potable water with moderate mineral or dissolved salts. Water is soft in almost all the sampling points. As there is no considerable increase in chloride and sulphate, it shows that there is no possible contamination of groundwater due to percolation of polluted surface water. The concentration of nitrate and fluoride in the entire Sugar town, Mandya City is well within the
Shivaprasad H et al Int. Journal of Engineering Research and Applications www.ijera.com 
ISSN : 2248-9622, Vol. 4, Issue 7( Version 1), July 2014, pp.112-123 
www.ijera.com 123 | P a g e 
permissible limit. The hardness is reported, it is by calcium itself, which is also little higher than the permissible limits. Scaling of utensils, household boilers have been reported by survey. It has been revealed by the analysis that industrial effluents have negative effect on the quality of ground water of Sugar town, Mandya City. The water quality index (WQI) falls in the Excellent Range and hence the ground water of Sugartown, Mandya city is as considered as Excellent. The analysis reveals that the groundwater of the area, needs certain degree of treatment before consumption (at least disinfection), and it also needs to be protected from the perils of contamination. 
V. Acknowledgement 
Thanks to the principals, HOD‟s,and guide of UBDT‟s davanagere, for encouragement and support. References [1] Mangukiya R., Bhattacharya T., and Chakraborty S (2012),“Quality Characterization of Groundwater using Water Quality Index in Surat city, Gujarat, India”, International Research Journal of Environment Sciences, 1(4): 14-23 [2] Nagarajappa D P., Rajappa B., Manjappa s., and Puttaiah E T., (2011), “Physico chemical analysis of underground water of Harihara taluk of Davanagere district, Karnataka, India”, Advances in applied science research, 2(5): 143-150 [3] Shivasharanappa., Srinivas P., and Mallikarjun Huggi S (2011), “Assessment of ground water quality characteristics and Water Quality Index (WQI) of Bidar city and its industrial area, Karnataka State, India”, International journal of environmental sciences, 2(2): 965-976 [4] APHA, American Public Health Association (2003), standard method for examination of water & wastewater specifications, Washington DC, 6, 19th Edition. [5] Bureau of Indian Standards, 1993, (IS 10500:1991), Edition 2.1 [6] WHO (World Health Organization) Guidelines for drinking water quality (1993), second edition, Vol. 1, 188. [7] Shivasharanappa., Srinivas P., and Mallikarjun Huggi S (2011), “Study on physic-chemical characterictics of ground water of Bidar city and its Industrial area”, International journal of applied biology and pharmaceutical technology, 3(1): 359-367 
[8] Nirdosh P, Ahmed A, Sureshbabu H, Kottureshwar N M, Jayashree M., and Nijalingappa J. (2010), “Study on the PhysicoChemical characteristics of ground water of Gulbarga City (Karnataka)” International Journal of Applied Biology & Pharmaceutical Technology, 1(2): 519 [9] Mumtazuddin S., Azad A.K., Bharti P and Ranjan R (2012) “Physico-chemical analysis of groundwater of the Budhi Gandak belt in Muzaffarpur district, India”, International Research Journal of Environment Sciences, 1(1): 7-11 [10] Patil Shilpa G., Chonde Sonal G., Jadhav Aasawari S. and Raut Prakash D (2012) “Impact of Physico-Chemical Characteristics of Shivaji University lakes on Phytoplankton Communities, Kolhapur, India”, Research Journal of Recent Sciences, 1(2):56-60 [11] Rajiv P., Hasna Abdul Salam, Kamaraj M., Rajeshwari Sivaraj and Sankar A, I. (2012), ‟Physico Chemical and Microbial Analysis of Different River Waters in Western Tamil Nadu, India, International Research Journal of Environmental Science., 1(1): 2-6 [12] Patel Payal and Bhatt S.A(2010)., “Fluoride Contamination in Groundwater of Patan District, Gujarat, India International Journal of Engineering Studies, 1(2), 171– 177 [13] Abati T (2005)., “Water Sources and treatment, food forum”, A publication of the Nigeria Institute of food science and Technology (NIFST), 4(1): 49 [14] Iyer C.S., Sindhu M., Kulkarni S.G., Tambe S.S. and Kulkarni B.D (2003), “Statistical analysis of the physico-chemical data on the coastal waters of Cochin”, Journal of Environmental Monitoring, 2(5): 324 [15] Sawyer G.N., Carthy Mc D.L (1967) ., Chemistry of sanitary Engineers, 2ndEd., McGraw Hill, New York, 1(2): 518 [16] Neeraj D., Dr. Patel J.N (2010), “Evaluation of Groundwater Quality Index of the Urban Segments of Surat City, India”, International journal of geology, 2(4):58-62 [17] Raval V.H., and Malik G.H (2010), “Physico- Chemical Characteristics of Groundwater in and around Surat City (India)”, Journal of Environmental Science and Engineering, 52(4):43-348 .

Weitere ähnliche Inhalte

Was ist angesagt?

Water-Balance-Pakistan
Water-Balance-PakistanWater-Balance-Pakistan
Water-Balance-Pakistan
Raza Farrukh
 
Priority of Water Supply Service for Community in Gresik City, East Java Prov...
Priority of Water Supply Service for Community in Gresik City, East Java Prov...Priority of Water Supply Service for Community in Gresik City, East Java Prov...
Priority of Water Supply Service for Community in Gresik City, East Java Prov...
Agriculture Journal IJOEAR
 
Characterization of Wastewater in Rajouri Town, Jammu And Kashmir, India
Characterization of Wastewater in Rajouri Town, Jammu And Kashmir, IndiaCharacterization of Wastewater in Rajouri Town, Jammu And Kashmir, India
Characterization of Wastewater in Rajouri Town, Jammu And Kashmir, India
IJERA Editor
 
Accessibility and Physicochemical Properties of Water for Domestic Purposes i...
Accessibility and Physicochemical Properties of Water for Domestic Purposes i...Accessibility and Physicochemical Properties of Water for Domestic Purposes i...
Accessibility and Physicochemical Properties of Water for Domestic Purposes i...
ijtsrd
 
Performance assessment of water filtration plants in pakistan - JBES
Performance assessment of water filtration plants in pakistan - JBESPerformance assessment of water filtration plants in pakistan - JBES
Performance assessment of water filtration plants in pakistan - JBES
Innspub Net
 
Ensink et al 2009 musi water qual infrastruc ids
Ensink et al 2009 musi water qual infrastruc idsEnsink et al 2009 musi water qual infrastruc ids
Ensink et al 2009 musi water qual infrastruc ids
Kandukuri Prashanth
 
APPRAISAL OF GROUND WATER CHARACTERISTICS AND WATER QUALITY INDEX OF RICH IRO...
APPRAISAL OF GROUND WATER CHARACTERISTICS AND WATER QUALITY INDEX OF RICH IRO...APPRAISAL OF GROUND WATER CHARACTERISTICS AND WATER QUALITY INDEX OF RICH IRO...
APPRAISAL OF GROUND WATER CHARACTERISTICS AND WATER QUALITY INDEX OF RICH IRO...
AM Publications
 
Assessment of Human Activities on River Kaduna and the Health Implications in...
Assessment of Human Activities on River Kaduna and the Health Implications in...Assessment of Human Activities on River Kaduna and the Health Implications in...
Assessment of Human Activities on River Kaduna and the Health Implications in...
Premier Publishers
 
Groundwater Quality Assessment in hard rock terrain of Rasipuram Taluk, Namak...
Groundwater Quality Assessment in hard rock terrain of Rasipuram Taluk, Namak...Groundwater Quality Assessment in hard rock terrain of Rasipuram Taluk, Namak...
Groundwater Quality Assessment in hard rock terrain of Rasipuram Taluk, Namak...
IJERA Editor
 

Was ist angesagt? (19)

IRJET- A Review of Hydrochemical Assessment and GIS Mapping of Groundwater in...
IRJET- A Review of Hydrochemical Assessment and GIS Mapping of Groundwater in...IRJET- A Review of Hydrochemical Assessment and GIS Mapping of Groundwater in...
IRJET- A Review of Hydrochemical Assessment and GIS Mapping of Groundwater in...
 
Assessment of physicochemical characterstics of
Assessment of physicochemical characterstics ofAssessment of physicochemical characterstics of
Assessment of physicochemical characterstics of
 
Assessment of Groundwater Quality Index Using GIS at Tirupathi, India
Assessment of Groundwater Quality Index Using GIS at Tirupathi, IndiaAssessment of Groundwater Quality Index Using GIS at Tirupathi, India
Assessment of Groundwater Quality Index Using GIS at Tirupathi, India
 
IRJET- Seasonal Variations in Physico- Chemical Characteristics of Devara...
IRJET-  	  Seasonal Variations in Physico- Chemical Characteristics of Devara...IRJET-  	  Seasonal Variations in Physico- Chemical Characteristics of Devara...
IRJET- Seasonal Variations in Physico- Chemical Characteristics of Devara...
 
IRJET- Study and Analysis of Changes In Water Quality of Gomti River at diffe...
IRJET- Study and Analysis of Changes In Water Quality of Gomti River at diffe...IRJET- Study and Analysis of Changes In Water Quality of Gomti River at diffe...
IRJET- Study and Analysis of Changes In Water Quality of Gomti River at diffe...
 
IRJET- Study and Analysis of Changes in Water Quality of Gomti River at diffe...
IRJET- Study and Analysis of Changes in Water Quality of Gomti River at diffe...IRJET- Study and Analysis of Changes in Water Quality of Gomti River at diffe...
IRJET- Study and Analysis of Changes in Water Quality of Gomti River at diffe...
 
Water-Balance-Pakistan
Water-Balance-PakistanWater-Balance-Pakistan
Water-Balance-Pakistan
 
Water - The essential resource
Water - The essential resourceWater - The essential resource
Water - The essential resource
 
Water Quality Index for Assessment of Rudrasagar Lake Ecosystem, India
Water Quality Index for Assessment of Rudrasagar Lake Ecosystem, IndiaWater Quality Index for Assessment of Rudrasagar Lake Ecosystem, India
Water Quality Index for Assessment of Rudrasagar Lake Ecosystem, India
 
Priority of Water Supply Service for Community in Gresik City, East Java Prov...
Priority of Water Supply Service for Community in Gresik City, East Java Prov...Priority of Water Supply Service for Community in Gresik City, East Java Prov...
Priority of Water Supply Service for Community in Gresik City, East Java Prov...
 
Characterization of Wastewater in Rajouri Town, Jammu And Kashmir, India
Characterization of Wastewater in Rajouri Town, Jammu And Kashmir, IndiaCharacterization of Wastewater in Rajouri Town, Jammu And Kashmir, India
Characterization of Wastewater in Rajouri Town, Jammu And Kashmir, India
 
Accessibility and Physicochemical Properties of Water for Domestic Purposes i...
Accessibility and Physicochemical Properties of Water for Domestic Purposes i...Accessibility and Physicochemical Properties of Water for Domestic Purposes i...
Accessibility and Physicochemical Properties of Water for Domestic Purposes i...
 
Performance assessment of water filtration plants in pakistan - JBES
Performance assessment of water filtration plants in pakistan - JBESPerformance assessment of water filtration plants in pakistan - JBES
Performance assessment of water filtration plants in pakistan - JBES
 
Rain Water Harvesting through Tanka in Western Rajasthan
Rain Water Harvesting through Tanka in Western RajasthanRain Water Harvesting through Tanka in Western Rajasthan
Rain Water Harvesting through Tanka in Western Rajasthan
 
A Case Study of Ground Water Quality Analysis Surrounding on Gurgaon Canal (...
A Case Study of Ground Water Quality Analysis Surrounding on Gurgaon Canal  (...A Case Study of Ground Water Quality Analysis Surrounding on Gurgaon Canal  (...
A Case Study of Ground Water Quality Analysis Surrounding on Gurgaon Canal (...
 
Ensink et al 2009 musi water qual infrastruc ids
Ensink et al 2009 musi water qual infrastruc idsEnsink et al 2009 musi water qual infrastruc ids
Ensink et al 2009 musi water qual infrastruc ids
 
APPRAISAL OF GROUND WATER CHARACTERISTICS AND WATER QUALITY INDEX OF RICH IRO...
APPRAISAL OF GROUND WATER CHARACTERISTICS AND WATER QUALITY INDEX OF RICH IRO...APPRAISAL OF GROUND WATER CHARACTERISTICS AND WATER QUALITY INDEX OF RICH IRO...
APPRAISAL OF GROUND WATER CHARACTERISTICS AND WATER QUALITY INDEX OF RICH IRO...
 
Assessment of Human Activities on River Kaduna and the Health Implications in...
Assessment of Human Activities on River Kaduna and the Health Implications in...Assessment of Human Activities on River Kaduna and the Health Implications in...
Assessment of Human Activities on River Kaduna and the Health Implications in...
 
Groundwater Quality Assessment in hard rock terrain of Rasipuram Taluk, Namak...
Groundwater Quality Assessment in hard rock terrain of Rasipuram Taluk, Namak...Groundwater Quality Assessment in hard rock terrain of Rasipuram Taluk, Namak...
Groundwater Quality Assessment in hard rock terrain of Rasipuram Taluk, Namak...
 

Andere mochten auch

Aerobic Biodegradation of Vinegar Containing Waste Water by Mixed Culture Bac...
Aerobic Biodegradation of Vinegar Containing Waste Water by Mixed Culture Bac...Aerobic Biodegradation of Vinegar Containing Waste Water by Mixed Culture Bac...
Aerobic Biodegradation of Vinegar Containing Waste Water by Mixed Culture Bac...
IJERA Editor
 
Static Analysis of G+2 Institutional Building in Bhopal
Static Analysis of G+2 Institutional Building in BhopalStatic Analysis of G+2 Institutional Building in Bhopal
Static Analysis of G+2 Institutional Building in Bhopal
IJERA Editor
 
Implementing Iris in the Railway Control Office Application for Secure Saas i...
Implementing Iris in the Railway Control Office Application for Secure Saas i...Implementing Iris in the Railway Control Office Application for Secure Saas i...
Implementing Iris in the Railway Control Office Application for Secure Saas i...
IJERA Editor
 
An Efficient Block Matching Algorithm Using Logical Image
An Efficient Block Matching Algorithm Using Logical ImageAn Efficient Block Matching Algorithm Using Logical Image
An Efficient Block Matching Algorithm Using Logical Image
IJERA Editor
 
Road Safety Audit: A Case Study for Wardha Road in Nagpur City
Road Safety Audit: A Case Study for Wardha Road in Nagpur CityRoad Safety Audit: A Case Study for Wardha Road in Nagpur City
Road Safety Audit: A Case Study for Wardha Road in Nagpur City
IJERA Editor
 

Andere mochten auch (20)

Aerobic Biodegradation of Vinegar Containing Waste Water by Mixed Culture Bac...
Aerobic Biodegradation of Vinegar Containing Waste Water by Mixed Culture Bac...Aerobic Biodegradation of Vinegar Containing Waste Water by Mixed Culture Bac...
Aerobic Biodegradation of Vinegar Containing Waste Water by Mixed Culture Bac...
 
A New Approach to Romanize Arabic Words
A New Approach to Romanize Arabic WordsA New Approach to Romanize Arabic Words
A New Approach to Romanize Arabic Words
 
The behavior of hybrid reinforced concrete after heat resistance
The behavior of hybrid reinforced concrete after heat resistanceThe behavior of hybrid reinforced concrete after heat resistance
The behavior of hybrid reinforced concrete after heat resistance
 
Static Analysis of G+2 Institutional Building in Bhopal
Static Analysis of G+2 Institutional Building in BhopalStatic Analysis of G+2 Institutional Building in Bhopal
Static Analysis of G+2 Institutional Building in Bhopal
 
Implementing Iris in the Railway Control Office Application for Secure Saas i...
Implementing Iris in the Railway Control Office Application for Secure Saas i...Implementing Iris in the Railway Control Office Application for Secure Saas i...
Implementing Iris in the Railway Control Office Application for Secure Saas i...
 
An Efficient Block Matching Algorithm Using Logical Image
An Efficient Block Matching Algorithm Using Logical ImageAn Efficient Block Matching Algorithm Using Logical Image
An Efficient Block Matching Algorithm Using Logical Image
 
Technologies, Strategies And Algorithm In Green Computing – Solution To Energ...
Technologies, Strategies And Algorithm In Green Computing – Solution To Energ...Technologies, Strategies And Algorithm In Green Computing – Solution To Energ...
Technologies, Strategies And Algorithm In Green Computing – Solution To Energ...
 
Analysis of Process Parameters in Dry Turning of Medium Carbon Steel En19 by ...
Analysis of Process Parameters in Dry Turning of Medium Carbon Steel En19 by ...Analysis of Process Parameters in Dry Turning of Medium Carbon Steel En19 by ...
Analysis of Process Parameters in Dry Turning of Medium Carbon Steel En19 by ...
 
Spectroscopic studies on Mn2+ ions doped Cadmium Aluminum Fluoro Lead Borate ...
Spectroscopic studies on Mn2+ ions doped Cadmium Aluminum Fluoro Lead Borate ...Spectroscopic studies on Mn2+ ions doped Cadmium Aluminum Fluoro Lead Borate ...
Spectroscopic studies on Mn2+ ions doped Cadmium Aluminum Fluoro Lead Borate ...
 
Physico-Chemical Analysis of Underground Water from Silchar Municipal Area of...
Physico-Chemical Analysis of Underground Water from Silchar Municipal Area of...Physico-Chemical Analysis of Underground Water from Silchar Municipal Area of...
Physico-Chemical Analysis of Underground Water from Silchar Municipal Area of...
 
Network Performance Enhancement for 1G-EPON by DBA Algorithms
Network Performance Enhancement for 1G-EPON by DBA AlgorithmsNetwork Performance Enhancement for 1G-EPON by DBA Algorithms
Network Performance Enhancement for 1G-EPON by DBA Algorithms
 
Road Safety Audit: A Case Study for Wardha Road in Nagpur City
Road Safety Audit: A Case Study for Wardha Road in Nagpur CityRoad Safety Audit: A Case Study for Wardha Road in Nagpur City
Road Safety Audit: A Case Study for Wardha Road in Nagpur City
 
Geomatics Based Landslide Vulnerability Zonation Mapping - Parts Of Nilgiri D...
Geomatics Based Landslide Vulnerability Zonation Mapping - Parts Of Nilgiri D...Geomatics Based Landslide Vulnerability Zonation Mapping - Parts Of Nilgiri D...
Geomatics Based Landslide Vulnerability Zonation Mapping - Parts Of Nilgiri D...
 
Green Roofs and Green Building Rating Systems
Green Roofs and Green Building Rating SystemsGreen Roofs and Green Building Rating Systems
Green Roofs and Green Building Rating Systems
 
Design and Fabrication of Eu-Cycle
Design and Fabrication of Eu-CycleDesign and Fabrication of Eu-Cycle
Design and Fabrication of Eu-Cycle
 
TNM Method Results Compared with Finite Element Analysis for a 30 KW SCIM Motor
TNM Method Results Compared with Finite Element Analysis for a 30 KW SCIM MotorTNM Method Results Compared with Finite Element Analysis for a 30 KW SCIM Motor
TNM Method Results Compared with Finite Element Analysis for a 30 KW SCIM Motor
 
Deterministic Assessment of Continuous Flight Auger Construction Durations Us...
Deterministic Assessment of Continuous Flight Auger Construction Durations Us...Deterministic Assessment of Continuous Flight Auger Construction Durations Us...
Deterministic Assessment of Continuous Flight Auger Construction Durations Us...
 
An Improved Parallel Activity scheduling algorithm for large datasets
An Improved Parallel Activity scheduling algorithm for large datasetsAn Improved Parallel Activity scheduling algorithm for large datasets
An Improved Parallel Activity scheduling algorithm for large datasets
 
Synthesis, Electrical and Optical Properties of Nickel Sulphate Hexa Hydrate ...
Synthesis, Electrical and Optical Properties of Nickel Sulphate Hexa Hydrate ...Synthesis, Electrical and Optical Properties of Nickel Sulphate Hexa Hydrate ...
Synthesis, Electrical and Optical Properties of Nickel Sulphate Hexa Hydrate ...
 
Unsteady Free Convection MHD Flow of an Incompressible Electrically Conductin...
Unsteady Free Convection MHD Flow of an Incompressible Electrically Conductin...Unsteady Free Convection MHD Flow of an Incompressible Electrically Conductin...
Unsteady Free Convection MHD Flow of an Incompressible Electrically Conductin...
 

Ähnlich wie A Study on Physico-Chemical Characteristics of Borewell Water In Sugar Town, Mandya City, Karnataka State, India

IJERD (www.ijerd.com) International Journal of Engineering Research and Devel...
IJERD (www.ijerd.com) International Journal of Engineering Research and Devel...IJERD (www.ijerd.com) International Journal of Engineering Research and Devel...
IJERD (www.ijerd.com) International Journal of Engineering Research and Devel...
IJERD Editor
 
Water Quality and Sediment Analysis of Selected Rivers at Satara District, Ma...
Water Quality and Sediment Analysis of Selected Rivers at Satara District, Ma...Water Quality and Sediment Analysis of Selected Rivers at Satara District, Ma...
Water Quality and Sediment Analysis of Selected Rivers at Satara District, Ma...
ijtsrd
 
Guj sw study of wq fluctuation in river vishwamitri_0b
Guj sw study of wq fluctuation in river vishwamitri_0bGuj sw study of wq fluctuation in river vishwamitri_0b
Guj sw study of wq fluctuation in river vishwamitri_0b
hydrologyproject0
 
Assessment of Water Quality Indices for Irrigation of Dharta Watershed, Udaip...
Assessment of Water Quality Indices for Irrigation of Dharta Watershed, Udaip...Assessment of Water Quality Indices for Irrigation of Dharta Watershed, Udaip...
Assessment of Water Quality Indices for Irrigation of Dharta Watershed, Udaip...
ijtsrd
 

Ähnlich wie A Study on Physico-Chemical Characteristics of Borewell Water In Sugar Town, Mandya City, Karnataka State, India (20)

An Assesment of Groundwater Quality Index in Bommasandra Area,Bengaluru city,...
An Assesment of Groundwater Quality Index in Bommasandra Area,Bengaluru city,...An Assesment of Groundwater Quality Index in Bommasandra Area,Bengaluru city,...
An Assesment of Groundwater Quality Index in Bommasandra Area,Bengaluru city,...
 
An33233237
An33233237An33233237
An33233237
 
An33233237
An33233237An33233237
An33233237
 
Water Quality Index for Assessment of Rudrasagar Lake Ecosystem, India
Water Quality Index for Assessment of Rudrasagar Lake Ecosystem, IndiaWater Quality Index for Assessment of Rudrasagar Lake Ecosystem, India
Water Quality Index for Assessment of Rudrasagar Lake Ecosystem, India
 
ASSESSMENT OF GROUND WATER QUALITY USING WATER QUALITY INDEX WITHIN 4KM RADIU...
ASSESSMENT OF GROUND WATER QUALITY USING WATER QUALITY INDEX WITHIN 4KM RADIU...ASSESSMENT OF GROUND WATER QUALITY USING WATER QUALITY INDEX WITHIN 4KM RADIU...
ASSESSMENT OF GROUND WATER QUALITY USING WATER QUALITY INDEX WITHIN 4KM RADIU...
 
IJERD (www.ijerd.com) International Journal of Engineering Research and Devel...
IJERD (www.ijerd.com) International Journal of Engineering Research and Devel...IJERD (www.ijerd.com) International Journal of Engineering Research and Devel...
IJERD (www.ijerd.com) International Journal of Engineering Research and Devel...
 
Water Quality and Sediment Analysis of Selected Rivers at Satara District, Ma...
Water Quality and Sediment Analysis of Selected Rivers at Satara District, Ma...Water Quality and Sediment Analysis of Selected Rivers at Satara District, Ma...
Water Quality and Sediment Analysis of Selected Rivers at Satara District, Ma...
 
ANALYSIS OF GROUNDWATER QUALITY USING STATISTICAL TECHNIQUES: A CASE STUDY OF...
ANALYSIS OF GROUNDWATER QUALITY USING STATISTICAL TECHNIQUES: A CASE STUDY OF...ANALYSIS OF GROUNDWATER QUALITY USING STATISTICAL TECHNIQUES: A CASE STUDY OF...
ANALYSIS OF GROUNDWATER QUALITY USING STATISTICAL TECHNIQUES: A CASE STUDY OF...
 
Investigation Work Carried Out at Nidubrolu Water Treatment Plant
Investigation Work Carried Out at Nidubrolu Water Treatment PlantInvestigation Work Carried Out at Nidubrolu Water Treatment Plant
Investigation Work Carried Out at Nidubrolu Water Treatment Plant
 
Investigation on Groundwater Quality in parts of Ramdurg Taluk of Malaprabha ...
Investigation on Groundwater Quality in parts of Ramdurg Taluk of Malaprabha ...Investigation on Groundwater Quality in parts of Ramdurg Taluk of Malaprabha ...
Investigation on Groundwater Quality in parts of Ramdurg Taluk of Malaprabha ...
 
Guj sw study of wq fluctuation in river vishwamitri_0b
Guj sw study of wq fluctuation in river vishwamitri_0bGuj sw study of wq fluctuation in river vishwamitri_0b
Guj sw study of wq fluctuation in river vishwamitri_0b
 
POLLUTION ABATEMENT OF MEENACHIL RIVER IN KOTTAYAM DISTRICT
POLLUTION ABATEMENT OF MEENACHIL RIVER IN KOTTAYAM DISTRICTPOLLUTION ABATEMENT OF MEENACHIL RIVER IN KOTTAYAM DISTRICT
POLLUTION ABATEMENT OF MEENACHIL RIVER IN KOTTAYAM DISTRICT
 
Assessment of Water Quality Indices for Irrigation of Dharta Watershed, Udaip...
Assessment of Water Quality Indices for Irrigation of Dharta Watershed, Udaip...Assessment of Water Quality Indices for Irrigation of Dharta Watershed, Udaip...
Assessment of Water Quality Indices for Irrigation of Dharta Watershed, Udaip...
 
Statistical Analysis of Ground Water Quality in Rural Areas of Uttar Pradesh ...
Statistical Analysis of Ground Water Quality in Rural Areas of Uttar Pradesh ...Statistical Analysis of Ground Water Quality in Rural Areas of Uttar Pradesh ...
Statistical Analysis of Ground Water Quality in Rural Areas of Uttar Pradesh ...
 
Water and soil quality aspects of nelligudde reservoir catchment and command ...
Water and soil quality aspects of nelligudde reservoir catchment and command ...Water and soil quality aspects of nelligudde reservoir catchment and command ...
Water and soil quality aspects of nelligudde reservoir catchment and command ...
 
IRJET - Underground Water Recharge through Rainwater Harvesting using Rem...
IRJET -  	  Underground Water Recharge through Rainwater Harvesting using Rem...IRJET -  	  Underground Water Recharge through Rainwater Harvesting using Rem...
IRJET - Underground Water Recharge through Rainwater Harvesting using Rem...
 
Drinking Water Quality Assessment of Commercial Areas in Shivamogga Town usin...
Drinking Water Quality Assessment of Commercial Areas in Shivamogga Town usin...Drinking Water Quality Assessment of Commercial Areas in Shivamogga Town usin...
Drinking Water Quality Assessment of Commercial Areas in Shivamogga Town usin...
 
IRJET- Assessment of Water Quality Index of Hiran River at Sihora Region in J...
IRJET- Assessment of Water Quality Index of Hiran River at Sihora Region in J...IRJET- Assessment of Water Quality Index of Hiran River at Sihora Region in J...
IRJET- Assessment of Water Quality Index of Hiran River at Sihora Region in J...
 
Water quality variables from peerwadi well, uran
Water quality variables from peerwadi well, uranWater quality variables from peerwadi well, uran
Water quality variables from peerwadi well, uran
 
D0343021028
D0343021028D0343021028
D0343021028
 

Kürzlich hochgeladen

Call Now ≽ 9953056974 ≼🔝 Call Girls In New Ashok Nagar ≼🔝 Delhi door step de...
Call Now ≽ 9953056974 ≼🔝 Call Girls In New Ashok Nagar  ≼🔝 Delhi door step de...Call Now ≽ 9953056974 ≼🔝 Call Girls In New Ashok Nagar  ≼🔝 Delhi door step de...
Call Now ≽ 9953056974 ≼🔝 Call Girls In New Ashok Nagar ≼🔝 Delhi door step de...
9953056974 Low Rate Call Girls In Saket, Delhi NCR
 
result management system report for college project
result management system report for college projectresult management system report for college project
result management system report for college project
Tonystark477637
 

Kürzlich hochgeladen (20)

UNIT - IV - Air Compressors and its Performance
UNIT - IV - Air Compressors and its PerformanceUNIT - IV - Air Compressors and its Performance
UNIT - IV - Air Compressors and its Performance
 
Call for Papers - International Journal of Intelligent Systems and Applicatio...
Call for Papers - International Journal of Intelligent Systems and Applicatio...Call for Papers - International Journal of Intelligent Systems and Applicatio...
Call for Papers - International Journal of Intelligent Systems and Applicatio...
 
Thermal Engineering -unit - III & IV.ppt
Thermal Engineering -unit - III & IV.pptThermal Engineering -unit - III & IV.ppt
Thermal Engineering -unit - III & IV.ppt
 
BSides Seattle 2024 - Stopping Ethan Hunt From Taking Your Data.pptx
BSides Seattle 2024 - Stopping Ethan Hunt From Taking Your Data.pptxBSides Seattle 2024 - Stopping Ethan Hunt From Taking Your Data.pptx
BSides Seattle 2024 - Stopping Ethan Hunt From Taking Your Data.pptx
 
(INDIRA) Call Girl Meerut Call Now 8617697112 Meerut Escorts 24x7
(INDIRA) Call Girl Meerut Call Now 8617697112 Meerut Escorts 24x7(INDIRA) Call Girl Meerut Call Now 8617697112 Meerut Escorts 24x7
(INDIRA) Call Girl Meerut Call Now 8617697112 Meerut Escorts 24x7
 
Roadmap to Membership of RICS - Pathways and Routes
Roadmap to Membership of RICS - Pathways and RoutesRoadmap to Membership of RICS - Pathways and Routes
Roadmap to Membership of RICS - Pathways and Routes
 
UNIT-III FMM. DIMENSIONAL ANALYSIS
UNIT-III FMM.        DIMENSIONAL ANALYSISUNIT-III FMM.        DIMENSIONAL ANALYSIS
UNIT-III FMM. DIMENSIONAL ANALYSIS
 
Call Now ≽ 9953056974 ≼🔝 Call Girls In New Ashok Nagar ≼🔝 Delhi door step de...
Call Now ≽ 9953056974 ≼🔝 Call Girls In New Ashok Nagar  ≼🔝 Delhi door step de...Call Now ≽ 9953056974 ≼🔝 Call Girls In New Ashok Nagar  ≼🔝 Delhi door step de...
Call Now ≽ 9953056974 ≼🔝 Call Girls In New Ashok Nagar ≼🔝 Delhi door step de...
 
(INDIRA) Call Girl Aurangabad Call Now 8617697112 Aurangabad Escorts 24x7
(INDIRA) Call Girl Aurangabad Call Now 8617697112 Aurangabad Escorts 24x7(INDIRA) Call Girl Aurangabad Call Now 8617697112 Aurangabad Escorts 24x7
(INDIRA) Call Girl Aurangabad Call Now 8617697112 Aurangabad Escorts 24x7
 
The Most Attractive Pune Call Girls Manchar 8250192130 Will You Miss This Cha...
The Most Attractive Pune Call Girls Manchar 8250192130 Will You Miss This Cha...The Most Attractive Pune Call Girls Manchar 8250192130 Will You Miss This Cha...
The Most Attractive Pune Call Girls Manchar 8250192130 Will You Miss This Cha...
 
Call Girls Walvekar Nagar Call Me 7737669865 Budget Friendly No Advance Booking
Call Girls Walvekar Nagar Call Me 7737669865 Budget Friendly No Advance BookingCall Girls Walvekar Nagar Call Me 7737669865 Budget Friendly No Advance Booking
Call Girls Walvekar Nagar Call Me 7737669865 Budget Friendly No Advance Booking
 
Online banking management system project.pdf
Online banking management system project.pdfOnline banking management system project.pdf
Online banking management system project.pdf
 
ONLINE FOOD ORDER SYSTEM PROJECT REPORT.pdf
ONLINE FOOD ORDER SYSTEM PROJECT REPORT.pdfONLINE FOOD ORDER SYSTEM PROJECT REPORT.pdf
ONLINE FOOD ORDER SYSTEM PROJECT REPORT.pdf
 
PVC VS. FIBERGLASS (FRP) GRAVITY SEWER - UNI BELL
PVC VS. FIBERGLASS (FRP) GRAVITY SEWER - UNI BELLPVC VS. FIBERGLASS (FRP) GRAVITY SEWER - UNI BELL
PVC VS. FIBERGLASS (FRP) GRAVITY SEWER - UNI BELL
 
NFPA 5000 2024 standard .
NFPA 5000 2024 standard                                  .NFPA 5000 2024 standard                                  .
NFPA 5000 2024 standard .
 
UNIT-II FMM-Flow Through Circular Conduits
UNIT-II FMM-Flow Through Circular ConduitsUNIT-II FMM-Flow Through Circular Conduits
UNIT-II FMM-Flow Through Circular Conduits
 
result management system report for college project
result management system report for college projectresult management system report for college project
result management system report for college project
 
Intze Overhead Water Tank Design by Working Stress - IS Method.pdf
Intze Overhead Water Tank  Design by Working Stress - IS Method.pdfIntze Overhead Water Tank  Design by Working Stress - IS Method.pdf
Intze Overhead Water Tank Design by Working Stress - IS Method.pdf
 
Extrusion Processes and Their Limitations
Extrusion Processes and Their LimitationsExtrusion Processes and Their Limitations
Extrusion Processes and Their Limitations
 
Call Girls Pimpri Chinchwad Call Me 7737669865 Budget Friendly No Advance Boo...
Call Girls Pimpri Chinchwad Call Me 7737669865 Budget Friendly No Advance Boo...Call Girls Pimpri Chinchwad Call Me 7737669865 Budget Friendly No Advance Boo...
Call Girls Pimpri Chinchwad Call Me 7737669865 Budget Friendly No Advance Boo...
 

A Study on Physico-Chemical Characteristics of Borewell Water In Sugar Town, Mandya City, Karnataka State, India

  • 1. Shivaprasad H et al Int. Journal of Engineering Research and Applications www.ijera.com ISSN : 2248-9622, Vol. 4, Issue 7( Version 1), July 2014, pp.112-123 www.ijera.com 112 | P a g e A Study on Physico-Chemical Characteristics of Borewell Water In Sugar Town, Mandya City, Karnataka State, India Shivaprasad H1 , Nagarajappa D P2 , Sham Sundar K M3 1Post Graduate Student, Department of Studies in Civil Engineering, University BDT College of Engineering, Davangere-5770 04, India 2Professor, Department of Studies in Civil Engineering, University BDT College of Engineering, Davangere- 5770 04, India 3Professor, Department of Studies in Civil Engineering, University BDT College of Engineering, Davangere- 5770 04, India Abstract Groundwater is a natural resource for drinking water .In addition to the population growth, urbanization and industrialization also extend the demand of water. Providing safe drinking water supply to the ever growing urban and sub-urban population is going to be a challenge to the civil authorities, city planners, policy makers and environmentalists. Groundwater is a major source of drinking water in both urban and rural areas of Mandya. Mandya city is rapidly raising population, changing lifestyle and intense competition among users- agriculture, industry and domestic sectors is driving the groundwater table lower. Besides, discharge of untreated wastewater through bores and leachate from unscientific disposal of solid wastes also contaminate groundwater, thereby reducing quality of fresh water resources. The present work is aimed at assessing the water quality index for the ground water samples of Sugar town, Mandya city. The groundwater samples of about 40 samples were collected and subjected for a comprehensive physicochemical analysis. The purposes of this investigation are to provide an overview of present ground water quality for the following 12 parameters such as pH, total hardness, calcium, magnesium, chloride, nitrate, sulphate, total dissolved solids, iron, fluoride, alkalinity are to be considered for calculating the WQI. The results are analyzed by WQI method for predicting water quality. Water Quality Index (WQI) is a very useful and effective way for assessing the quality of water. WQI is a very useful tool for communicating the information on overall quality of water. Keywords: Groundwater, Water quality standards, Water quality characteristics, Water quality index. I. Introduction Groundwater is used for domestic, industrial, water supply and irrigation all over the world. In the last few decades, there has been a tremendous increase in the demand for fresh water due to rapid growth of population and the accelerated pace of industrialization. Human health is threatened by unsanitary conditions through open drain carrying and disposing wastewater into natural water bodies. Rapid urbanization, especially in developing countries like India, has affected the availability and quality of groundwater due to its overexploitation and improper waste disposal, especially in urban areas. According to WHO organization, about 80% of all the diseases in human beings are caused by water. Water quality index is one of the most effective tools to communicate information on the quality of water to the concerned citizens and policy makers. It, thus, becomes an important parameter for the assessment and management of groundwater. WQI is defined as a rating, reflecting the composite influence of different water quality parameters. WQI is calculated from the point of view of the suitability of groundwater for human consumption. The objective of the present work is to discuss the suitability of groundwater for human consumption based on computed, groundwater characteristics, quality assessment and water quality index values. II. Materials and Methods 2.1 Description of the study area Mandya district is lies between North latitude 12013‟ to 13004‟ and East longitudes 76019‟ to 77020‟ and is bounded on northwest by Hassan district, on the north and northeast by Tumkur district, on the east by Ramanagar district and south by Mysore and Chamarajnagar district. Total geographical area of the district is 4961 Sqkms. The city is situated at an elevation of 669.47 m above MSL.The district is divided into seven taluks coming under two subdivisions (Mandya and Pandavapura). The Mandya subdivision comprises Mandya, Maddur and Malavalli taluks. The Pandavapura subdivision RESEARCH ARTICLE OPEN ACCESS
  • 2. Shivaprasad H et al Int. Journal of Engineering Research and Applications www.ijera.com ISSN : 2248-9622, Vol. 4, Issue 7( Version 1), July 2014, pp.112-123 www.ijera.com 113 | P a g e comprises of Pandavapura, Srirangapattana, Nagamangala and K.R.Pet taluks. 2.2 Population growth and density As per provisional reports of Census India, population of Mandya in 2011 is 1,37,735; of which male and female are 68,748 and 68,987 respectively. The sex ratio of Mandya city is 1003 per 1000 males. In education section, total literates in Mandya city are 105,938 of which 55,442 are males while 50,496 are females. Average literacy rate of Mandya city is 85.11 percent of which male and female literacy was 89.54 and 80.74 percent. Total children (0-6) in Mandya city are 13,269 as per figure from Census India report on 2011. There were 6,826 boys while 6,443 are girls. Child sex ratio of girls is 944 per 1000 boys. In Mandya city more than 99% of the population speaks Kannada. Mandya City Municipality Council (CMC) is spread up to 17.03 Sq.km in which 1, 37,735 persons reside. The population density on an average in 8,629 per Sq.km which is thickly populated and the city is developing steadily; the projected population growth in the CMC is given in the Table2.1. Since the city is the district head quarter the floating population is moderate and works out to be 15000 per day. Table3.2 shows details of ward wise population distribution and there components, these details will be use full to design solid waste management system. 2.3 Geomorphology The district is located in the southern maiden region of the state. The surface topography is in the form of undulating plain situated at an average elevation of 750- 900m above MSL. There are few sporadic out crops of rocks as hills and few fertile shallow valleys. In the south-eastern part of the district the Biligirirangana hill ranges extending from Mysore District tapers off here. In this portion Cauvery river breaks through the hill ranges and forms the famous Gaganachukki and Barachukki waterfalls. The Melukote range of hills fallen a broken series of conspicuous peaks, which reach the altitude of 1159m above MSL, 1064m above MSL, 1050m above MSL and 1046m above MSL.The Hulikere-Kartigatta hill range near S.R.Patna and bold rugged low peaks near Sindhugatta are also conspicuous. The general slope in the district is in southeast direction. 2.4 Groundwater sampling in the Study area Careful planning and preparation of a groundwater- sampling trip was made to save time and help reduce the number of difficulties that commonly occur with fieldwork. Correct sampling procedure begins with thorough preparation in the office and laboratory before sample collection. Each sample bottle is to be thoroughly cleaned and protected from any contamination during sample collection, preservation, and shipment to assure a high quality sample. Filtering equipment is to be rinsed thoroughly to remove any mineral deposits in hoses or support container vessels. The sample containers and hoses for organic analyses are to be acid-washed and rinsed several times with deionised water. Grab sampling has been adopted to collect groundwater samples. 40 groundwater samples were collected in polythene containers of 2 litres capacity for chemical analysis after pumping out sufficient quantity of water from the source such that, the sample collected served as a representative sample. The samples thus collected were transported to the laboratory condition. 2.5 Analysis of Groundwater Samples The groundwater quality was assessed by the analysis of chemical parameters such as pH, Electrical Conductivity, Total Dissolved Solids, Alkalinity, Chlorides, Total Hardness, Calcium Hardness, Nitrates, Sulphates, Iron and Fluorides. The Bureau of Indian Standards (BIS) for drinking water quality for various parameters is presented in the table 2.The analytical methods used to measure chemical parameters of groundwater samples collected from all the sampling stations are listed in the table 1.The water samples were analysed adopting standard methods in the Environmental Laboratory.
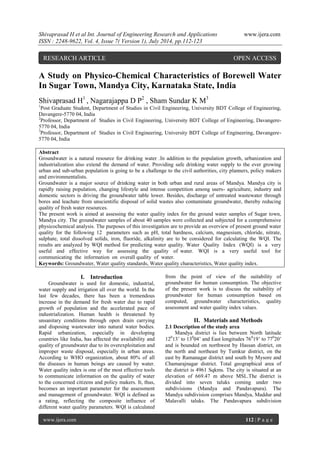
  • 3. Shivaprasad H et al Int. Journal of Engineering Research and Applications www.ijera.com ISSN : 2248-9622, Vol. 4, Issue 7( Version 1), July 2014, pp.112-123 www.ijera.com 114 | P a g e MANDYA DISTRICT, KARNATAKA LOCATION,INDIA (NOT FOR SCALE) SUGAR TOWN AREA Figure 2.1: Layout of Sugar town area, Mandya city.
  • 4. Shivaprasad H et al Int. Journal of Engineering Research and Applications www.ijera.com ISSN : 2248-9622, Vol. 4, Issue 7( Version 1), July 2014, pp.112-123 www.ijera.com 115 | P a g e 2.6 Physico-Chemical analysis of groundwater samples: All the reagents used were of analytical grade and solutions were made of distilled water. Various water quality parameters such as alkalinity, hardness, chlorides etc., were determined using standard analytical methods and procedures (table-1). The instruments used were calibrated before use for observing readings. The repeated measurements were made to ensure precision and accuracy of results Table 1: Methods Used for Groundwater analysis (Laboratory analytical methods) Sl.No Physico-chemical Parameters Methods 1 pH Potentiometry (pH meter) 2 Conductivity Conductivity probe 3 Alkalinity Argentometry (Titration) 4 Chloride Argentometry (Titration) 5 Total Hardness Complexometry by EDTA titration 6 Calcium Argentometry (Titration) 7 Magnesium Argentometry (Titration) 8 Total Dissolved Solids TDS Probe 9 Fluoride Ion Analyser 10 Iron Spectrophotometry 11 Nitrate Spectrophotometry 12 Sulphate Spectrophotometry Table 2: Bureau of Indian Standards (BIS) for drinking water (IS 10500: 2003) Sl. No. Characteristics Desirable limit Permissible limit 1 Colour, (Hazen units) 5 25 2 Odour Unobjectionable Unobjectionable 3 Taste Agreeable Agreeable 4 pH value 6.5-8.5 No relaxation 5 Total hardness (mg/l as CaCO3) 300 600 6 Iron (Fe), mg/l 0.3 1.0 7 Manganese 0.1 0.3 (Mn), mg/l 8 Chloride, mg/l 250 1000 9 Total dissolved solids, mg/l 500 2000 10 Calcium, mg/l 100 200 11 Sulphate, mg/l 200 400 12 Nitrate, mg/l 45 100 13 Fluoride, mg/l - 1.5 14 Alkalinity, mg/l 200 600 15 Mercury, mg/l 0.001 - 16 Cadmium, mg/l 0.01 - 17 Lead, mg/l 0.05 - 18 Zinc, mg/l 5 15 III. Results and Discussions In this chapter for the purpose of revealing the water quality of 40 bore wells of covering the study area have been established by determining the physical and chemical characteristics as per standard methods4. They have been listed systematically and represented in table2. The parameters viz., pH, total dissolved solids and Electrical conductivity know the physical characteristics of the ground water under the study area. The chemical characteristics of the ground water under the study area are known by the parameters viz., total hardness, calcium hardness, magnesium hardness, iron, fluoride, nitrate, chloride, sulfate, and alkalinity. The pH of the groundwater samples are neutral or close to it as they all range from 6.45 to 7.89 which are within the permissible limits 6.5- 8.5 given by Indian Standards, also complies with standard 0f 7.0-8.0 given by WHO17. One of the main objectives in controlling pH is to produce water that minimizes corrosion or incrustation. These processes, which can cause considerable damage to the water supply systems, result from complex interactions between pH and other parameters, such as dissolved solids, dissolved gases, hardness, alkalinity, and temperature. The variation of pH in the study period is shown figure 3.1
  • 5. Shivaprasad H et al Int. Journal of Engineering Research and Applications www.ijera.com ISSN : 2248-9622, Vol. 4, Issue 7( Version 1), July 2014, pp.112-123 www.ijera.com 116 | P a g e Figure 3.1: pH- Hydrogen ion concentration variations during the study period The Conductivity of the groundwater in Sugar town, Mandya city ranges from 585-1109μs/cm. Conductivity itself is not a human or aquatic health concern, but because it is easily measured, it can serve as an indicator of other water quality problems. Water with high mineral content tends to have higher conductivity, which is a general indication of high dissolved solid concentration of the water10. Therefore, conductivity measurements can be used as a quick way to locate potential water quality problems. The variation of Electrical conductivity in the study period is shown figure 3. Total dissolved solids level in ground water is 359-665 mg/L which exceeds the permissible limit of 500 mg/L as per Indian standards and 1000 mg/l as per WHO Standards. The term total dissolved solids refer mainly to the inorganic substances that are dissolved in water. The effects of TDS on drinking water quality depend on the levels of its individual components; excessive hardness, taste, mineral depositions and corrosion are common properties of highly mineralized water. The variation of total dissolved solids in the study period is shown figure 3.2. Figure 3.2: EC- Electrical conductivity, TDS- Total dissolved solids concentration variations during the study period Total Hardness varies from 255-410 mg/l as CaCO3. The hardness values for the study area are found to be hard for almost all locations and determined to fall higher edge of the desirable limit 0 1 2 3 4 5 6 7 8 9 1 3 5 7 9 11 13 15 17 19 21 23 25 27 29 31 33 35 37 39 Concentrated variations Sample locations pH pH 0 200 400 600 800 1000 1200 1 3 5 7 9 11 13 15 17 19 21 23 25 27 29 31 33 35 37 39 Concentration variations Sample locations EC, μS/cm TDS, ppm
  • 6. Shivaprasad H et al Int. Journal of Engineering Research and Applications www.ijera.com ISSN : 2248-9622, Vol. 4, Issue 7( Version 1), July 2014, pp.112-123 www.ijera.com 117 | P a g e of WHO specification and Indian standards. According to Sawyer and McCarty‟s classification for hardness, water samples collected from study area are falls under the hard class 28.21%. The variation of total alkalinity and total hardness in the study period is shown figure 3.3. Hardness is caused by polyvalent metallic ions dissolved in water, which in natural water are principally magnesium and calcium. So the adverse effects of such hard water are i. Soap consumption by hard water cause economic loss to water, ii. MgSO4 has laxative effects in person unaccustomed to it, iii. precipitation by hard water adhere to the surface of tubs and sinks and may stain clothing, dishes and other items1 Table-3: Classification of water based on hardness by Sawyer and McCarthy Hardness as CaCO3 (mg/l) Water quality Percent 0-75 Soft 10.26 75-150 Moderately hard 33.33 150-300 Hard 28.21 Above 300 Very hard 28.21 Alkalinity of the samples are in the range of 352-465 mg/L. The alkalinity levels of all the water samples are high thus, resisting acidification of the groundwater samples. The variation of total alkalinity and total hardness in the study period is shown figure 4 Figure 4: TH- Total Hardness, TA- Total Alkalinity variations during the study period The presence of calcium in water results from its passage through the deposits of limestone, dolomite, gypsum and other calcium bearing rocks. Calcium contributes to the total hardness of water and is an important micro nutrient in aquatic environment. Small concentrations of calcium carbonate prevent corrosion of metal pipes by laying down a protective coating. But increased concentration of calcium precipitates on heating to form harmful scales in boilers, pipes and utensils. As per BIS and WHO standards, the permissible limit for calcium is 200 mg/l. In the present study, the groundwater samples have calcium concentration varying from 48-84.8 mg/l. Variation of calcium in the study area is shown in the figure 5 Magnesium is one of the abundant elements in the earth„s crust, It is found in all natural waters and its source lies in rocks. It is an important element contributing to hardness and a necessary constituent of chlorophyll. High concentrations of magnesium reduce utility of water for domestic use, while a concentration above 500mg/l imparts an unpleasant taste to water and renders it unfit for drinking. As per IS 10500: (2003), the desirable limit of magnesium is 30 mg/l and permissible limit is 100 mg/l. In the present study, the groundwater samples have magnesium concentration varying from 32.80-52.08 mg/l. Variations of Magnesium in the study area is shown in the figure 5. 0 50 100 150 200 250 300 350 400 450 500 1 3 5 7 9 11 13 15 17 19 21 23 25 27 29 31 33 35 37 39 Concentration variations Sample locations TH,mg/L TA, mg/L
  • 7. Shivaprasad H et al Int. Journal of Engineering Research and Applications www.ijera.com ISSN : 2248-9622, Vol. 4, Issue 7( Version 1), July 2014, pp.112-123 www.ijera.com 118 | P a g e Figure 5: Ca- Calcium, Mg- Magnesium variations during the study period Chloride present in ground water samples are in the range of 80.12-120.12 mg/l, which exceeds the permissible limit of 250 mg/l as per Indian standards as well as WHO Standards and this obviously affects the taste of the water. Similarly study of Chemical characteristics of groundwater in and around Sugar town, Mandya city chloride content is beyond the permissible limit24. This occurs may be due to saline water intrusion. Chloride is a widely distributed element in all types of rocks in one or the other form. Its affinity towards sodium is high. Therefore, its concentration is high in ground waters, where the temperature is high and rainfall is less. Soil porosity and permeability also has a key role in building up the chlorides concentration17. The variation of Chlorides in the study period is shown figure 6 Sulphate concentration in collected groundwater samples is ranged from 69.1-183 mg/l as in the permissible limit of 200mg/l as per Indian standards and 250mg/l as per WHO Standards. Health concerns regarding sulphate in drinking water have been raised because of reports that diarrhoea may be associated with the ingestion of water containing high levels of sulphate. The variation of Sulphate in the study period is shown figure 6 Figure 6: Cl- Chloride, SO4- Sulphate variations during the study period In the groundwater of Sugar town, Mandya City, Nitrate is varies from 6.20-8.45 mg/l which complies with the permissible limit of 45 mg/l as per Indian standards and 50 mg/L as per WHO Standards. Nitrates themselves are relatively non-toxic. Nitrogen essential component of amino acids, and therefore all proteins and nucleic acids, and therefore needed for all cell division and reproduction. The formation of 0 10 20 30 40 50 60 70 80 90 1 3 5 7 9 11 13 15 17 19 21 23 25 27 29 31 33 35 37 39 Concentration variations Sample locations Ca2+,mg/L Mg2+,mg/L 0 20 40 60 80 100 120 140 160 180 200 1 3 5 7 9 11 13 15 17 19 21 23 25 27 29 31 33 35 37 39 Concentration variations Sample locations Cl-,mg/L SO42-,mg/L
  • 8. Shivaprasad H et al Int. Journal of Engineering Research and Applications www.ijera.com ISSN : 2248-9622, Vol. 4, Issue 7( Version 1), July 2014, pp.112-123 www.ijera.com 119 | P a g e nitrates is an integral part of the nitrogen cycle in our environment. Nitrate levels above 45 mg/l NO3 may cause methemoglobinemia (Blue baby disease) in infants .Sources of nitrate contamination in Sugar town, Mandya city may include septic tanks and municipal sewage treatment systems. The ability of nitrate to enter well water depends on the type of soil and bedrock present, and on the depth and construction of the well13.The variation of Nitrate in the study period is shown figure7 Figure 7: NO3- Nitrate variations during the study period The levels of Flouride in the groundwater samples ranged from 0.60-0.72 mg/l which are within the permissible limit of 1 mg/l as per Indian standards as well as WHO Standards. The variation of fluoride is dependent on a variety of factors such as amount of soluble and insoluble fluoride in source rocks, the duration of contact of water with rocks and soil temperature, rainfall, oxidation- reduction process12. The presence of small quantities of fluoride in drinking water may prevent tooth decay. Fluoride is poisonous at high levels, and while dental fluorosis is easily recognized, skeletal damage may not be clinically obvious until advanced stages have occurred. Often, ground waters will contain more than 1.0 ppm, and in these cases, the water should probably be deflouridated for drinking. The variation of Fluoride in the study period is shown figure 8 Iron concentration of groundwater samples in the study area are varies from 0.32-0.56 mg/L and The Bureau of Indian Standards has recommended 0.3 mg/l as the desirable limit and 1.0 mg/L as the maximum permissible limit for iron in drinking water (BIS, 1991). Hence it is within the permissible limit. The ground water samples exhibited high Iron contamination which is an indication of the presence ferrous salts that precipitate as insoluble ferric hydroxide and settles out as rusty silt. High concentration of iron is may contributed by industrial estate located at the sampling site, Iron is an essential element in human nutrition. Toxic effects have resulted from the ingestion of large quantities of iron, but there is no evidence to indicate that concentrations of iron commonly present in food or drinking water constitute any hazard to human health. At concentrations above 0.3 mg/l, iron can stain laundry and plumbing fixtures and cause undesirable tastes. Iron may also promote the growth of certain microorganisms, leading to the deposition of a slimy coat in piping14 .The variation of Iron in the study period is shown figure 8 0 1 2 3 4 5 6 7 8 9 10 1 3 5 7 9 11 13 15 17 19 21 23 25 27 29 31 33 35 37 39 Concentration variations Sample locations NO32-,mg/L
  • 9. Shivaprasad H et al Int. Journal of Engineering Research and Applications www.ijera.com ISSN : 2248-9622, Vol. 4, Issue 7( Version 1), July 2014, pp.112-123 www.ijera.com 120 | P a g e Figure 8: F- Fluoride, Fe- Iron variations during study period Table-4: Comparison of groundwater quality with drinking water standards, Indian and WHO Parameters Indian Standard Percentage compliance WHO Standard pH 6.5-8.5 100 7.0-8.0 TH, mg/L 300 100 100 Ca2+ ,mg/L 75 0 75 Mg2+,mg/L 30 100 30 Cl- , mg/L 250 100 250 TDS, ppm 500 100 1000 Fe, mg/L 0.3 83 0.1 F, mg/L 1.0 100 1.0 NO32,mg/L 45 100 50 SO42,mg/L 200 100 250 TA, mg/L 200 100 - Table 5 : Groundwater physico-chemical characteristics of Sugar town, Mandya city Sample no pH EC μs/cm TDS ppm TH mg/l Ca2+ mg/l Mg2+ mg/l Cl mg/l TA mg/l F mg/l Fe mg/l NO32- mg/l SO42- mg/l B1 6.85 979 587 312 67.2 36.48 90.12 352 0.69 0.56 8.11 98.9 B2 7.11 888 533 266 48.4 34.8 82.01 376 0.6 0.37 7.98 89.5 B3 6.89 912 547 298 52 40.32 89.87 344 0.65 0.44 6.2 95.3 B4 7.45 1109 665 333 67.6 39.36 95.85 349 0.67 0.52 6.66 98.7 B5 7.32 998 599 319 66 36.96 93.84 366 0.66 0.56 6.99 152 B6 7.01 645 387 373 70 47.52 104.58 385 0.69 0.38 7.01 168 B7 7.56 698 419 380 74.4 46.56 123 400 0.7 0.42 7.77 175 B8 6.98 801 481 300 48.8 42.72 124.2 340 0.6 0.56 7.98 183 B9 6.45 777 466 268 48 35.52 90.14 370 0.62 0.5 8.02 98.7 B10 6.55 613 368 287 50.4 38.64 92.42 379 0.64 0.48 8.18 150.6 B11 6.98 599 359 255 47.2 32.88 80.12 345 0.67 0.42 8.44 95.8 B12 6.77 800 480 269 48.4 35.52 82.32 370 0.7 0.32 8.45 85.2 B13 6.85 666 400 302 51.6 41.52 118.2 344 0.68 0.38 8.13 74.5 0 0.1 0.2 0.3 0.4 0.5 0.6 0.7 0.8 1 3 5 7 9 11 13 15 17 19 21 23 25 27 29 31 33 35 37 39 Concentration variations Sample locations F,mg/L Fe,mg/L
  • 10. Shivaprasad H et al Int. Journal of Engineering Research and Applications www.ijera.com ISSN : 2248-9622, Vol. 4, Issue 7( Version 1), July 2014, pp.112-123 www.ijera.com 121 | P a g e B14 7.01 713 428 333 54 47.52 95.84 352 0.62 0.49 6.88 72.6 B15 7.11 798 479 364 66.4 47.52 103.1 395 0.61 0.53 8.02 70.9 B16 7.23 733 440 290 49.6 39.84 91.9 333 0.66 0.36 7.12 76.2 B17 7.56 658 395 369 67.6 48 120.2 399 0.7 0.41 5.54 84.6 B18 7.65 698 419 348 55.6 50.16 101 402 0.72 0.51 8.54 98 B19 7.89 623 374 316 53.2 43.92 98.89 360 0.65 0.56 6.54 85.1 B20 6.85 705 423 288 48 40.32 82.28 364 0.61 0.48 7.54 84.6 B21 6.55 789 473 299 49.6 42 84.32 342 0.65 0.32 7.01 86.8 B22 6.45 585 351 321 52 45.84 85.58 358 0.69 0.39 7.77 79.3 B23 6.33 599 359 354 63.6 46.8 88.25 398 0.7 0.45 8.15 69.1 B24 6.85 701 421 400 84 45.6 120 450 0.63 0.51 8.02 86.2 B25 6.42 658 395 368 67.6 47.76 94.25 389 0.6 0.55 8.33 84.9 B26 6.75 988 593 321 54 44.64 95.25 360 0.66 0.49 8.45 97.34 B27 7.06 1025 615 268 48 35.52 82.01 362 0.69 0.45 8.66 84.5 B28 7.45 598 359 279 50 36.96 84.23 368 0.72 0.33 7.55 89.2 B29 7.33 912 547 299 49.2 42.24 86.96 375 0.71 0.48 7.96 79.8 B30 7.66 888 533 312 51.6 43.92 84.36 382 0.68 0.56 6.66 76.2 B31 7.84 645 387 354 64 46.56 95.25 400 0.6 0.52 6.54 85.6 B32 7.65 633 380 387 68 52.08 102.3 421 0.66 0.49 6.12 116 B33 6.45 655 393 395 71.6 51.84 111.1 435 0.63 0.46 6.09 80.35 B34 6.66 1000 600 410 75.2 53.28 120.2 465 0.61 0.43 7.87 123 B35 6.85 987 592 265 47.8 35.28 88.25 360 0.62 0.4 7.68 99.8 B36 6.39 658 394 284 49.2 38.64 89.98 355 0.66 0.46 7.95 106.8 B37 6.49 845 507 302 51.6 41.52 91.25 350 0.67 0.39 8.01 94.12 B38 7.04 888 533 333 52.8 48.24 94.25 375 0.69 0.51 8.02 136 B39 6.94 869 521 400 84.8 45.12 115.2 465 0.7 0.48 7.12 142 B40 7.28 1021 613 270 48 36 82.25 343 0.6 0.39 7.65 99.89 Where B indicates borewell water Estimation of Water Quality Index (WQI) For computing WQI three steps are followed. In the first step, each of the all parameters has been assigned a weight (wi) according to its relative importance in the overall quality of water for drinking purposes (table-7). The maximum weight of 5 has been assigned to the parameter nitrate due to its major importance in water quality assessment. Magnesium which is given the minimum weight of 1 as magnesium by itself may not be harmful. In the second step, the relative weight (Wi) is computed from the following equation: ..…………………….(1) Where, Wi is the relative weight, wi is the weight of each parameter and n is the number of parameters. Calculated relative weight (Wi) values of each parameter are also given in table-7
  • 11. Shivaprasad H et al Int. Journal of Engineering Research and Applications www.ijera.com ISSN : 2248-9622, Vol. 4, Issue 7( Version 1), July 2014, pp.112-123 www.ijera.com 122 | P a g e In the third step, a quality rating scale (qi) for each parameter is assigned by dividing its concentration of each water sample by its respective standard according to the guideline laid down in the BIS 10500 and the result is multiplied by 100. …..……………………(2) Where, qi is the quality rating, Ci is the concentration of each chemical parameter of each water sample in mg/l,Si is the sta ndard value for each chemical parameter, mg/l according to the guidelines of BIS (BIS 10500-1991). For computing the WQI, the sub index SI is first determined for each chemical parameter, which is then used to determine the WQI using the following equation SIi = Wi * qi ...........…………………………... (3) ………………………………….(4) Where, SIi is the sub index of Ith parameter, qi is the rating based on concentration of ith parameter and n is the number of parameter. The computed WQI values are classified into five types and are as shown in table no. 6 Table 6: Water quality classification based on WQI value 2, 1 WQI Value Water Quality <50 Excellent 50-100 Good 100-200 Poor 200-300 Very poor >300 Water Unsuitable for drinking Table 7: Relative weight (Wi) of each parameters Sl. Nos Parameters Indian Standards Weightage (wi) Relative Weight (Wi) Quantity Rating (qi) Sub Index (SIi) 1 pH 6.5-8.5 4 0.0952 82.47 7.85 2 EC, μS/cm 2000 4 0.0952 39.19 3.73 3 TDS, ppm 500-1500 4 0.0952 23.51 2.23 4 TH, mg/l 300-600 3 0.071 53.7 3.81 5 Ca2+ , mg/l 75-200 2 0.0476 28.95 1.37 6 Mg2+ , mg/l 30-100 2 0.0476 42.6 2.02 7 Fe, mg/l 0.3-1.0 4 0.0952 45 4.28 8 TA, mg/l 200-600 3 0.071 62.8 4.45 9 Cl- , mg/l 250-1000 3 0.071 9.63 0.68 10 F, mg/l 1-1.5 4 0.0952 43.33 4.12 11 NO32- , mg/l 45-100 5 0.119 7.54 0.89 12 SO42- , mg/l 200-400 4 0.0952 25.32 2.41 wi=42 Wi=0.998 qi=464.04 WQI=37.84 Hence, WQI for the groundwater samples from the study area is 37.84 IV. Conclusions After the careful study of analysis, interpretation and discussions of the numerical data following conclusions have been drawn for the ground water of Sugar town, Mandya city. The groundwater is crystal clear, odorless, and palatable. Most of the bore wells yield potable water with moderate mineral or dissolved salts. Water is soft in almost all the sampling points. As there is no considerable increase in chloride and sulphate, it shows that there is no possible contamination of groundwater due to percolation of polluted surface water. The concentration of nitrate and fluoride in the entire Sugar town, Mandya City is well within the
  • 12. Shivaprasad H et al Int. Journal of Engineering Research and Applications www.ijera.com ISSN : 2248-9622, Vol. 4, Issue 7( Version 1), July 2014, pp.112-123 www.ijera.com 123 | P a g e permissible limit. The hardness is reported, it is by calcium itself, which is also little higher than the permissible limits. Scaling of utensils, household boilers have been reported by survey. It has been revealed by the analysis that industrial effluents have negative effect on the quality of ground water of Sugar town, Mandya City. The water quality index (WQI) falls in the Excellent Range and hence the ground water of Sugartown, Mandya city is as considered as Excellent. The analysis reveals that the groundwater of the area, needs certain degree of treatment before consumption (at least disinfection), and it also needs to be protected from the perils of contamination. V. Acknowledgement Thanks to the principals, HOD‟s,and guide of UBDT‟s davanagere, for encouragement and support. References [1] Mangukiya R., Bhattacharya T., and Chakraborty S (2012),“Quality Characterization of Groundwater using Water Quality Index in Surat city, Gujarat, India”, International Research Journal of Environment Sciences, 1(4): 14-23 [2] Nagarajappa D P., Rajappa B., Manjappa s., and Puttaiah E T., (2011), “Physico chemical analysis of underground water of Harihara taluk of Davanagere district, Karnataka, India”, Advances in applied science research, 2(5): 143-150 [3] Shivasharanappa., Srinivas P., and Mallikarjun Huggi S (2011), “Assessment of ground water quality characteristics and Water Quality Index (WQI) of Bidar city and its industrial area, Karnataka State, India”, International journal of environmental sciences, 2(2): 965-976 [4] APHA, American Public Health Association (2003), standard method for examination of water & wastewater specifications, Washington DC, 6, 19th Edition. [5] Bureau of Indian Standards, 1993, (IS 10500:1991), Edition 2.1 [6] WHO (World Health Organization) Guidelines for drinking water quality (1993), second edition, Vol. 1, 188. [7] Shivasharanappa., Srinivas P., and Mallikarjun Huggi S (2011), “Study on physic-chemical characterictics of ground water of Bidar city and its Industrial area”, International journal of applied biology and pharmaceutical technology, 3(1): 359-367 [8] Nirdosh P, Ahmed A, Sureshbabu H, Kottureshwar N M, Jayashree M., and Nijalingappa J. (2010), “Study on the PhysicoChemical characteristics of ground water of Gulbarga City (Karnataka)” International Journal of Applied Biology & Pharmaceutical Technology, 1(2): 519 [9] Mumtazuddin S., Azad A.K., Bharti P and Ranjan R (2012) “Physico-chemical analysis of groundwater of the Budhi Gandak belt in Muzaffarpur district, India”, International Research Journal of Environment Sciences, 1(1): 7-11 [10] Patil Shilpa G., Chonde Sonal G., Jadhav Aasawari S. and Raut Prakash D (2012) “Impact of Physico-Chemical Characteristics of Shivaji University lakes on Phytoplankton Communities, Kolhapur, India”, Research Journal of Recent Sciences, 1(2):56-60 [11] Rajiv P., Hasna Abdul Salam, Kamaraj M., Rajeshwari Sivaraj and Sankar A, I. (2012), ‟Physico Chemical and Microbial Analysis of Different River Waters in Western Tamil Nadu, India, International Research Journal of Environmental Science., 1(1): 2-6 [12] Patel Payal and Bhatt S.A(2010)., “Fluoride Contamination in Groundwater of Patan District, Gujarat, India International Journal of Engineering Studies, 1(2), 171– 177 [13] Abati T (2005)., “Water Sources and treatment, food forum”, A publication of the Nigeria Institute of food science and Technology (NIFST), 4(1): 49 [14] Iyer C.S., Sindhu M., Kulkarni S.G., Tambe S.S. and Kulkarni B.D (2003), “Statistical analysis of the physico-chemical data on the coastal waters of Cochin”, Journal of Environmental Monitoring, 2(5): 324 [15] Sawyer G.N., Carthy Mc D.L (1967) ., Chemistry of sanitary Engineers, 2ndEd., McGraw Hill, New York, 1(2): 518 [16] Neeraj D., Dr. Patel J.N (2010), “Evaluation of Groundwater Quality Index of the Urban Segments of Surat City, India”, International journal of geology, 2(4):58-62 [17] Raval V.H., and Malik G.H (2010), “Physico- Chemical Characteristics of Groundwater in and around Surat City (India)”, Journal of Environmental Science and Engineering, 52(4):43-348 .