Pollution resulting from unsustainable agricultural and urbanization activities in the Ruhezamyenda and Bunyonyi catchments are threatening lake Bunyonyi. These have led to high chemical oxygen demand (COD), electrical conductivity, turbidity, pH, iron (II) concentration and low dissolved oxygen (DO5). In this study we have investigated the how COD, turbidity, pH, concentration of iron, total suspended solids, total nutrients and DO5 of water changed with distance in lake. Water sampled from different distances in the lake filtered using Whatman paper at ambient temperatures was tested for COD, electrical conductivity, turbidity, total nutrients, iron, hardness and DO5. COD was 20.8±.0.03mg/L to 16 ± 0.03mg/L; total hardness was 16.5±0.2 mg/L to 18.6 ± 0.3 mg/L total nitrate was 103.5± 2 mg/L to 88 ± 3 mg/L; total phosphate was 100.8 ±.2.5 to 87± 3 mg/L; high TSS values from 3.4 ± 0.1 mg/L to 2.5 ± 0.1 mg/L showed contamination of water. As pH decreased from 8.3 ± 0.03 to 7.6 ± 0.04 revealed that bases were getting removed. The turbidity dropped from 25.7 ± 0.3 NTU to 20 ± 2 NTU due settling down of sediments. Iron (II) concentration ranging from 1.1± 0.1 to 0.8± 0.1 mgL-1 . Dissolved oxygen decreased from 7.9 ±0.3 mg/L to 4.8 ± 0.2 mg/L indicating surface water can uphold life of aquatic organisms. Total hardness ranged from 0.22± 0.05 to 0.19± 0.05 mg/L Electrical conductivity was high and ranged from 130± 5 to 150± 5 µS/cm indicating presence of electrolytes. Lake Bunyonyi water is not greatly polluted, but requires to be safe guarded against poor unsustainable agricultural practices, sewage draining from towns, schools and hotels in nearby settlements.
Booking open Available Pune Call Girls Koregaon Park 6297143586 Call Hot Ind...
HOW PHYSICOCHEMICAL PARAMETERS OF WATER CHANGE WITH DISTANCE IN A LAKE: CASE STUDY LAKE BUNYONYIINKIGEZI
1. International Journal of Advances in Chemistry (IJAC) Vol. 7, No.1/2/3/4, November 2021
DOI: 10.5121/ijac.2021.7401 1
HOW PHYSICOCHEMICAL PARAMETERS OF WATER
CHANGE WITH DISTANCE IN A LAKE: CASE STUDY
LAKE BUNYONYIINKIGEZI
Mukasa-Tebandeke I.Z1
, *Karume I.2
, Ssebuwufu J.3
,
Wasajja H.Z4
, Nankinga, R4
, Kansiime Z1
1
Department of Chemistry, Faculty of Science, Kabale University, Uganda
2
Chemistry Department, School of Physical Sciences,
College of Natural Sciences, Makerere University, Uganda
3
University of Kisubi, Uganda
4
Departments of Earth Sciences, Wesleyan University, Connecticut USA
ABSTRACT
Pollution resulting from unsustainable agricultural and urbanization activities in the Ruhezamyenda and
Bunyonyi catchments are threatening lake Bunyonyi. These have led to high chemical oxygen demand
(COD), electrical conductivity, turbidity, pH, iron (II) concentration and low dissolved oxygen (DO5). In
this study we have investigated the how COD, turbidity, pH, concentration of iron, total suspended solids,
total nutrients and DO5 of water changed with distance in lake. Water sampled from different distances in
the lake filtered using Whatman paper at ambient temperatures was tested for COD, electrical
conductivity, turbidity, total nutrients, iron, hardness and DO5. COD was 20.8±.0.03mg/L to 16 ±
0.03mg/L; total hardness was 16.5±0.2 mg/L to 18.6 ± 0.3 mg/L total nitrate was 103.5± 2 mg/L to 88 ± 3
mg/L; total phosphate was 100.8 ±.2.5 to 87± 3 mg/L; high TSS values from 3.4 ± 0.1 mg/L to 2.5 ± 0.1
mg/L showed contamination of water. As pH decreased from 8.3 ± 0.03 to 7.6 ± 0.04 revealed that bases
were getting removed. The turbidity dropped from 25.7 ± 0.3 NTU to 20 ± 2 NTU due settling down of
sediments. Iron (II) concentration ranging from 1.1± 0.1 to 0.8± 0.1 mgL-1
. Dissolved oxygen decreased
from 7.9 ±0.3 mg/L to 4.8 ± 0.2 mg/L indicating surface water can uphold life of aquatic organisms. Total
hardness ranged from 0.22± 0.05 to 0.19± 0.05 mg/L Electrical conductivity was high and ranged from
130± 5 to 150± 5 µS/cm indicating presence of electrolytes. Lake Bunyonyi water is not greatly polluted,
but requires to be safe guarded against poor unsustainable agricultural practices, sewage draining from
towns, schools and hotels in nearby settlements.
KEYWORDS
Chemical oxygen demand (COD) , Turbidity, Nutrient concentration, Concentration of iron, Electrical
conductivity, Total hardness, Pollution, Bunyonyi catchment, pH.
1. INTRODUCTION
Bunyonyi is the largest of lake in the Kigezi region, lying at 1,973 meters above sea level
(Beadle, 1966; Green, 2009) and it receives water from Rwanda through river Kabrita but also has
an outlet to lake Mutanda through river Ruhwezamyenda. Lake Bunyonyi, the place of many little
birds, is located in south western Uganda within Kabale, Rubanda and Kisoro districts, close to
the border of Rwanda and Uganda with a width of 7 km and length of 25 km.. This calm lake
attracts migratory birds during winter, making it an ideal destination for Uganda birding safaris.
It is known for water sports and is a remarkable destination for both foreign and domestic
2. International Journal of Advances in Chemistry (IJAC) Vol. 7, No.1/2/3/4, November 2021
2
travelers. Lake Bunyonyi lies in the Ruhezamyenda catchment an area with two rain seasons in
March to May and September to November, discharges to river Ruhezamyenda in the Albert Nile
basin. The geology of Ruhezamyenda catchment is characterized by volcanic rock, and the soils
are mainly ferralitic/ferralsols (Osiru, 2006) with peat soils in the swampy areas (Rukundo,
2015).The valleys are used for growing potatoes, maize, beans, peas , sorghum, millet
(Crerar&Akurut, 2017; Osiru, 2006) This creates fast lanes for runoff waters from the steep
slopes to the lake. Despite the steep slopes there is very little evidence of terracing throughout the
catchment. As a result, there are high levels of erosion, especially during intense rainfall events.
This results in soil being washed from the upper slopes to the lower slopes and valley bottoms
thus leading to pollution.
The hills enclosing the lake used to be terraced to reduce soil erosion to this fresh water resource
in Kigezi region. Although lake Bunyonyi is threatened by pollution, it remains the main fresh
water resource in the Kigezi as it is the largest lake in the area. Hotels and schools have been
accused of draining sewerage to the lake. Unsustainable methods of agriculture, coupled to
draining of channels for agricultural and human settlement purposes have led to silting and
eutrophication of catchment areas to the lake as the peasants do not adhere to the environmental
guidelines to leave 100 meters between the Lake and their gardens. This greatly affects the
beauty of this tourist site. Although the importance of wetlands in sustaining rural livelihoods is
well known in Uganda, widespread drainage and habitat degradation occurs because of
urbanization and high population densities; the resulting land pressure has led to considerable
translocation of rural householders, which contribute to breakdown of collaborative management
of the wetlands. Towns on shores of lake Bunyonyi include Kyevu and Muko. Although wetlands
provide food, timber for construction and cooking as well as leisure and transport, thereby
ensuring hospitality, in Uganda they are under increasing exploitation is leading to depletion
without adequate conservation measures. The means utilized to raise economic gains from
wetlands by the rural poor result in escalated levels of soil erosion which leads to deterioration of
nearby water resources.
Studies aimed at finding out whether the conditions in lakes of Kabale, Kisoro and Rukungiri
would enable growth of fishing industry on them have been documented with results revealing
that all lakes had high fish production potential but the variation in water quality, resulting from
human activities may impart negatively on fish productivity if not remedied. (Tibihika et al
2016). Anthropogenic activities in the lakes of Africa have caused mass extinction of aquatic
fauna caused by environmental changes (Hecky, 1993) Most research studies in Uganda focus
lakes Victoria, Albert, Kyoga, Edward and George (Akrut, et al , 2016; Mukasa-Tebandeke et al,
2020; Ayieko et al., 2010; Hecky et al., 2010), less attention is put on the numerous minor,
satellite lakes in the south (Kizito et al., 1993) yet anthropogenic activities threaten aquatic fauna
and flora in them.
Many studies on L. Bunyonyi focused on limnology. Research results have revealed lakes in
Kigezi to be pooratfish productivity (Worthington, 1932; Worthington and Ricardo, 1936; Kizito
et al, 1993; Tibihika et al, 2016) because they revealed diminishing phytoplankton populations
resulting from increased anthropogenic activities in the catchment areas to the lakes resulting
from population growth in the urban areas on the slopes surrounding the lake basins. Fish
productivity is directly related to the physicochemical and biochemical properties of water bodies
and knowledge of how these properties vary would go a long way in facilitating means of
increasing fish productivity. So positive interventions like restocking to improve fish
productivity, both the limnological and physicochemical aspects of the water bodies should be
well documented.
3. International Journal of Advances in Chemistry (IJAC) Vol. 7, No.1/2/3/4, November 2021
3
Limnological studies on lake Bunyonyi and other lakes in the Kigezi region revealed the
complete absence of macro invertebrate species/orders from some lakes and this was related to
variations in water quality (Green 1976). The variations in quality of water were attributed to the
differences in-stream and catchment degradation along the lake shores resulting from
urbanization, unsustainable agricultural practices and industrialization (Elias et al, 2014)and this
led to complete absence or/and emergence of new macro vertebrate taxa that can withstand
environmental changes of the time (Elias et al., 2014, Likens, 2010).
Electrical conductivity expresses the ability of water to conduct electric current. It is useful for
estimating the concentration of the total dissolved electrolytes in an aquatic environment (IEPA,
1998). Lakes containing water with high pH have high conductivity values (Beadle, 1966; Kizito
et al., 1993; IEPA, 1998). The conductivity of water from lakes like Nakasanda, Kayumbu was
attributed to low concentrations of calcium, magnesium, potassium and sodium ions (Tibihika et
al 2016). However, presence of carbonates and hydrogen carbonates in presence of calcium, and
magnesium ions in the same water resource will impart high pH and hardness to the water in
addition to high conductivity. Alkalinity of a water mass depends on the formation and nature of
soils surrounding the water body or bedrock (Linntech, 2013). Highly alkaline water resources lie
in areas containing limestone because the water dissolves calcium carbonate and the carbon
dioxide dissolved in water transforms it to the hydrogen carbonate (Matagi, 2004 and Grant,
2006). High pH ranging from 6.5 to 9.0 was reported to be conducive for fish growth and
productivity (Magumba 2000; Heydarnejad, 2012). Consequently, hardness, high pH and
conductivity of water samples depend on concentrations of metal salts. Availability of metallic
and nonmetallic ions in lake waters increases conductivity of a water mass and this influences
distribution and types of aquatic organisms that survive in that water ecosystem (Gupta and
Mrinal, 2013)
Ruhezamyenda catchment is the watershed across which all water that reaches lake Bunyonyi
flows. Anthropogenic activities in watersheds affect the quality of surface, drinking and
recreation water. Proliferation of algae in water masses resulting from fertilizers in runoff water
from agricultural fields disturbs health of watersheds (Bellir, 2013). Polluted watersheds affect
wildlife, is harmful to man, and affects aquatic life, offset changes in the ecosystems (EPA).
Introduction of fertilizers in water bodies increase rate of growth of algae and weeds in water
(Srinvasan, 2011).
Oxygenation of water masses removes phosphates and nitrates by converting them to solid
sediments at floor of lake and this improves quality of the water mass (Kennedy et al. 2018). The
anoxic nature of lake Bunyonyi leads to high nutrient concentrations in water sampled from it.
As microorganism proliferate in a water body, toxins like ammonia increase in addition to
nitrates and nitrites. Accumulation of nutrients in water bodies result in nutrient pollution which
disrupts aquatic life (Jiang et al. 2006). In the Ruhezamyeda catchment agricultural practices are
n the rise coupled to use fertilizers and manure in poorly managed farms; reclamation of
marshland and creation of urban centers and school have significantly contributed to increase in
nutrient load in the streams that drain to lake Bunyonyi. Increased agricultural practices
involving marshland reclamation in the Ruhezamyenda catchment have led to increased sediment
and nutrient loading in the lake through non-point source pollution (Machiwa, 2003). Pollutants
affecting the quality of water in lake Bunyonyi must largely arise from non-point sources
especially after rain because soil erosion coupled to surface runoff from the steep slopes in the
Ruhwezamyenda catchment area and intensive agricultural practices must load the lake more
prominently in a manner similar to what was reported about Murchison bay of lake Victoria
(Banadda et al.2009). The revelation that 55% of total phosphorous in put in lake Victoria arises
from municipal waste and agricultural fields (Tamatamah et al 2005) leaves us guessing about
4. International Journal of Advances in Chemistry (IJAC) Vol. 7, No.1/2/3/4, November 2021
4
how much enters lake Bunyonyi. The extensive growth of algae in the Murchison bay was
explained as arising from high loads of nutrients in water mass caused by high levels of pollution
(Cozar et al. 2007; Haande et al. 2011) similar effects are expected for lake Bunyonyi waters.
The quality of water in the Bunyonyi catchment must be affected by the high population and
unsustainable agricultural practices of the populace much the same way as that of the Murchison
Bay was shown to be influenced by nutrients loading in runoff from the catchment and urban
centers upstream (Cózar et al. 2007; Bracchini et al. 2007). Bunyonyi waters must be eutrophic
due to the very high total nitrate content (Tibihika et al. 2016) because nitrogen was reported to
bring eutrophication to the Murchison Bay (Haande et al. 2011; Ssebiyonga et al. 2013).
As water runs over and through the Ruhezamyenda catchment, it picks and carries contaminants
and soil. If untreated, pollutants wash directly to Bunyonyi catchment. The contaminants may
infiltrate the ground water, and concentrate in streams wherefrom they are carried to the lake.
Agricultural practices in the hinterland to Bunyonyi catchment greatly affect the purity of water
in the lake (Singh et al. 2018). The presence of homes, schools, hotels and large agrictural fields
in the Ruhwwezamyenda catchment of lake Bunyonyi increased the speed with which running
ater approaches the lake. This implies that the natural cleaning action of swaps is overwhelmed
and pollutants access the lake with ease in much the same way as was reported elsewhere (Aliet
al. 2014).
Whereas the amount of total suspended solids (TSS) and turbidity affect waterways in the world,
TSS was reported as the major pollutant which affects waterways (Rugner, 2013). It can be
necessary to predict TSS of a wter mass in quality control (Verma et al, 2013). Suspended solids
are cause deterioration of quality of water (Bilotta et al. 2008)
While some zooplanktons may disappear when exposed to pollutants like heavy metals and
excess nutrients which lead to eutrophication (Wava and Chande, 2004) others may survive the
harsh conditions through adaptation.
Most lakes show a decline in dissolved oxygen (DO) with depth but do not turn anoxic, yet it was
reported that Bunyonyi turns anoxic at depth near 15 m in dry seasons and 39 m in the rainy
seasons indicating there occurs mass death of aquatic organisms that live below 15 m due to lack
of oxygen (Hughes, 1992, Tibihika et al 2016) and as a consequence levels of nutrients rise in the
water.
This study aimed at investigating how physicochemical characteristics of water change with
distance into the lake.
2. MATERIALS AND METHODS
Study area
The study was carried out in Lake Bunyonyi basin in Uganda, Figure 1b, located at 1° 20’ 42"
South and 29° 51’ 1" East. Ruhwezamyenda catchment has many deep valleys in an area of over
300 km2
lying at nearly 2000 m above sea level (Kristan et al, 2006) The soils are pf the old pre-
cambrian period made of metamorphic granitoids (Chemining wa et al. 2003) and are use in
growing beans, maize, potatoes, peas and vegetables (Osiru, 2006). Lake Bunyonyi is surrounded
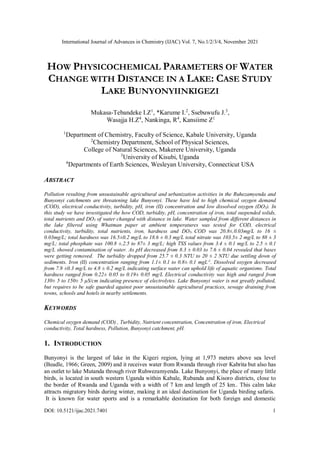
by steep escarpments that allow gentle flow of winds on its surface. As can be observed in Figure
1a, the waters of Bunyonyi are always calm without tides.
5. International Journal of Advances in Chemistry (IJAC) Vol. 7, No.1/2/3/4, November 2021
5
Figure 1a. Appearance of lake Bunyonyi and some islands
The non-turbulent nature of the lake may not easily allow exchange of oxygen with the
atmosphere unless it rains. The wind blows very gently and tides are very low. Interface between
air and water is restricted mainly to water at the surface of the lake, so aeration is minimized.
Figure 1b. Lake Bunyonyi and connecting roads
6. International Journal of Advances in Chemistry (IJAC) Vol. 7, No.1/2/3/4, November 2021
6
Sampling
Water samples (2 L) were drawn at distances of 0, 50, 100, 150 and 200m in the lake, sealed
stored in box before being transported to the laboratory. In the laboratory the water was stored in
a freezer at 4 °C for future use (Abdur, 2013).
Method of determining chemical oxygen demand (COD)
Potassium dichromate (6.2 g) was dissolved in distilled water (1000 mL). The solution was
stoppered and stored for future use.
Preparation of silver (I) sulfate-sulfuric acid solution
Silver (I) sulfate (10g) was dissolved in sulfuric acid solution (500mL). The mixture was swirled
and made up to 1L and allowed to stand for 24 hours before being used.
Preparation of mercury (II) sulfate-sulfuric acid solution
Mercury (II) sulfate (0.1g) was dissolved in concentrated sulfuric acid (5mL).
Preparation of 0.025M ammonium iron (II) sulfate solution
Ammonium iron (II) sulfate (9.8g) was dissolved in distilled water (100mL) and concentrated
sulfuric acid (20mL) was added and mixture made up to 1 L with distilled water.
Ferroin indicator preparation
Mixture of iron (III) sulfate (3.5 g) and phenanthroline (7.3 g) was dissolved in water (500 mL),
and stored for future use.
COD TEST
Mixture made of sample (10 mL), glass beads, mercury (II) sulfate (1 mL) potassium dichromate
(10 mL), silver (I) sulfate (1 mL) and sulfuric acid (15 mL) was placed in refluxing apparatus.
and heated for two hours, then allowed to cool and transferred to flask. Ferroin indicator (.2
drops) was added and mixture titrated with standard iron (II) sulfate solution to blue end point.
COD was calculated.
Phosphate standard reagent
Potassium dihydrogen phosphate (1.4 g) was dissolved in distilled water (1 L). (APHA, 1999)
Preparation of Combined Reagent
5N sulfuric acid was prepared by measuring 98% concentrated sulfuric acid (14 mL) into a 100
ml volumetric flask and diluting to the mark with distilled water. Potassium antimonyl tartrate
(0.2742g) was accurately weighed into a 100 mL volumetric flask and diluted with distilled water
to the mark. Ammonium molybdate (4 g) was mixed with ascorbic acid (1.8 g) and dissolved in
distilled water (100 mL)
7. International Journal of Advances in Chemistry (IJAC) Vol. 7, No.1/2/3/4, November 2021
7
To prepare the combined reagent, 5N sulfuric acid (50mL), potassium antimonyl tartrate solution
(5mL), ammonium molybdate solution (15 mL), and ascorbic acid solution (30 mL) was
measured into a 100 mL volumetric flask.
Analysis for phosphate ions
Each of the standards (10 mL), blank (10mL) and samples (10 mL) were measured into a test
tube. combined reagent (2 mL) was added to the standards, blanks and samples and two drops of
phenolphthalein indicator and left to stand for 10 minutes then observed in a UV-visible
spectrophotometer.
Determining turbidity
Distilled water was filtered with whatman filter number 42. Rinse collecting flask at least twice
with such filtered water and discard the next 200 mL. The filtered water was used for setting zero
of the instrument.
Preparation of Formazine Turbidity Concentrate
(a) Solution I
Hydrazine sulphate (NH2)2H2SO4 (5 g) was weighed to a 500 mL volumetric flask and distilled
water (500 mL) was added to make up to the mark. The mixture was left to stand for 4 hours.
(b) Solution II
Hexamethylene tetramine (CH2)6N4 (50g) was weighed to a 500 mL volumetric flask and distilled
water (500mL) was added to the mark. Equal volumes of solution I and II were mixed to form
formazine turbidity concentrate and allowed to stand for 48 hour.
Preparation of Formazine Standard
Formazine turbidity concentrate (25mL) was diluted to 1 liter with turbidity free distilled water to
obtain 250 ppm or 100 NTU for setting '100' of the instrument.
Calibrating turbidmeter
The turbidimeter was switched on. The lid of the sample compartment was opened. A test tube
filled with distilled water was inserted in the sample compartment. The lid was closed. The
instrument was adjusted to get '0' displayed on the read out. The lid was opened again. The test
tube full of distilled water was replaced with another tube full of formazine standard. The lid was
closed. The instrument was adjusted using 'SET 100' control to obtain '100' displayed on the read
out.
Turbidity test sample
NTU of sample =
A (B + C)
C
8. International Journal of Advances in Chemistry (IJAC) Vol. 7, No.1/2/3/4, November 2021
8
where, A = NTU found in diluted sample;
B = volume of dilution water in mL;
C = sample volume taken for dilution in mL
Determining total hardness
Lake water (25. 0 mL) was pipetted to flask, dilute nitric acid (5 mL) added followed by buffer
solution (10 mL), 1% sodium sulfide solution (5 mL) and indicator (3 drops) The mixture was
titrated with standard EDTA solution to blue-violet end point.
Determining iron in water
Colorimetric method using standard solutions of iron (II) sulphate mixed with 0.25% ortho-
phenanthroline were made to make standard curve. From the calibration curve, absorbance of
unknown mixture of iron in water mixed with 0.25% ortho-phenanthroline were used to read off
concentrations.
Determining TSS
Followed standard method 2540.
It involved filtering water (50 mL) through weighed filter disk.
Total nitrate in water
Followed a method in which water (50 mL) was evaporated to dryness at water bath. The residue
was dissolved sodium hydroxide in presence of phenol disulphonic acid and absorbance of
solution determined at wavelength of 410 nm.
Determination of dissolved oxygen, DO5
Followed standard method in which water (25.0 mL) was placed in reaction flask, and added 2M
sodium hydroxide (10.0 mL) then 1M manganese (II) chloride solution(10 mL) and 10%
potassium iodide. The iodide formed was titrated with standard thiosulfate solution.
Determining pH
It involved using calibrated pH meter Jenway 370pH/mV/temperature meter.
Determining conductivity
It involved using calibrated using Jenway 4520 conductivity/TDS meter
3. RESULTS AND DISCUSSION
Physical parameters of lake Bunyonyi waters
It is common to determine COD, BOD, pH, turbidity, TSS, nutrient, iron and hardness of water to
assess safety of a fresh water resource. Of these parameters, lake Bunyonyi waters sampled on 14th
February, 2020 showed COD ranging from 20.8 to 16mg L-1
, turbidity ranging from25.7to20NTU,
pH ranging from 8.3 to 7.6; iron (II) concentration ranging from 1.1 to 0.8mgL-1
; total hardness
ranged from 0.22 to 0.19 mg/L; TSS ranged from 3.4 to 2.5 mg L-1
; DO ranged from 7.9 to 4.8
9. International Journal of Advances in Chemistry (IJAC) Vol. 7, No.1/2/3/4, November 2021
9
mg/L; TP ranged from 100.8 to 87mg L-1
yet TN ranged from 103.5 to 88mg L-1
in a distance
ranging from 0m to 200m in the lake. This revealed the impurities were dispersing as we moved in
the lake. The environmental protection agency (EPA) published the following water parameters
for water safe for human consumption; COD10.0mgL-1
, turbidity 5NTU, pH range of 5-9 and iron
(II) concentration of 2.0mgL-1
. Basing on parameters published, the waters of lakeBunyonyi can
be declared polluted.
Variation of total hardness
The concentration of calcium ions present in lake Bunyonyi water was higher than for magnesium
ions for all the samples analyzed indicating that basal rock, agricultural inputs and soils in the
catchment areas to the lake contained more calcium than magnesium. Concentrations of calcium
and magnesium decreased as distance into the lake increased revealing the lake acted on elements
of hardness. The data on total hardness of Bunyonyi water was plotted in Figure 2 below.
Figure 2. Plot of total hardness against distance in the lake.
From Figure 2 it can observed that concentrations of ions that cause hardness of water decreased
as distance increased in the lake. The fall in total hardness may have resulted from transformation
of soluble calcium and magnesium salts to insoluble salts that eventually deposited on the lake
bed. Similarly, coagulation of metal ions with the colloids suspended in water may have resulted
in neutralization of charges with a consequence of removing the ions from water. So, hardness
decreased with increase in distance in the lake.
Variations in turbidity of water
Water turns turbid when there is suspended matter such as particles of clay, silt, finely divided
organic and inorganic matter, soluble colored organic compounds, plankton and other
microscopic organisms in it. Although we can not rely onturbidity measurements to infer
concentration in mass/volume of suspended solids because light scattered by suspended solids
depends on size, shape and refractive indices of particles, turbidity expresses the haziness of the
water sample tested. Clarity of water is important for human consumption and manufacturing
processes such as beverages, and many food products need clear water. So, turbidity of fresh
0.185
0.19
0.195
0.2
0.205
0.21
0.215
0.22
0.225
0 50 100 150 200 250
Total
harness/g/L
Distance in the lake/m
10. International Journal of Advances in Chemistry (IJAC) Vol. 7, No.1/2/3/4, November 2021
10
water resources like lake Bunyonyi must be monitored regularly because it is the main source of
water for domestic use in Kabale town. Water from the lake had high turbidity because it
contained impurity sediments. The turbidity of water varied as shown in Figure 3 below.
Figure 3. Plot of turbidity of water against distance travelled in lake
Suspended solid sediments enter the lake from the nearby soil surfaces by erosion and haziness of
the water body must be higher at places near the soil surface than inside the lake. The turbidity of
water decreased as we moved in the lake probably due to dilution as influent got mixed with water
in the lake. So suspended solids became dispersed leading to higher clarity. It was reported that
dilution or/and neutralization of electrostatic charges on particles in water leads to removal solids
from water and this decreases turbidity as shown in graph above(Brachin et al. 2011)
The trend of COD in lake Bunyonyi
COD expresses the quantity of oxidizable impurities in wastewater or sample of water() and so
level of inorganic and organic pollution of lake Bunyonyi was determined from COD. There was
decrease in COD with increase in distance into the lake showing level of pollution water
decreased. The lake underwent self-purification decreasing oxidizable inorganic and organic
pollutants as distance increased in the lake.
0
5
10
15
20
25
30
0 50 100 150 200 250
Turbidity/NTU
Distance in lake / m
11. International Journal of Advances in Chemistry (IJAC) Vol. 7, No.1/2/3/4, November 2021
11
Figure 4. Trend of variation of COD with distance
The decrease in COD as one moves from the shores into the lake resulted from dilution of
incoming water by the large volume of water in the lake. Similarly discharge of electrostatic
charges on suspended solids in the water must have led to massive precipitation and eventual
settling of solids at bottom of the lake and this resulted in further decrease in COD as observed in
the trend above (Brachin et al. 2011) This indicated dilution of pollutants in water(Akurut et al.
2017).
Variation of conductivity
The mean electrical conductivity of lake Bunyonyi decreased from 278 to 245 µs/cm in a distance
of 0 to 200 m in the lake revealing fall in concentration of dissolved salts in water. The electrical
conductivity of water body is directly proportional to the concentrations of dissolved salts. So, the
high electrical conductivity values observed for Bunyonyiwater were indicative of high
concentrations of salts in it (Abdallah et al, 2006;TrivediandGoel, 1986). However, the values
obtained were less than maximum level of 1000μS/cm for fresh water samples. High conductivity
values implied presence inorganic ions from salts in water. The conductivity of lake
Bunyonyiwater was quite high indicating presence of strong electrolytes. The source of the salts
present in the water must be pollution resulting from unsustainable agriculture and contamination
of the lake with surface runoff from the rainy events. Running water dissolved fertilizers and salts
present in soils to raise the conductivity. The variation of conductivity of water with distance is
shown in Figure 5 below
0
5
10
15
20
25
0 50 100 150 200 250
concntration
of
COD/
mg/L
Distance in lake/m
12. International Journal of Advances in Chemistry (IJAC) Vol. 7, No.1/2/3/4, November 2021
12
Figure 5. Plot of conductivity versus distance at which water was sampled in the lake
The conductivity of water sampled from lake Bunyonyi decreased as distance into the lake
increased revealing the lake was undergoing purification and a similar fall was observed for
hardness. Since conductivity arises out of presence of electrolytes and the study had shown
presence of calcium and magnesium ions in Bunyonyi waters, it is probable that the fall in
concentrations of metal salts with increasing distance in the lake led to fall in conductivity too.
Changes in pH of water with distance in lake
The pH of water was high at shores of the lake because water entering had run over soil bearing
basic minerals like calcite that readily dissociate to hydrogen carbonate ions in presence of
carbon dioxide dissolved in water.
As the lake lies in region with slopes bearing limestone, probable presence of calcium hydrogen
carbonate formed as calcite and limestone reacted with carbon dioxide dissolved in running water
is under scored. The pH of water decreased with increase in distance in the lake. This showed that
the lake acted on the ions that cause alkalinity of the water in self-purification. During the study
the pH fell from as high as 8.3to as low as8.0.The data on variation of pH with distance in the lake
was plotted in Figure 6 below.
245
250
255
260
265
270
275
280
0 50 100 150 200 250
Conductivity/µS/cm
Distance in the lake/m
13. International Journal of Advances in Chemistry (IJAC) Vol. 7, No.1/2/3/4, November 2021
13
Figure 6. Plot of pH against distance in the lake
From Figure 6 it can be inferred that the ions that cause alkalinity of the water body decreased as
the distance in the lake increased. Since the hydrogen carbonates and carbonates of calcium,
magnesium, sodium are known to exist in natural water bodies, in-situ reactions between the ions
present the freshwater sample must have resulted in decrease in pH because sodium salts are less
readily hydrolyzed than magnesium or calcium due to lower charge on sodium than calcium or
magnesium ions. It was reported that high pH of water in lakes results from the alkaline salts like
carbonate and hydrogen carbonates in soils surrounding the water mass or the bedrock of the lake
(Linntech, 2013; MacAdam, & Parsons, 2004). So high alkalinity of Bunyonyi water results from
limestone. Details of alkaline nature of lake Bunyonyi was shown to have no effect on fish
productivity (Matagi, 2004; Grant, 2006 and Heydarnejad, 2012).
Changes in concentration of iron in the lake
Although the EPA set standard for concentration of iron in safe drinking water of 0.3 mg/L is by
far less than what was found in lake Bunyonyi, people living at the lake shores drink the water
without treating it. Determining concentration of iron (II) ions in a water sample gives hint on
level of heavy metal pollution. It was reported that concentrations of iron exceeding 1.0 mg/Lis
detrimental to freshwater fish (EPA). The concentration of iron decreased from 1.1 mg/L to 0.8
mg/L in a distance of 200m from the shore. These low ranges of of concentration of iron can be
relied on to assert that lake Bunyonyi water is free from heavy metal pollution because world
health organization (WHO) set the range to be between 0.5 and 50 mg/L The concentration of
iron decreased as distance in the lake increased as shown in Figure7below
7.95
8
8.05
8.1
8.15
8.2
8.25
8.3
8.35
0 50 100 150 200 250
pH
Distance in lake/ m
14. International Journal of Advances in Chemistry (IJAC) Vol. 7, No.1/2/3/4, November 2021
14
Figure 7. Plot of [Fe2+
] versus distance in lake
The fall in concentration of iron with increase in distance in the lake was interpreted as a
manifestation that the lake through the mechanism of self-purification relieved itself of pollutants.
So, the water from lakeBunyonyi is free from iron a major inorganic water quality problem which
arises fromFe2+
(BGS2001).
Change in concentration of dissolved oxygen in the lake
The concentration of dissolved oxygen decrease with increase in distance from the shores of the
lake probably due to lack of strong winds which would easily cause air and water to mix. The
lake surface has still air flow as the lake lies between steep hills. The concentration of dissolved
oxygen fell from an average value of 7.8 mg/L to 5.8 mg/L in a distance of 200 m. The
concentration of oxygen in water at surface of a lake nearly 40 m deep is seen as being very small
because the lake is too deep and it is not surprising that the lake bottom is anoxic. This low
concentration of oxygen revealed there were micro-organisms in water depleting the oxygen as
they decompose matter under the water surface. Fish is only likely to survive in areas of the lake
with short depth (Hughes, 1992, Tibihika et al 2016). A plot of concentration of oxygen versus
distance is shown in Figure 8 below.
0
0.2
0.4
0.6
0.8
1
1.2
0 50 100 150 200 250
[Fe
2+
]
Distance in the lake/ m
15. International Journal of Advances in Chemistry (IJAC) Vol. 7, No.1/2/3/4, November 2021
15
Figure 8. Plot of concentration of DO5 versus distance in lake/m
As shown in Figure 8 above, concentration of oxygen decreased with distance in the lake due to
probable increase in quantity of microorganisms in the lake that depleted oxygen revealing the
water harbors microbials that deplete oxygen from the water.
Trend of concentration of phosphates in lake
The total phosphate (TP) concentration of the lake is high probably due to poor agricultural
practices of the farmers in the Bunyonyi and Ruhwezamyenda catchment areas following
breakdown of the terrace farming in some areas. So erosion of soils from farm land where
phosphate fertilizers are used extensively is greatly affecting the lake. The TP values decreased
from 100.8 to 87.0 mg/L in a distance 200 m from the shores indicating the lake undergoes self-
purification see Figure 9 below.
Figure 9. Plot of [TP] versus distance in lake
0
1
2
3
4
5
6
7
8
9
0 50 100 150 200 250
Diissolved
oxygen/
mg/L
Distance/m
DO5
86
88
90
92
94
96
98
100
102
0 50 100 150 200 250
[TP]mg/L
Distnace in lake/m
16. International Journal of Advances in Chemistry (IJAC) Vol. 7, No.1/2/3/4, November 2021
16
The determined phosphate ion concentration in lake Bunyonyi is in agreement with what was
published by other workers (Tibihika et al. 2016) and much higher than what was published for
lake Victoria and the bays and gulfs on lake Victoria , 0.022mgL-1
for Nyanza gulf (Heckey and
Bugennyi, 1992); 0.1 -4.5 mgL-1
for Murchison bay (Akurut et al. 2017, 2 014). This has revealed
that lake Bunyonyi higher suffers phosphate pollution than Lake Victoria. The extent of
phosphate pollution for the lake is almost constant over many years as adduced data is in
agreement with what was published in 2016 (Tibihika et al. 2016) but requires remedy because
nutrients cause algal blooms on water surfaces which deplete oxygen for fish and other aerobic
organisms living under the water. Although the very high TP in lake Bunyonyi was reported to to
correspond to chlrophyll a in the lake(Tibihika et al, 2016) here should be concern over the use of
herbicides near the lake which cause massive death of weeds that enter and settle at bottom of
lake, deplet oxygen as they rot and release phosphates to water mass(Mainstone and Parr.2002;
Srivassan, 2011). The determined concentration of TP in lake Bunyonyi water is above the
maximum recommended to be present in freshwater used for drinking purposes (EPA and this
reveals that lake receives phosphate polluted waters containing fertilizers and sewage. The level
of phosphate pollution Bunyonyi waters is as high as that for springs in western rift valley of
Kenya (Swammy et al. 2018).
As observed from Figure 9 above, the concentrations of the phosphate decreased with increase in
distance in the lake due to dilution effects.
Variations in nitrate concentration
The nitrate/nitrogen concentrations of water sampled in February 2020 ranged from 100.3 to 87+
0.3 mgl-1
indicating nitrate pollution was very high. The concentrations of total nitrogen
determined for Bunyonyi water is consistent with what was observed earlier (Tibihika et al, 2016)
but it is much higher than reported values for Lake Victoria in which concentration of nitrogen in
the Murchison Bay ranged from as low as 6 to 17 mgL-1
(Akurut, et al. 2017) and 12.3 to 18.2
mgL-1
(Mukasa-Tebandeke et al, 2020). The high nitrate pollution of Bunyonyi water is likely to
be due to sewage spillage, fertilizer application in farms near or in wetlands that drain water
runoff in the Ruhezamyenda catchment. It is also possible that herbicides and algaecides enter
waters in lake resulting killing off of weeds and algae in lake water. Mass death green plants in a
water mass results in eutrophication as the depletion of oxygen in the lake results in release of
much more nitrates than would not occur if the herbicides and/or algaecides never reached the
lake (Srinivassan, 2011). The data on changes in concentrations of total nitrate with increase in
distance in the lake was plotted in Figure 10 below.
17. International Journal of Advances in Chemistry (IJAC) Vol. 7, No.1/2/3/4, November 2021
17
Figure 10. Plot of [TN] versus distance in lake
From Figure 10 it was observed that total concentration of the nitrate decreased with increase in
distance in the lake probably due to dilution or/and neutralization of charges on ions and
electrostatic charges on suspended colloids in water resulting in settling of ions in the bed
sediments of the lake (Brachin et al. 2011). However, higher concentrations on total nitrate in
lakes of Kigezi was explained as corresponding to higher concentrations of chlorophyll in the
lake (Tibihika et al. 2016). Higher than 3.0 mg/L of TN was observed for Bunyonyi water which
is the recommended value by WHO. This has been reported to imply that very low concentration
of dissolved oxygen in the water and reduces chances of aquatic fauna and flora including fish.
High TN indicates that water is polluted by sewage, fertilizers, animal manure and wastewater.
High concentrations of TN were reported for water from rivers Awash and Walleme of Ethiopia
(Minuta and Jini, 2017; Eliku et al, 2018).
Variations in TSS
The total concentration of solids suspended in waters of lake Bunyonyi decreased with distance
in the lake from 3,3 to 2.7± 0.2 mgL-1
indicating lower level of pollution by suspended solids as
compared to Lake Victoria (Akurut et al. 2014). As suspended solids concentration critically
affects life of fish and other aquatic organisms, low TSS for Bunyonyi water would stimulate fish
productivity. The low TSS showed that the flow of surface runoff to both Ruhemyenda and
Bunyonyi catchments is slow. So, sediments readily settle down as the water flows to the lake.
The data on TSS and distance in the lake was plotted in Figure 11 below.
86
88
90
92
94
96
98
100
102
104
106
0 50 100 150 200 250
[TN]/
mg/L
Distance in lake / m
18. International Journal of Advances in Chemistry (IJAC) Vol. 7, No.1/2/3/4, November 2021
18
Figure 11. Plot of [TSS] against distance in lake
As observed in Figure 11, the concentration of TSS decreased with increase in distance in the
lake. The concentration of total amount solids suspended in Bunyonyi waters decreased with
increase in distance in lake from 3.3 to 2.7± 0.2 mgL-1
and this was in agreement with what was
published earlier (Tibihika et al, 2016) but was ten times less than what was determined for
Murchison Bay (Akurut et al. 2018; Mukasa-Tebandeke et al. 2020). The changes in TSS with
distance inlake were reported to result from dilution of influent water as it enters the larger mass
and neutralization of electrostatic charges on suspended solids as water mixes up (Brachin et al.
2011). Such high TSS as obtain for Bunyonyi water reveals that the water body is polluted by
large masses of suspended solids of insoluble and soluble materials.
CONCLUSIONS
Bunyonyi waters are polluted by nutrients, so electrical conductivity and concentrations of total
nitrate and phosphate determined in this study are very high so water is polluted. The COD,
electrical conductivity, concentrations of nutrients and TSS decreased as distance increased in the
lake due to dilution.
Concentrations changed as follows: COD was 20.8±.0.03mg/L to 16 ± 0.03mg/L; total hardness
was 16.5±0.2 mg/L to 18.6 ± 0.3 mg/L total nitrate was 103.5± 2 mg/L to 88 ± 3 mg/L; total
phosphate was 100.8 ± .2.5 to 87± 3 mg/L; high TSS values from 3.4 ± 0.1 mg/L to 2.5 ± 0.1
mg/L showed contamination of water. As pH decreased from 8.3 ± 0.03 to 7.6 ± 0.04 revealed
that bases were getting removed. The turbidity dropped from 25.7 ± 0.3 NTU to 20 ± 2 NTU due
settling down of sediments. Iron (II) concentration ranging from1.1± 0.1to0.8± 0.1mgL-
1
.Dissolved oxygen decreased from 7.9 ±0.3 mg/L to 4.8 ± 0.2 mg/L indicating surface water can
uphold life of aquatic organisms. Total hardness ranged from 0.22± 0.05 to 0.19± 0.05 mg/L
Electrical conductivity was high and ranged from 130± 5 to 150± 5 µS/cm indicating presence of
electrolytes. Waters of Bunyonyi are fresh, less polluted but need to be protected from poor
unsustainable agricultural practices to remain safe for human use
0
0.5
1
1.5
2
2.5
3
3.5
0 50 100 150 200 250
[TSS]
/
mg/L
Distance in lake /m
19. International Journal of Advances in Chemistry (IJAC) Vol. 7, No.1/2/3/4, November 2021
19
RECOMMENDATIONS
Schools, urban centers and hotels in the Bunyonyi and Ruhezamynda catchments should not be
allowed to drain in the area The terracing of farm land should be strictly observed to reduce
influx of nutrients beyond farm land.
ACKNOWLEDGEMENT
We are greatly indebted to Mr. Ruhara R. Budigi for the instruments used in analyzing the water.
REFERENCES
.
[1] Abdullah MH, Ying L, Aris AZ, Park JH. (2007): Water chemistry in downstream region of Tuaran
River: A preliminary assessment on seawater intrusion due to sea level rise. In: Park JH, Inam E, Kim
KW (eds) Proceedings of the 1st International Workshop on Climate Change Impacts on Surface Water
Quality in East Asian Watersheds, Chuncheon, Korea. 2007. p. 100–104.
[2] Abdur R., Zafor M.A and Rahman M. (2013). Surface water quality and risk assessment in the
vicinity of Sylhet City¸ International Journal of Water Resources and Environmental Engineering, Vol.
5(1), 29- 34
[3] Akurut, M., Niwagaba, C. B., & Willems, P. (2014a). Potential impacts of climate change on
precipitation over Lake Victoria, East Africa, in the 21st Century. Water, 6 (Water Resources in a
Variable and Changing Climate) (pp. 2634– 2659). doi:10.3390/w6092634.
[4] Akurut, M., Willems, P., & Niwagaba, C. B. (2014b). Assessing the influence of Lake Victoria flux on
the Inner Murchison Bay water quality. In C. Brebbia (Ed.), Water Pollution XII, Algarve, Portugal
(vol. 182, pp. 51–62). WIT Transactions on Ecology and The Environment, WIT Press. doi:10.2495
[5] Akurut, M.: Niwagaba, C. B. Niwagaba & Willems, P. (2017) Long-term variations of water quality
in the Inner Murchison Bay, Lake Victoria Environ. Monit. Assess 189:22 DOI 10.1007/s10661-016-
5730-4
[6] Ali, S. M., Khalid, A. R., & Majid, R. M. (2014). The removal of Zinc, Chromium and Nickel from
industrial waste water using Corn cobs ,55(1), 123 – 131
[7] American Public Health Association (1999). American Water Works Association, Water Environment
Federation.
[8] American Public Health Association (2003). Standard Methods for the Examination of water and
Waste Water, 20th ed. Method 4500 E
[9] Ayieko MA, Ngong’a MFO, Tamale A (2010). Climate change and the
[10]Bacchin, P;. A. Marty; P. Duru; M. Meireles ; P. Aimar (2011). Colloidal surface interactions and
membrane fouling: Investigations at pore scale Advances in Colloid and Interface Science 164, 2–11
[11]Bracchin, P;. A. Marty; P. Duru; M. Meireles ; P. Aimar (2011). Colloidal surface interactions and
membrane fouling: Investigations at pore scale Advances in Colloid and Interface Science 164, 2–11
[12]Bracchini, L., Loiselle, S.A., Tognazzi, A., Dattilo, A.M., Focardi, S.,Cózar, A., (2007). The optical
qualities of shallow wetland lined bays in Lake Victoria. Wetl. Ecol. Manag., 15, 509–519.
[13]Banadda, E. N., Kansiime, F., Kigobe, M., Kizza, M., & Nhapi, I. (2009). Landuse-based nonpoint
source pollution: a threat to water quality in Murchison Bay, Uganda. Water Policy, 11, 93–104.
doi:10.2166/wp.2009.106.
[14] Batagoda, B.M.S., Turner, R.K., Tinch, R. and Brown, K. (2000). Towards Policy Relevant Ecosystem
Services and Natural Capital Values: Rainforest Non-Timber Products. Global Environmental Change
Working Paper 2000-06, Centre for Social and Economic Research into the Global Environment,
University of East Anglia and University College London.
[15]Beadle LC (1966). Prolonged stratification and deoxygenation in tropical Lakes. I. Crater lake
Nkugute, Uganda, compared with Lakes Bunyonyi and Edward. 11(2):152.
[16]Bellir, K., Lehocine, M.B. and Meniai, A.-H., (2013): Zinc removal from aqueous solutions by
adsorption onto bentonite. Desalination Water Treatment, 51, 5035–5048.
[17]BGS.(2001) Groundwater Quality: Uganda, London, British Geological Survey. Nottingham, UK, USA
[18]Bilotta, G. S., & Brazier, R. E. (2008). Understanding the influence of suspended solids on water
quality and aquatic biota. Water research, 42(12), 2849-2861.
20. International Journal of Advances in Chemistry (IJAC) Vol. 7, No.1/2/3/4, November 2021
20
[19]Chemining’wam G., Mulagoli, I., Mwonga, S., Ndubi, J., Tum, J. and Tulyamureeba, G. 2005. Kabale
apples: Boom or Burst. A study to develop strategies to exploit market opportunities for apple farmers
in Kabale, Uganda. www.icra-edu.org/file.php/124/ wd125.pdf. Accessed on 5th April 2020.
[20]Cózar, A., Bergamino, N., Mazzuoli, S., Azza, N., Bracchini, L., Dattilo, A., (2007). Relationships
between wetland ecotones and inshore water quality in the Ugandan coast of Lake Victoria. Wetlands
Ecology and Management, 15, 499– 507. doi:10.1007/s11273-007-9046-6.
[21]Crerar, S., & Akurut, M. (2017). Advancing Uganda’s NAP Process in the water sector (Scoping field
mission report). Internal Unedited Document.
[22]Elias JD, Ijumba JN, Mgaya YD, Mamboya FA (2014). Study on Freshwater Macro-
invertebrates of some Tanzanian Rivers as a Basis for Developing Biomonitoring Index for
Assessing Pollution in Tropical African Regions. J. ecosyst. 8(2014):985389.
[23]Eliku T,and Leta S. (2018)Spatial and seasonal variation in physicochemical parameters and heavy
metals in Awash River, Ethiopia. Appl Water Sci 2018, 8: 177
[24]Grant WD (2006). Alkaline environments and biodiversity, in extremophiles. Encyclopaedia of
life support systems (EOLSS). G. Charles and G. Nicolas. Oxford, UK, Eolss Publishers.
[25]Green J (2009). Nilotic Lakes of the Western Rift. 17 King Edwards Grove, Teddington, Middx.
TW11 9LY, UK.
[26]Green J (1976). Changes in zooplankton of Lakes Mutanda, Bunyonyi and Mulehe (Uganda).
Freshwater Biol. 6:433-436.
[27]Gupta T, Mrinal P (2013). The seasonal variations in ionic composition of pond water of Lumding,
Assam, India. Curr. World Environ. 8(1):127-131.
[28]Haande, S., Rohrlack, T., Semyalo, R. P., Brettum, P., Edvardsen, B., Lyche-Solheim, A. (2011).
Phytoplankton dynamics and cyanobacterial dominance in Murchison Bay of Lake Victoria (Uganda)
in relation to environmental conditions. Limnologica - Ecology and Management of Inland Waters, 41,
20–29. doi:10.1016/j.limno.2010.04.001. 22 Page 16 of 17 Environ Monit Assess (2017) 189:22
[29]Hecky RE, Mugidde R, Ramlal PS, Talbot MR, Kling GW (2010).Multiple stressors cause
rapid ecosystem change in Lake Victoria. Freshwater Biol. 55(Suppl. 1):19-42.
[30]Hecky, R.E. and Bugenyi, F.W.B. (1992): Hydrology and chemistry of the African great lakes and
water-quality issues: problems and solutions. Mitt Int Ver Theor Angew Limnol 23:45–54
[31]Heydarnejad MS (2012). Survival and growth of common carp (Cyprinus carpio L.) exposed to
different pH levels. Turk. J. Vet. Anim. Sci. 36(3):245-249.
[32]Hughes RH, Hughes JS (1992). A directory of African Wetlands. IUCN, Gland, Switzerland and
Cambridge, UK/UNEP, Nairobi, Kenya/WCMC, xxxiv 820 p, 48 maps.
[33]IEPA (Illinois Environmental Protection Agency) (1998). Lake Notes. Common lake water quality
parameters. DWPC-Lake and Watershed Unit, P.O.Box 19276, Springfield, Illinois 62794-
9276:217/782-3362.
[34]Jiang, J.Q., Zeng, Z., and Pearce, P., (2004): Evaluation of modified clay coagulant for sewage
treatment. Chemosphere, 56, pp 181-185.
[35]John Wiley and Sons Inc., ( 1993) Aquatic Pollution. E.A. Laws., ,. 2nd ed. pp 148-149. New York
[36]Kamanyi JR, Ndawula LW, Magumba M (2006). Preliminary survey of Lakes Mutanda and Mulehe
Fisheries. Fisheries Resources Research Institute (FIRRI) P. O. Box 343, Jinja –Uganda.
[37]Katunzi EF (2001). Satellite Lakes, rivers and dams as refugia for the endangered fish species of
Lake Victoria. Paper presented at the National Scientific Conference held in Mwanza, Tanzania,
August 2001.
[38]Kennedy, K.K., Maseka, K.J. and Mbulo, M. (2018): Selected adsorbents for removal of contaminants
from wastewater: Towards engineering clay minearls. Open journal of applied sciences 8, 355-369
http://doi.org/10.4236/ojapps.2018.8807
[39]Kizito YS, Nauwerck A, Chapman LJ, Koste W (1993). A Limnological survey of some Western
Uganda Crater Lakes. Limnologica 23(4):335-347.
[40]Kristan, M., Abeku, T.A., Beard, J., Okia, M., Rapuoda, B., Sang, J. and Cox, J. 2008. Variations in
entomological indices in relation to weather patterns and malaria incidence in East African highlands:
implications for epidemic prevention and control. Malaria Journal 7 (231):14752875.
[41]Likens GE (2010). Lake Ecosystem Ecology, Academic Press, San Diego, Calif, USA.
[42]MacAdam, J., & Parsons, S. A. (2004). Calcium carbonate scale formation and control. Re/Views in
Environmental Science & Bio/Technology, 3(2), 159-169.
21. International Journal of Advances in Chemistry (IJAC) Vol. 7, No.1/2/3/4, November 2021
21
[43]Machiwa, P. K. (2003). Water quality management and sustainability: the experience of Lake Victoria
Environmental Management Project (LVEMP)––Tanzania. Physics and Chemistry of the Earth, Parts
A/B/C, 28(20), 1111–1115.
[44]Magumba MK (2000). Physical-chemical algal composition and primary production in the four Kisoro
minor Lakes. In proceedings of the workshop on: The fisheries of Kisoro Minor Lakes.
[45]Mainstone C P and Parr. W(2002). Phosphorus in rivers – ecology and management. Sci. Tot.
Environ., (282/283): 25–47.
[46]Matagi SV (2004). "A biodiversity assessment of the Flamingo Lakes of eastern Africa." Biodiveristy
5(1):13-26.
[47]Mavuti KM, Litterick MR (1991). Composition, distribution and ecological role of zooplankton
community in Lake Victoria, Kenya waters. Verh. Intern. Verin. Limnol. 25:846-849.
[48]Minuta T,and Jini D. (2017): Impact of effluents from wet coffee processing plants on the Walleme
River of Southern Ethiopia. Res J Environ Toxicol 2017, 11 : 90–96.
[49]Mukasa Tebandeke IZ, Karume I, Wasajja HZ, Nankinga R. (2020) : Improving Quality of Water from
Murchison Bay using Clay from Chelel, Kapchorwa District, Uganda. Journal of Advances in
Chemistry 17, 1-30 ISSN: 2321-807X https://www.rajpub.com/index.php/jac
[50]Osiru, D.S.O. (2006). Report on crop/farming systems and PRA. Prepared for FAO Transboundary
Agro-Ecosystem Management Programme (TAMP). Makerere University. Retrieved from http://
www.fao.org/fileadmin/templates/nr/images/resources/pdf_documents/kagera/uganda/ug_
crop_farming_systems.doc
[51]Rashid R, Pandit AK (2014). Macro-invertebrates (Oligochaetes) as indicators of pollution: A
review. J. Ecol. Nat. Environ. 6(4):140-144.
[52]Rügner, H., Schwientek, M., Beckingham, B., Kuch, B., & Grathwohl, P. (2013). Turbidity as a proxy
for total suspended solids (TSS) and particle facilitated pollutant transport in
catchments. Environmental earth sciences, 69(2), 373-380.
[53]Rutner-Kolisko A (1974). Planktonic rotifers: Biology and taxonomy, Biological Station Lunz of
the Austrian Academy of Science. E. Schweizerbart’scheVerlagsbuchhandlung.
[54]Semyalo R, Nattabi JK (2009). Diel vertical migration of zooplankton in a eutrophic bay of Lake
Victoria. Hydrobilogia 635:383-394.
[55]Singh, N., Nagpal, G., Agrawal, S. and Rachina (2018). Water purification by using various
adsorbents: A review. Environmental technology and innovation 11, 187-240.
http://doi.org/10.1616/j.eti.2018.05.006.
[56]Srinivasan, R.. (2011): Advances in application of natural clay and its composites in removal of
biological, organic, and inorganic contaminants from drinking water. Advances in Materials Science
and Engineering, 11, 1-17.
[57]Ssebiyonga, N., Erga, S. R., Hamre, B., Stamnes, J. J., & Frette, Ø. (2013). Light conditions and
photosynthetic efficiency of phytoplankton in Murchison Bay, Lake Victoria, Uganda. Limnologica-
Ecology and Management of Inland Waters, 43(3), 185–193.
[58]Swamy A.; Terer Erick Kipngetich, Magut Hillary and T. (2013) CODEN (USA): IJPLCP ISSN:
0976-7126 Int. J. of Pharm. & Life Sci. (IJPLS), 4(7), 2828-2833 2829
[59]Tamatamah, R. A., Hecky, R. E., & Duthie, H. (2005). The atmospheric deposition of phosphorus in
Lake Victoria (East Africa). Biogeochemistry, 73, 325–344. doi:10.1007 /s10533-004-0196-9. USDA
(2015). USDA. http://www.pecad.fas.usda. gov/lakes/images/lake0314.TPJO.2.txt. Accessed 12 May
2015.
[60]Tibihika PDM, Barekye A, Byakora E (2015). Fish species composition, abundance and diversity of
Minor Lakes in South Western Uganda/Kigezi Region. Int. J. Sci. Technol. 4(5).
[61]Tibihika, P.D.M.; Okello, W.; Barekye, A.; Mbabazi, D.; Omony, J. and Kiggundu, V.: (2016) Status
of Kigezi minor Lakes: A limnological survey in the Lakes of Kisoro, Kabale and Rukungiri Districts
International Journal of Water Resources and Environmental EngineeringVol. 8(5), pp. 60-73, June
2016 DOI: 10.5897/IJWREE2016.0645 Article Number: 5F4CDCD59074 ISSN 2141-6613
[62]Trivedi R.K, and Goel P.K. Chemical and biological methods for water pollution studies.
Environmental Publications, Y. K. College of Science, Karad, India. 1986. p. 250.
[63]Turner, R.K., van den Bergh, J.C.J.M., Söderqvist, T., Barendregt, A., van der Straaten, J., Maltby, E.
and van Lerland, E.C. (2000). The values of wetlands: Landscape and institutional perspectives.
Ecological Economics, 35: 7-23.
[64]U.S. Environmental Protection Agency, Eutrophication: http://www.epa.gov/maia/html/eutroph.html
22. International Journal of Advances in Chemistry (IJAC) Vol. 7, No.1/2/3/4, November 2021
22
[65]U.S. Environmental Protection Agency, National Nutrient Guidance:
http://www.epa.gov/ost/criteria/nutrient/guidance/
[66]Verma, A., Wei, X., & Kusiak, A. (2013). Predicting the total suspended solids in wastewater: a data-
mining approach. Engineering Applications of Artificial Intelligence, 26(4), 1366-1372.
[67]Water Research Center. Water Testing Total Dissolved Solids Drinking Water Quality. 2019.
https://waterresearch.net/index.php/water-treatment/tools/total-dissolved-solids. Accessed 11 June 2020
[68]Waya RK, Chande AI (2004). Species composition and biomass estimates of zooplankton in some
water bodies within Lake Victoria basin. Tanz. J. Sci. 30(1).
[69]Wetzel GR (1975). Limnology. W. B. Saunders, Filadelfia, Pensilvania.743p
[70]WHO (2008). Guidelines for drinking-water quality, 3rd edition First Addendum to the 3rd edition
Volume 1 recommendations (Vol. 1) WHO. Geneva, Recommendations.
[71]World Health Organization, WHO (2004). Guidelines for Drinking Water Quality, vol. 1, 3 rd ed.
World Health Organization, Geneva, Switzerland.
[72]World Health Organization, WHO (2008). Guidelines for Drinking Water Quality, Incorporating the
first and second Addenda. vol. 1, 3rd ed. World Health Organization, Geneva, Switzerland. 20.
Oeteman, B.C.J (1980).
[73]Worthington EB, Ricardo CK (1936). The vertical distribution
[74]Worthington EB (1932). A report on the fisheries of Uganda investigated