Weitere ähnliche Inhalte
Ähnlich wie Statistical evaluation of compression index equations (20)
Mehr von IAEME Publication (20)
Kürzlich hochgeladen (20)
Statistical evaluation of compression index equations
- 1. INTERNATIONAL JOURNAL and Technology (IJCIET), ISSN 0976 – 6308
International Journal of Civil Engineering OF CIVIL ENGINEERING AND
(Print), ISSN 0976 – 6316(Online) Volume 4, Issue 2, March - April (2013), © IAEME
TECHNOLOGY (IJCIET)
ISSN 0976 – 6308 (Print)
ISSN 0976 – 6316(Online)
Volume 4, Issue 2, March - April (2013), pp. 104-117
IJCIET
© IAEME: www.iaeme.com/ijciet.asp
Journal Impact Factor (2013): 5.3277 (Calculated by GISI) © IAEME
www.jifactor.com
STATISTICAL EVALUATION OF COMPRESSION INDEX
EQUATIONS
1 2
Ch.Sudha Rani , K.Mallikarjuna Rao
1
Associate Professor, Dept of Civil Engineering, Sri Venkateswara University College of
Engineerring, Tirupati, India-517502
2
Professor, Dept of Civil Engineering, Sri Venkateswara University College of Engineerring,
Tirupati, India-517502
ABSTRACT
Several correlations were developed in practice for predicting Compression Index in
terms of either Liquid Limit or Plasticity Index or Dry Density or initial Moisture Content. In
this investigation an attempt has been made to quantify statistically the effectiveness of
twelve such models statistically by comparing predicted and observed Compression Index
values for 180 soils test data obtained from literature. A statistical technique called Analysis
of variance (ANOVA) is used to analyse the differences between predicted and observed
Compression Index values with and without considering soil classification. One-Factor and
Two-Factor ANOVA test results indicate that the influence of soil classification and method
of prediction is significant on the deviation between observed and predicted Compression
Index values. Certain models were found to have applicability only for some soil
classification groups. The best models for prediction of Compression Index of six soil
classification groups as well as for all soil types were assessed by conducting statistical
Dunnett’s test. Two models were found to have general applicability considering all soil
classification groups.
KeyWords: Compression Index, Liquid Limit, Plasticity Index, Soil Classification, Soil
Type
104
- 2. International Journal of Civil Engineering and Technology (IJCIET), ISSN 0976 – 6308
(Print), ISSN 0976 – 6316(Online) Volume 4, Issue 2, March - April (2013), © IAEME
1. INTRODUCTION
Correlations have been a significant part of soil mechanics from its earliest days, as
the soil is known to exhibit greatest degree of variability and uncertainty. This is due to the
inherent nature and diversity of geological processes involving stress, time and environment
in soil formation. Correlations using Atterberg limits are fairly common in soil mechanics
literature from the time Casagrande found that the Atterberg limits provide a much more
reliable indication of engineering properties. Virgin Compression of soils is most commonly
expressed by Compression Index (Cc), determined from the slope of compression curve.
Several investigators proposed empirical or semi empirical correlations to predict
Compression Index using Liquid Limit (Skempton 1944, Terzaghi&Peck 1967, and Bowles
1979) or initial Void Ratio (Nishida 1956, Hough 1957, and Bowles 1979) or initial Moisture
Content (Bowles 1979, and Koppula 1981) or in-situ Dry Density (Oswald 1980). Burland
(1990), and Nagraj et.al. (1990) expressed Compression Index as a function of generalized
parameters namely Void Index (IV) and e/eL respectively. According to Jian-Han Yin (1999),
Sridharan and Nagraj (2001), and Amithnath and DeDelal (2004) Compression Index yields
good correlation with Plasticity Index. The engineering properties of soils are known to
depend on the composite effect of compositional and environmental factors (Mitchel, 1993).
Liquid Limit, Plasticity Index are known to reflect compositional factors while in-situ
Dry Density and natural Moisture Content are the important environmental factors that
influence the engineering properties significantly. Review of literature reveals that generally
Cc is correlated with any one of the parameters reflecting either composition or environment
of soil excepting the one suggested by Mallikarjuna Rao et.al.(2006). Mallikarjuna Rao
et.al., 2006/ Sudha Rani, 2007 developed a regression model for predicting Compression
Index in terms of four parameters namely, Liquid Limit (WL), Plasticity Index (IP), Dry
Density (γd) and initial Moisture Content (mc) which reflect both composition and
environment of soil. The objective of the present investigation is to quantify statistically the
effectiveness of most popular methods for prediction of Cc by comparing the predicted and
observed Cc values for soils other than those from which the correlations were developed.
2. COMPRESSION INDEX EQUATIONS STUDIED
From literature it is clear that there are several correlations available for prediction of
Compression Index using one of the parameters namely, Liquid Limit (WL), Plasticity Index
(IP), Dry Density (γd), initial Moisture Content (mc), initial Void Ratio (eo) and Porosity (η),
which reflect either composition or environment. Some of the most commonly used
correlations along with the regions/conditions of applicability are reported by Nagraj &
Srinivasa Murthy (1986). The same are shown in Table 1 along with the one suggested by
Mallikarjuna Rao et.al.(2006) / Sudha Rani(2007). These methods are designated as M1, M2,
M3, M4, M5, M6, M7, M8, M9, M10, M11 and M12 for convenience. Regression models
M2, M6 and M7 correlate Compression Index with the Liquid Limit which is dependent on
composition of the soil. Models M3, M4, M5, M9 and M10 used environmental factor
namely in-situ Void Ratio to predict Compression Index. Model M1 and M8 adopted natural
Moisture Content, while model M11 used in-situ Dry Density for development of regression
models. Both natural Moisture Content and in-situ Dry Density are environmental factors.
Model M12 accounted for all the environmental factors and compositional factors in the
development of the model.
105
- 3. International Journal of Civil Engineering and Technology (IJCIET), ISSN 0976 – 6308
(Print), ISSN 0976 – 6316(Online) Volume 4, Issue 2, March - April (2013), © IAEME
Table 1 Commonly Used Correlations for Prediction of Compression Index
Model Regions / Conditions
S.No. Equation Reference
Desig of Applicability
nation from Reference
1 M1 Cc = 0.0115 wn Bowles (1979) Organic Silt & Clays
2 M2 Cc = 0.0046(wL -9) Bowles (1979) Brazilian Clays
3 M3 Cc = 0.156 eo+0.0107 Bowles (1979) All Clays
4 M4 Cc= 0.208(eo-0.0083) Bowles (1979) Chicago Clays
5 M5 Cc = 0.75(eo-0.5) Bowles (1979) Soils with Low Plasticity
6 M6 Cc = 0.007(wL -7) Skempton (1944) Remoulded Clays
Terzaghi & Peck Normally Consolidated,
7 M7 Cc = 0.009(wL -10)
(1967) Moderately Sensitive Clays
8 M8 Cc = 0.01 wn Koppula (1981) Chicago & Alberta Clays
9 M9 Cc = 0.30(eo-0.27) Hough (1957) Inorganic Silty Sandy-Silty Clay
10 M10 Cc = 1.15(eo-0.35) Nishida (1956) All Clays
Soil Systems of all Complexities
11 M11 Cc = 0.5(γw/γ2d)1.2 Oswald (1980)
and Types
Cc = (-0.629+(0.0027* Mallikarjuna
12 M12 WL)+(0.007*mc)+(0.031*γd) + et.al.,(2006)/ All Uncemented Soils
(0.002*IP)) Sudha Rani(2007)
3. DATABASE USED
In order to assess the general applicability of the above mentioned twelve methods,
one hundred and seventy eight soils test data was collected from different sources reported in
the literature. Oswald (1980) reported about 100 soils consolidation test data, obtained from
United States Army Corps of Engineers (USACE) records covering the offices throughout the
Continental United States.Amongst them about eighty soils test data were used for evaluation
in this investigation. Other twenty soils data could not be used, as either liquid limit or in-
situ void ratio was not reported. Sridharan (1990) reported the e-log p plots of twelve
undisturbed samples. Compression Index values were obtained from the e-log p plots and the
same were used for evaluation here. Stalin (1995) conducted a series of consolidation tests
on about seventy remoulded samples obtained by mixing Bentonite with Kaolinite, fine sand,
coarse sand and silt in different proportions. All these tests were conducted on samples with
water content brought out to their respective liquid limit consistency. The same are used here
for evaluation purposes. One dimensional Consolidation tests were conducted on undisturbed
samples by Bayan (2005) for determining compression index on forty two soil samples from
Indian Oil Corporation Limited site in Assam, India and the same are used here for evaluation
of methods. Table 2 summarizes test data collected from literature giving the details of
relevant index properties, soil classification group and Cc values.
106
- 4. International Journal of Civil Engineering and Technology (IJCIET), ISSN 0976 – 6308
(Print), ISSN 0976 – 6316(Online) Volume 4, Issue 2, March - April (2013), © IAEME
Table 2 Typical Soil Data Base Used for Verification of Compression Index Models
WP WL mc γd IP
S.No. SOIL LOCATION I.S Classification (Cc)a Reference
% % % kN/m3 %
1 Thomasville@18ft CH 31.00 87.00 32.70 13.86 56.00 0.13 Oswald
2 Ft.Gordon@d=5ft CH 26.00 51.00 26.80 14.80 25.00 0.31 ”
3 Ft.Stewart@d=19ft CH 23.00 92.00 45.60 11.93 69.00 0.39 ”
4 RobbinsAFB@d=11ft CH 28.00 55.00 30.30 14.32 27.00 0.14 ”
5 Robbins AFB@d=12ft CH 30.00 65.00 28.70 14.27 35.00 0.09 ”
6 Thomasville@d=15ft CH 27.00 60.00 41.70 12.54 33.00 0.34 ”
7 IT1 CH 15.00 53.00 26.10 15.40 38.00 0.17 Sridharan
8 IT2 CH 31.00 50.50 29.00 14.60 19.50 0.12 ”
9 LockandDam@13ft CH 28.00 81.00 44.00 12.34 53.00 0.37 Oswald
10 RedRiver@10ft CH 24.00 55.00 37.30 13.33 31.00 0.21 ”
4. STATISTICAL EVALUATION OF COMPRESSION INDEX EQUATIONS
The Compression Index of all the 178 soils test data is predicted using the twelve
methods namely M1, M2, M3, M4, M5, M6, M7, M8, M9, M10, M11and M12 presented in
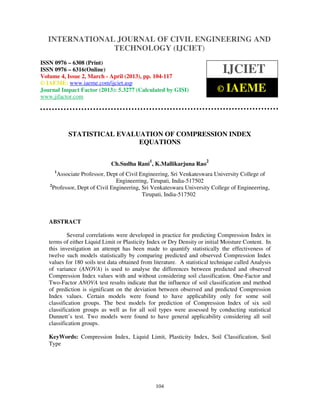
Table 1. The observed Cc values are plotted against Cc values predicted by the twelve
regression models and the typical plots are shown in Figs 1 to 6. The solid line in the plots is
the line of equality. Careful observation of these plots indicate that the predictability of 6
models namely M1, M6, M7, M8, M9 and M12 appear to be fair to good since most of the
points are falling close to the line of equality. All other models are found to either under
predicting or over predicting, even though the predictions are good for some of the low
compressible soils.
Though the prediction by 6 models namely M1, M6, M7, M8, M9 and M12 appear to
be fair to good based on graphical plots of observed and predicted Cc values, there is a need
further to quantify the effectiveness of each of these twelve methods in order to identify the
best one. In the context of statistical analysis, if we wish to compare two methods say,
Method A with Method B about its superiority, it is customary to proceed on the assumption
that both the methods are equally good (it is known as Null Hypothesis) and the hypothesis is
tested through z-test or t-test at 5% or 1% level of significance (α), which implies that the
null hypothesis will be rejected when sampling result has probability of occurrence less than
or equal to the level of significance considered (0.01 for 1% or 0.05 for 5%) and vice-versa.
If null hypothesis is true, such groups are identified as samples from same population. If we
happen to examine the significance of the difference between more than two
methods/samples, it necessitates considering all possible combinations of the two
methods/groups of data at a time and that would require a great number of tests before we
would be able to arrive at a decision. In all these situations, ANOVA technique developed by
Snedcor and others (Snedcor and Cochran 1973) which permits comparison of all groups of
data/methods simultaneously is used widely in practice. Analysis of Variance popularly
known as ANOVA in short is a statistical technique for testing differences between two or
more methods/samples/groups of data.
107
- 5. International Journal of Civil Engineering and Technology (IJCIET), ISSN 0976 – 6308
(Print), ISSN 0976 – 6316(Online) Volume 4, Issue 2, March - April (2013), © IAEME
The basic principle of ANOVA is to test for differences among the means of the
methods/groups by examining the amount of variation within each of the groups, relative to
the amount of variation between groups/methods. In ANOVA technique, investigation of any
number of factors that influence the variable known as dependent variable is possible. There
are two types of ANOVA tests, based on the number of independent variables considered
namely (i) One-Way ANOVA or One-Factor ANOVA and (ii) Two-Way ANOVA or Two-
Factor ANOVA . The analysis for the research situations where single independent variable is
considered is called One-Way Analysis of Variance and if two factors are investigated at a
time, then it is called Two-Way Analysis of Variance.
In this investigation, in order to quantify the effectiveness of each of these 12 methods in
predicting Cc, One-Way ANOVA is carried out on predicted Cc values using these 12 methods
for 178 soils test data that is presented in Table 2. Except Oswald’s method i.e. method M11,
none of the methods have used any of these 178 soils test data in the development of the 12
models under consideration. About 80 soils test data was actually used in the development of
model M11 i.e. Oswald’s method. The analysis is for finding the best method that predicts
values closer to actual value (from experimental study) among the twelve methods namely
M1, M2, M3, M4, M5, M6, M7, M8, M9, M10, M11and M12 for general applicability.
Hence, in One-Way ANOVA, the factor under consideration here is method for prediction of
Compression Index of soils.
6.00
Predicted Cc
5.00
4.00
3.00
2.00
1.00
0.00
0.00 1.00 2.00 3.00 4.00 5.00 6.00
Observed Cc
Fig 1 Predicted Vs Observed Cc (Model, M1)
6.00
Predicted Cc
5.00
4.00
3.00
2.00
1.00
0.00
0.00 1.00 2.00 3.00 4.00 5.00 6.00
Observed Cc
Fig 2 Predicted Vs Observed Cc (Model, M2)
108
- 6. International Journal of Civil Engineering and Technology (IJCIET), ISSN 0976 – 6308
(Print), ISSN 0976 – 6316(Online) Volume 4, Issue 2, March - April (2013), © IAEME
6.00
Predicted Cc 5.00
4.00
3.00
2.00
1.00
0.00
0.00 1.00 2.00 3.00 4.00 5.00 6.00
ObservedCc
Fig 3 Predicted Vs Observed Cc (Model, M5)
6.00
Predicted Cc
5.00
4.00
3.00
2.00
1.00
0.00
0.00 1.00 2.00 3.00 4.00 5.00 6.00
Observed Cc
Fig 4 Predicted Vs Observed Cc (Model, M6)
6.00
Predicted Cc
5.00
4.00
3.00
2.00
1.00
0.00
0.00 1.00 2.00 3.00 4.00 5.00 6.00
Observed Cc
Fig 5 Predicted Vs Observed Cc (Model, M7)
109
- 7. International Journal of Civil Engineering and Technology (IJCIET), ISSN 0976 – 6308
(Print), ISSN 0976 – 6316(Online) Volume 4, Issue 2, March - April (2013), © IAEME
6.00
Predicted Cc 5.00
4.00
3.00
2.00
1.00
0.00
0.00 1.00 2.00 3.00 4.00 5.00 6.00
Observed Cc
Fig 6 Predicted Vs Observed Cc (Model, M12)
4.1 ONE-WAY ANOVA TEST
The One-Way ANOVA is a statistical testing procedure for comparing the means
of more than two groups of data. Here, we have thirteen groups of data, the first group
data are the observed Cc values and the data in the twelve groups are predicted values of
Compression Index by the twelve methods M1 to M12.
The method begins with the assumption that there is no difference between group
means i.e. Ĉc1= Ĉc2 = Ĉc3= Ĉc4 = Ĉc5= Ĉc6 = Ĉc7= Ĉc8 = Ĉc9= Ĉc10 = Ĉc11= Ĉc12 = Ĉc13
which is normally known as null hypothesis against the alternative hypothesis that the
group means are not equal. The variance ratio (‘F-value’/ ‘Fstatic’ / ’F’) is the ratio of
Mean Square (MS) between groups and the Mean Square within the groups. F-test is
based on F-distribution and is used to compare the variance of the two-independent
samples. This test is also used in the context of analysis of variance (ANOVA) for judging
the significance of more than two group/sample means at 5% or 1% level. In this test, F-
value (F) evaluated is compared with critical value of variance (‘Fcrit’/ ‘F-limit’), which is
the limiting value for given degrees of freedom and this can be obtained by making use of
the F-distribution given by Fisher. The method was introduced by Fisher (Snedcor &
Cochran 1973). MS-EXCEL and SPSS softwares have a routine to perform this analysis.
Table 3 presents the summary of the results obtained by carrying out the One-Way
ANOVA test. From the ANOVA table, the F-value is found to be 22.41, whereas the
critical F-value at 5% level of significance is 1.76. The P-Value in the table which is
equal to 0.00 indicates the probability of acceptance of null hypothesis. Since the F value
is greater than Fcrit, it can be concluded that the means of the groups do differ
significantly. Having concluded that the group means differ significantly, it is now
necessary to determine which method is best among all and to rank all the methods based
on their reliability to predict Cc values. Dunnett’s test, which is a multiple comparison
test, can be used for this purpose. The details of the Dunnett’s test may be found in
Montgomery (2005) or any other standard textbook on statistical methods.
110
- 8. International Journal of Civil Engineering and Technology (IJCIET), ISSN 0976 – 6308
(Print), ISSN 0976 – 6316(Online) Volume 4, Issue 2, March - April (2013), © IAEME
Dunnett’s Formula for Critical Difference (CD) is given below
CD= dα ((a-1), df) √MSE (1/n1 + 1/n2) … (1)
Where CD = Critical Difference
α = Significance level at 5% = 0.05
(a-1) = No. of Treatment Means = 12
df = Degrees of Freedom (can be obtained from the ANOVA table)
dα = F- distribution value at (a-1) denominator and df numerator =2.69
n1, n2 = No. of samples in actual group and comparing groups =178
MSE = Mean Square Error within the groups (can be obtained from the ANOVA table)
Table 3 One-Way ANOVA Summary Sheet
Groups n Sum Average Varianc
e
Mactual 178 97.99 0.551 0.52
M1 178 129.72 0.73 0.54
M2 178 54.60 0.31 0.08
M3 178 48.90 0.27 0.07
M4 178 62.35 0.35 0.13
M5 178 159.18 0.89 1.74
M6 178 85.57 0.48 0.18
M7 178 105.22 0.59 0.29
M8 178 112.79 0.63 0.41
M9 178 75.95 0.43 0.28
M10 178 274.77 1.54 4.08
M11 178 159.91 0.89 2.78
M12 178 103.27 0.58 0.67
ANOVA
Source of Variation SS df MS F P-value F crit
Between Groups 243.68 12 20.31 22.41 0.00 1.76
Within Groups 2085.48 2301 0.91
Total 2329.16 2313
n - No. of soils considered, SS – Sum of Squares, df – Degrees of freedom, MS – Mean
Square Error F-Value – Probability Value Fcrit - Critical Variance Ratio F - Variance Ratio
The critical difference (CD) is calculated using equation (1) and the value is 0.271.
SPSS software provides a subroutine for Dunnett’s test and the summary of the results are
presented in Table 4. Ranking is assigned to the methods of prediction based on the absolute
difference between the mean of each method and the mean of the actual method. If the
absolute difference does not exceed critical difference, that difference is considered to be
insignificant, indicating that the observed data and the predicted data by the specific
prediction method are close to each other and this method can be used for prediction with
confidence. From Dunnett’s test results given in Table 4, the absolute difference of the
prediction methods M3, M5, M11 and M10 are 0.28, 0.34, 0.35 and 1.54, respectively, which
are slightly greater than or greater than the critical difference from Dunnett’s formula (0.271).
Hence, these methods may be considered inferior to the other eight methods.
111
- 9. International Journal of Civil Engineering and Technology (IJCIET), ISSN 0976 – 6308
(Print), ISSN 0976 – 6316(Online) Volume 4, Issue 2, March - April (2013), © IAEME
The absolute difference of the other eight methods namely M1, M2, M4, M6, M7,
M8, M9 and M12 are 0.18, 0.24, 0.20, 0.07, 0.04, 0.08, 0.12 and 0.03, respectively. These
values are less than the critical difference. Hence, any one of these eight methods can be
adopted to predict Cc values with higher confidence. However, the absolute difference of
means is also lowest for method M12 being 0.03. Hence it may be concluded that the model
M12, which relates Cc with wL, mc, γd, and IP has more general applicability for predicting Cc
than any other model. Model M7 which relates Cc with wL may also be considered equally
good as the absolute difference is only 0.04 which is very low and very nearer to 0.03.
Table 4 Dunnett’s Test Summary (for ALL Soils)
Groups Average Abs Diff Rank
Mactual 0.55 0 -
M12 0.58 0.03 1
M7 0.59 0.04 2
M6 0.48 0.07 3
M8 0.63 0.08 4
M9 0.43 0.12 5
M1 0.73 0.18 6
M4 0.35 0.20 7
M2 0.31 0.24 8
M3 0.27 0.28 9(NA)
M5 0.89 0.34 10(NA)
M11 0.90 0.35 11(NA)
M10 1.54 0.99 12(NA)
4.2 TWO-WAY ANOVA TEST
Soils are generally not homogenous in nature. Studying engineering behaviour and
engineering use of each and every soil in isolation is neither possible nor encouraged. That is
why soils are generally classified adopting any of the engineering classification systems like
Unified Soil Classification System (Casagrande, 1948), Indian Standard Classification
System (IS: 1498, 1970) and American Society of Testing Materials Classification System
(ASTM: D 2487-83, 1983). In these classification systems any given soil is classified using
dual symbol system based on grain size distribution and plasticity characteristics. All the soils
falling under one classification group are expected to exhibit similar engineering behaviour.
Hence, it may be expected that the empirical compression index equations may have a
bearing on soil classification too. This aspect has not been considered by any of the
investigators. However, Wesley (2003) suggested that correlations involving Liquid Limit or
Plasticity Index on their own are unlikely to be applicable to soils on a general basis. It is the
position of soil occupying on the plasticity chart (involving both IP and wL), that is more
likely to lead to general correlations. An attempt was made here to find out whether there was
any relationship between classification of soil (type of soil) and the applicability of the
empirical compression index equations. This objective can be achieved by the statistical
technique called Two-Way Analysis of variance test in which two factors are considered
simultaneously to test equivalence of different methods of prediction of Cc. Two-Way
ANOVA is performed in this investigation considering type of soil/soil classification as one
factor and the method for prediction of compression index as another factor. SPSS software
package extends facility for Two-Factor ANOVA testing also. The test is performed for
different types of soils (soil classification groups) using different methods of prediction
112
- 10. International Journal of Civil Engineering and Technology (IJCIET), ISSN 0976 – 6308
(Print), ISSN 0976 – 6316(Online) Volume 4, Issue 2, March - April (2013), © IAEME
(methods M1 to M12) by including the observed (actual) values of compression index. The
difference between the actual compression index and the predicted value from the equation is
taken as the measure of adequacy. The mean of the predicted values by various methods for
different types of soils was obtained. The difference of the means from mean of the observed
values (control) for particular type of soil should be close to zero if the prediction equation is
truly suitable. Deviation from observed compression index could also occur due to type of
soil accounted. Statistical treatment of the errors can be carried out with the help of two
factor ANOVA with factors as soil type (i.e. soil classification group) and the method used for
prediction. The 178 soils test data collected from literature and reported in Table 2 is used
for carrying out two factor ANOVA test. All the 178 soils are classified based on Indian
Standard Soil Classification System (IS 1498, 1970). The classification group so obtained is
one of the two factors i.e. soil type in Two-Factor ANOVA. Indian Standard Soil
Classification is no different from Unified Soil Classification System excepting that the fine
grained soils having wL in the range of 35% - 50% are classified as Intermediate compressible
soils (i.e. CI and MI). Method of prediction (i.e. M1, M2, M3, M4, M5, M6, M7, M8, M9,
M10, M11 and M12) is another factor considered in two factor ANOVA test. The details of
the test can be found in Montgomery (2003) or in any standard textbook on Statistics. In the
analysis, the Soil type is designated as SOIL_COD, the method code (i.e. M1, M2, M3, M4,
M5, M6, M7, M8, M9, M10, M11 and M12) is designated as METHOD_C and the joint
effect of soil type and the method code is denoted as SOIL_COD * METHOD_C. The
ANOVA table with means and standard deviation of error (deviation) is shown in Table 5. The
null hypotheses are:
Hypothesis 1: The average error (deviation) between observed and predicted Cc value using
empirical equation/model remains same in all soils (labeled as SOIL_COD in Table 5).
Hypothesis 2: The average deviation with respect to each empirical equation/model remains
the same (labeled as METHOD_C in Table 5).
Hypothesis 3: There is no joint effect of soil and the equation on the deviation (labeled
SOIL_COD * METHOD_C in Table 5).
The ANOVA table gives the components into which the total variation is divided. From Table
5 the Fstatic for the three factors SOIL_COD, METHOD_C and SOIL_COD*METHOD_C
(read as SOIL_COD by METHOD_C) are 79.130, 8.101and 2.807, respectively. The
probability of acceptance of the three null hypotheses mentioned above is 0.000 for
Hypothesis 1 i.e. SOIL_COD, 0.000 for Hypothesis 2 i.e. METHOD_C and 0.000 for
Hypothesis 3 i.e. SOIL_COD*METHOD_C. The probability being very much less than 0.05
(i.e. 5% level of significance), all the three hypotheses are rejected. Rejection of all the three
hypotheses indicates that the average deviation between observed and predicted Cc values is
significantly different for different soil types and for different methods of prediction. Further
the joint effect of soil type and method of prediction is significant which implies that certain
methods are more suitable for certain soil types. Hence, it may be concluded that there is
significant main effect for the SOIL_COD (soil type) factor, METHOD_C (method) factor
and the interaction factor SOIL_COD *METHOD_C (joint effect). Having concluded that
the effect of soil type and method for prediction of compression index are significant, it is
necessary to determine the best method and the methods applicable to predict Cc values for
each type of soil. Eleven types of soils namely CH, CI, CL, MH, MI, ML, CL-ML, OH, SC,
SC-CH and SP-SC are found among the 178 soils test data listed in Table 2. Out of these
CH, CI, CL, MI, OH and SC groups have more than 10 sets of soils test data. For these seven
soil types, an attempt has been made here to identify the best method and methods applicable
for prediction of Cc amongst the twelve methods presented in Table 1 by analyzing
statistically the observed and predicted Cc values.
113
- 11. International Journal of Civil Engineering and Technology (IJCIET), ISSN 0976 – 6308
(Print), ISSN 0976 – 6316(Online) Volume 4, Issue 2, March - April (2013), © IAEME
Table 5 Two-Way ANOVA Summary Sheet
Sum of
Source df Mean Square F Sig.
Squares
Corrected Model 940.626 142 6.624 10.802 0.000
Intercept 215.938 1 215.938 352.118 0.000
SOIL_COD 485.268 10 48.527 79.130 0.000
METHOD_C 59.619 12 4.968 8.101 0.000
SOIL_COD * METHOD_C 206.562 120 1.721 2.807 0.000
Error 1331.376 2171 0.613
Total 3181.043 2314
Corrected Total 2272.002 2313
This objective can be met by carrying out statistical Dunnett’s test for each soil type
separately while comparing the observed and predicted Cc values. Dunnett’s test is carried
for each type of soil separately to find the critical difference using equation 1. The absolute
difference is the difference between the mean of the actual and the mean of a method. If the
absolute difference is less than the critical difference then that particular method is acceptable
for prediction of Cc for the particular soil type and vice versa. The methods suitable for each
class of soil are concluded, excluding the methods, which have the absolute difference greater
than the critical difference. Ranking is given to the suitable methods by sorting the absolute
difference values of these methods, so that the method ranked as one predicts a closer value
of compression index to actual measured value. More details concerning Dunnett’s test can
be found in Montgomery (2003) or any standard textbook on Statistics. The SPSS software
provides a subroutine and the same is used in this investigation.
Dunnett’s test results for CH soil type are presented in Table 6. The critical difference
according to Dunnett’s formulae is 0.58 for this group of soils. The absolute differences of
means for all the 12 methods are also shown in Table 6 arranged in ascending order. The
absolute difference is less than 0.58 for 9 methods namely M12, M7, M8, M6, M9, M1, M4,
M2 and M3. Further the absolute difference is increasing from 0.09 to 0.53 in that order for all
these nine methods. Hence it may be concluded that any of these nine methods could be used to
predict Cc values with reasonable accuracy. However, the absolute difference being lowest for
M12 it may be considered best among all these nine methods. The other three methods namely
M5, M11 and M10 are not applicable for use with CH soils since the absolute difference is
more than 0.58. ‘NA’ under the rank column indicates that the absolute difference for that
method is more than the critical difference and the method is not applicable for prediction of
Cc.
Table 7 summarizes Dunnett’s test results of all the seven soil types along with ALL
soils giving the methods applicable and methods not applicable for each soil type separately.
The methods are presented in the order of their ranking. From this table it may be observed that
the methods M4, M6, M7, M8 and M12 are applicable for almost all soil types whereas either
M12 or M7 are found to be the best method for any given soil type. Hence, methods M12 and
M7 can be adopted to predict Cc values with more confidence, while methods M4, M6 and M8
can be also used with reasonable degree of confidence. The Dunnett’s test for all soils is
presented in Table 3 after carrying one-Factor ANOVA test. Here also M12 and M7 were found
to be most suitable methods among all the twelve methods in that order, reinforcing the above-
derived conclusion from Two-Factor ANOVA test. Prediction model M12 fails to predict Cc
values for low compressible clays (i.e., soils falling above A-Line in Plasticity chart with
wL<35%) and organic soils of high compressibility. On the other hand the performance of
method M7 is not upto the mark for Intermediate compressible fine grained soils (i.e. fine
grained soils having wL between 35% and 50%).
114
- 12. International Journal of Civil Engineering and Technology (IJCIET), ISSN 0976 – 6308
(Print), ISSN 0976 – 6316(Online) Volume 4, Issue 2, March - April (2013), © IAEME
Table 6 Dunnett’s Test Summary for CH Soils
CH Soils
Groups Count Average Abs Diff RANK
Mactual 57 0.994 0.000 -
M12 57 0.985 0.009 1
M7 57 1.011 0.017 2
M8 57 1.060 0.066 3
M6 57 0.808 0.186 4
M9 57 0.790 0.204 5
M1 57 1.219 0.225 6
M4 57 0.602 0.392 7
M2 57 0.521 0.473 8
M3 57 0.464 0.530 9
M5 57 1.803 0.809 NA
M11 57 1.976 0.982 NA
M10 57 2.937 1.943 NA
Critical Difference = CD=dα(a-1,f) √MSE ((1/n1) + (1/n2))
CD=2.69* √1.787* ((1/57) + (1/57))
(CD)CH = 0.58
NA – Not Applicable
Table 7 Summary of Models for Prediction of Compression Index from Two-Factor
ANOVA test
No. of Soils in
Soil Type Methods Applicable Methods Not Applicable
the Group
CH M12 , M7 , M8, M6, M9, M1, M4, M2, M3 M5, M10 , M11 57
M1, M3, M6, M7, M8, M9,
CI M12 , M11, M2, M4, M5 39
M10
M1, M2, M3, M4, M5,
CL M7 , M8, M11, M6 17
M9, M10 , M12
MI M12 , M11, M5, M2, M4, M6, M9 M1, M3, M7, M8, M10 20
M2, M3, M4, M5, M9, M10 ,
OH M7 , M8, M1, M6 11
M11, M!2
SC M7 , M9, M11, M6, M12, M4, M8 M1, M2, M5, M10 14
ALL Soils* M12 , M7 , M6, M8, M9, M1, M4 M2, M3, M5, M10, M11 178
* From One-Factor ANOVA test
115
- 13. International Journal of Civil Engineering and Technology (IJCIET), ISSN 0976 – 6308
(Print), ISSN 0976 – 6316(Online) Volume 4, Issue 2, March - April (2013), © IAEME
5. CONCLUSIONS
The performance of twelve different models for prediction of Compression Index is
statistically evaluated using One-Factor ANOVA and Two-Factor ANOVA by comparing the
predicted and observed values of Cc values for 178 soils test data collected from literature.
The statistical analysis reveals that both soil classification (i.e. the position of soil in
engineering classification chart) and the method of prediction have bearing on the
performance of models. Most suitable models for each soil type for prediction of Cc are
obtained by statistical technique called Dunnett’s test. Two models, one suggested by
Mallikarjuna Rao et.al. (2006) and the other suggested by Terzaghi & Peck (1967) were
found to have more general applicability considering all soil types.
REFERENCES
Journal Papers
1. Amithnath and DeDalal SS (2004) The Role of Plasticity Index in Predicting
Compression Index behaviour of clays. Electronic Journal of Geotechnical Engineering
http://www.ejge.com/2004/Per0466/Ppr0466.htm.
2. Burland JB (1990) On the Compressibility and Shear Strength of Natural Clays.
Geotechnique 40(2): 327-378.
3. Jian- Hua Yin (1999) Properties and Behaviour of Hong Kong Marine Deposits with
different Clay Contents. Canadian Geotechnical Journal 36: 1085-1095.
4. Koppula SD (1981) Statistical Estimation of Compression Index. ASTM Geotechnical
Testing Journal 4(2): 68-73.
5. Nagraj TS Srinivasa Murthy BR and Vatsala A (1990) Prediction of Soil Behaviour Part
I – Development of Generalised Approach. Indian Geotechnical Journal 20: 4.
6. Nagraj TS and Srinivasa Murthy BR (1986) A Critical reappraisal of Compression Index
equations. Geotechnique Vol 36(1): 27-32.
7. Nishida Y (1956) A Brief Note on the Compression Index of Soil. Journal of Soil
Mechanics and. Foundation Division, American Society of Civil Engineers 82(3): 1-14.
8. Oswald RH (1980) Universal Compression Index Equation. Journal of.Geotechnical
Engineering Division, American Society of Civil Engineers 106: 1179-1200.
9. Skempton AW (1944) Notes on the Compressibility of Clays. Quaterly Journal of
Geotechnical Society. London 100:119-135.
10. Sridharan A and Nagraj HB (2001) Compressibility behaviour of remoulded, fine-
grained soils and correlation with index properties. Candian Geotechnical Journal
38:1139-1154.
11. Wesley LD (2003) Residual Strength of Clays and correlations using Atterberg Limits.
Geotechnique 543(7): 669-672.
12. Ch. Sudha Rani and K Mallikarjuna Rao, “Compositional and Environmental Factors
Role on Compression Index” International Journal of Civil Engineering & Technology
(IJCIET), Volume 3, Issue 2, 2012, pp. 392 - 403, ISSN Print: 0976 – 6308,
ISSN Online: 0976 – 6316
Books
13. ASTM: D 2487-83 (1983) standard test method for classification of soils for engineering
purposes, American Society for Testing and Materials, Philadelphia, USA
116
- 14. International Journal of Civil Engineering and Technology (IJCIET), ISSN 0976 – 6308
(Print), ISSN 0976 – 6316(Online) Volume 4, Issue 2, March - April (2013), © IAEME
14. Bowles JW (1979) Physical and Geotechnical Properties of Soils, McGraw Hill, New
York.
15. Hough BK (1957) Basic Soil Engineering, Ronald, New York.
16. IS: 1498 (1970) (Reaffirmed 2002) Classification and Identification of Soils for General
Engineering Purposes, Bureau of Indian Standards, New Delhi.
17. Mitchell JK (1993) Fundamentals of Soil Behavior, John Wiley and Sons, New York.
18. Montgomery CD (2005) Design and Analysis of Experiments, John Wiley & Sons, New
York.
19. Snedcor GW, Cochran WG (1973) Statistical Methods, Mc Graw Hill New York.
20. Terzaghi K and Peck RB (1967) Soil Mechanics in Engineering Practice, Wiley New
York
Theses
21. Sreelatha N (2001) Analysis Compressibility and Shear Behaviour of Tropical Residual
Soils with Induced Cementation. M.Tech Thesis of Sri Venkateswara University College
of Engg, Tirupati, India.
22. Stalin VK (1995) Factors and Mechanisms Controlling the Index Properties and
Engineering Behaviour of Soil Mixtures. Ph.D Thesis of Indian Institute of Science,
Bangalore, India.
23. Sudha Rani Ch (2007) A Knowledge Based System for Soil Identification and
Assessment of Volume Change Characteristics of Clayey Soils. Ph.D Thesis of Sri
Venkateswara University, Tirupati, India.
Proceedings Papers
24. Bayan GK (2005) Prediction of Historical Loading Condition of Alluvium Soil: Problem
and Possible New Solution – A Case Study. Proceedings of National Symposium on
Prediction Methods in Geotechnical Engineering GEOPREDICT2005, Indian Institute of
Technology, Chennai, 113-120.
25. Casagrande A (1948) Classification and Identification of Soils. Transactions of
American Society of Civil Engineers 113.
26. Mallikarjuna Rao K, Subba Reddy PV and Sudha Rani Ch (2006) Proper Parameters for
Prediction of Compression Index. Proceedings National Conference on Corrective
Engineering Practices in Troublesome Soils CONCEPTS 2006, JNTU College of
Engineering, Kakinada, 35-40.
27. Sridharan A (1990) Engineering Behavior of Soils – A Fundamental Approach IGS
Lecture. 13th Indian Geotechnical Conference 36(1): 27-32.
117