2. International Journal of Management (IJM), ISSN 0976 – 6502(Print), ISSN 0976 -
6510(Online), Volume 4, Issue 3, May- June (2013)
97
a durable consumer or producer good, or to lend the original saved good to another in
exchange for either interest or a share of the profits. In the first case, the individual creates
durable consumer goods, hoping the services from the good will make his life better. In the
second, the individual becomes an entrepreneur using the resource to produce goods and
services for others in the hope of a profitable sale. The third case describes a lender, and the
fourth describes an investor in a share of the business. In each case, the consumer obtains a
durable asset or investment, and accounts for that asset by recording an equivalent liability.
As time passes, and both prices and interest rates change, the value of the asset and liability
also change. An asset is usually purchased, or equivalently a deposit is made in a bank, in
hopes of getting a future return or interest from it. The word originates in the Latin "vestis",
meaning garment, and refers to the act of putting things (money or other claims to resources)
into others' pockets. The basic meaning of the term being an asset held to have some
recurring or capital gains. It is an asset that is expected to give returns without any work on
the asset per share.
II.REVIWE OF LITERATURE
McInish showed that propensity to seek novelty and avoid ill-defined and risky
situations differed between investors who currently either owned or did not own each of a
wide variety of types of assets. These results gave additional support to the findings of
McInish (1982), Shefrin and Statman (1984) and Harlow and Brown (1990) that
psychological approaches would be useful in explaining investor behavior.
Lease, et al., examined the disappearance of the individual investor from direct participation
in the equity securities market place. Certainly, until there was a decent body of evidence on
the small investors’ personal situation, his self perceptions, the portfolio returns he had
experienced, and the nature of his investment strategy deliberations, neither the financial
community nor the regulatory authorities would be a position to contemplate actions with
which to counteract his withdrawal or otherwise would be able to beneficially influence his
behavior
Baker and Haslem interpreted informational needs of the investors. The results
suggested that individual used many different factors for analysis but exceptional factors
dominated. The user information differed, and attached minor importance to financial
statement and depended on stock brokers and advisory services for their investment
information. Findings supported action which permits companies to include voluntary sales
and earnings forecasts in their report filed with SEC.
Winsen stated that the association between publicly available information and stock-
market activity was almost exclusively concerned with the behavior of stock prices. This
emphasis on stock-price behavior obscured the effect of publicly available information on the
investor. Such research that has been concerned with investor behavior had made no attempt
to evaluate the efficiency of such behavior or the association between any inefficiency in
such behavior and publicly available information.
Pettengill, et al., examined the stock selections of two groups of investors,
professional analysts and individual investors. They found that both groups exhibited a strong
preference to select momentum securities, but individual investors concentrated on securities
with extreme momentum. The professional analysts were successful with the momentum
strategy but the individual investors were not. They concluded that momentum investing was
not a viable strategy for individual investors.
3. International Journal of Management (IJM), ISSN 0976 – 6502(Print), ISSN 0976 -
6510(Online), Volume 4, Issue 3, May- June (2013)
98
Waweru, et al., investigated the role of behavioural finance and investor psychology
in investment decision-making at the Nairobi Stock Exchange with special reference to
institutional investors. Using a sample of 23 institutional investors, the study established that
behavioural factors such as representativeness, overconfidence, anchoring, gamblers’ fallacy,
availability bias, loss aversion, regret aversion and mental accounting affected the decisions
of the institutional investors operating at the NSE. Moreover, these investors made reference
to the trading activity of the other institutional investors and often exhibited an institutional-
herding behaviour in their investment decision-making.
III. STATEMENT OF THE PROBLEM
Any investment is the postponement present consumption and the same will be consumed
in later period expecting more return or make available of more value for the future consumption.
But there are so many avenues for the investors among which the recently popular and the widely
accepted option of investment are corporate shares. In this, the investors indirectly participating in
the profit of the organization. The investors investing in stocks not only for the share in profit but
also capital appreciation. But in a stock investment there are two types of factors affecting the share
price movements. One is fundamentals of the economy and the corporate, another technical
movements or market psychology.
IV. SCOPE OF THE STUDY
Index movement of the stock exchange is the clear indicator of the fluctuation which acts as
guideline for the investors. The movement of index can be captured by the nature of relationship
between beta, returns and volatility. This study has been attempted to find out how far the beta will
act as an indicator for the investors to take decision. The study was also helpful for the new
investors, researchers, brokers etc., for decision making.
V. OBJECTIVES OF THE STUDY
To study the share price movements of the selected nifty shares.
To study the volatility in the NIFTY shares.
To study the relation between GDP and Inflation on the Share Price movements
VI. RESEARCH METHODOLOGY
1. Sampling Technique
Sampling is the process of selecting a sufficient number of elements from the population, so
that a study of the sample and an understanding of its properties or characteristics would
make it possible for us to generalizing such properties or characteristics.
2. Source of Data
All the data are collected from various websites like nseindia.com and bseindia.com for the
share prices and SENSEX, indiainfoline.com and corresponding websites of each company.
3. Period of Study
The period of study is five years from 1st
April 2007-31st
March 2012.
4. International Journal of Management (IJM), ISSN 0976 – 6502(Print), ISSN 0976 -
6510(Online), Volume 4, Issue 3, May- June (2013)
99
VII TOOLS USED FOR ANALYSIS
• Moving Average
The market indices do not rise or fall in a straight line. The upward and downward
movements are interrupted by counter moves. The underlying trend can be studied by
smoothening the data. To smooth the data moving average technique is used.
The word moving average means that the body of the data moves ahead to include the
recent observations. If it is a five day moving average on the sixth day the body of the data
moves to include the sixth day observation. Likewise it continues. In the moving average
calculation closing price of the stock is used.
Yearly moving average is used for the closing price of the stocks. Since this is a
comparative study we have to compare the share price movements of the companies. Since
the share prices of each company differ a lot from others it is not possible to compare them
using their share prices. It must be classified on a comparable mean with common base.
• Beta Analysis Result
Almost all the company has less than one this indicates the stock of automobile industry are
less volatile. banking industry are less volatile, cement & construction industry are less
volatile except DLF, electrical industry are less volatile except ABB. Gas & oil industry are
less volatile, metal & steel industry are less volatile, pharmaceutical industry are less volatile,
power industry are less volatile except SUZLON, telecommunication industry are high
volatile, automobile industry are less volatile except M & M, retail industry are less volatile.
Other industry are high volatile except IDFC and RELINFRA.
• Correlation analysis Result
Hypothesis: there is a relationship between economic indicators (GDP, WPI & CPI) and
share price movements.
To check this hypothesis GDP, WPI and CPI is taken for the five years of the study
and correlated with the average share price of the NIFTY companies. The correlation is
calculated for the different industries and presented sector wise in the following tables.
Correlation analysis is done to compare the relationship between the share price
movements and economic indicators (GDP, WPI & CPI).
This analysis is individually done with economic indicators X and share price
movements as Y and grouped industry wise.
Correlation of Share Price Movements of all Sectors and Economic Indicators
Correlation of Share Price Movements of Automobile Sector, Banking Sector, Cement &
Construction Sector, Electrical Sector, Gas & Oil Sector, Metal & Steel Sector, Pharmaceutical
Sector ,Power Sector, Telecommunication Sector, IT Sector, Retail Sector. Other Sector,
positive correlative with GDP, inflation and share price movements. From the analysis it can
be infer that share price movements positively correlated with GDP & WPI. It shows that
when there is a increase in GDP & WPI, the share market is also moves up. When CPI is
taken and correlated it gives negative result. It can be infer that investors do not consider CPI
movements.
5. International Journal of Management (IJM), ISSN 0976 – 6502(Print), ISSN 0976 -
6510(Online), Volume 4, Issue 3, May- June (2013)
100
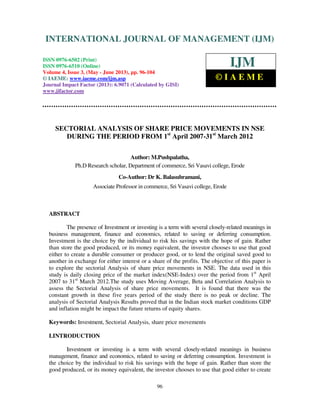
Table 1
Moving Average of Share Price of selected company Name the period
2007 -2012
(Values in Rs.)
Company/Year 2007-2008 2008-2009 2009-2010 2010-2011 2011-2012
AXIS BANK 274.33 490.91 864.9 800 995.71
HDFC 718.91 1022.05 1251.13 1527.9 1749.5
HDFC BANK 825.89 1297.98 2628.65 1478.68 2647.81
ICICI BANK 554.55 893.11 873.63 731.97 864.46
KOTAK BANK 343.77 339.69 1067.79 368.07 780.42
PNB 415.59 516.75 598.42 509.5 937.84
SBIN 682.77 874.49 2034.32 1129.36 2186.75
Source: Computed from PROWESS
Graph-1
Moving Average of Share Price of selected company Name the period
2007 -2012
Sources: Computed from Table-1
0
1000
2000
3000
4000
5000
6000
7000
8000
9000
10000
AXIS BANK HDFC HDFC
BANK
ICICI BANK KOTAK
BANK
PNB SBIN
2011-2012
2010-2011
2009-2010
2008-2009
2007-2008
6. International Journal of Management (IJM), ISSN 0976 – 6502(Print), ISSN 0976 -
6510(Online), Volume 4, Issue 3, May- June (2013)
101
Table-2
Beta Calculation of Banking industry
The following table shows the beta values of companies under the automobile sector.
The NIFTY movements and individual companies share price movements and beta value is
calculated.
Table 4.14: Table Showing Beta Value of Banking Sector
Company Beta
AXIS BANK 0.97
HDFC BANK 0.98
HDFC 0.99
ICICI BANK 0.98
KOTAK BANK 0.98
PNB 0.96
SBIN 0.98
Almost all the company has less than one this indicates the stock of banking industry
are less volatile.
Source:Computed from PROWESS
Table-3
Showing Correlation Coefficient of Banking sector
COMPANY AXISBANK HDFC HDFCBANK ICICIBANK
Correlation (GDP) 0.909791 0.893428 0.906944 0.4104
Correlation (WPI) 0.85961 0.825799 0.854319 0.376688
Correlation (CPI) 0.876364 0.851807 0.870971 0.416325
KOTAKBANK PNB SBIN
0.668565 0.817341 0.848422
0.580512 0.830434 0.789456
0.609674 0.813473 0.807788
Source:Computed from BROWESS
7. International Journal of Management (IJM), ISSN 0976 – 6502(Print), ISSN 0976 -
6510(Online), Volume 4, Issue 3, May- June (2013)
102
VIII .SUMMERY OF FINDINGS AND SUGGESTIONS OF THE STUDY
The following are important findings and suggestions of the study:
It shows a constant growth in these five years period of the study there is no peak or
decline.
Except HERO HONDA rest of the companies shows high net gain.
The entire companies share has grown during the period of the study except
HINDALCO
All the company’s share price moves with the market in banking industry.
The companies in an electrical industry having good share price values.
The volatility in shares in Gas &Oil industries is less.
The SUNPHARMA alone shows a constant growth.
The SUZLON have slow growth.
TATAPOWER shows a constant increase in this industry.
Metal & Steel industries net gain is high.
The BHARTIARTL has a rapid growth among all the companies.
All the company’s in cement & construction industries is now gradually growing.
Investors in IT industries are getting minimum profit.
Retail industries is booming the study period
All companies are having high volatility except IDFC & LT.
In today’s fluctuating market banking industry and computer software industry are
highly sensitive
So if investor wishes to get high return they can invest in banking industry especially
in SBIN.
It is also to be noted that the risk is also in investing these stocks since it depends on
societal variation.
Except reliance petroleum all the NIFTY company performing well, due to innovation
& technology advancement. So we can expect a increase in share price as well stable
income in the form of dividend.
So for this reason if the investor wishes to get high returns he can well invest in these
scrip’s of either pharmacy industry or power.
IX. CONCLUSION
The present study attempted to find whether GDP and inflation influence the return of
equity shares. The analysis proved that in the Indian stock market conditions GDP and
inflation might be impact the future returns of equity shares. Through the results were
carefully obtained, it is mandatory necessary to mention here that the result is subject to the
limitations as mentioned earlier in this study. It would be better if an analysis is carried out
with a large sample to throw better light in the field. However it is conclude that GDP and
inflation cannot be the only factor which affects the future returns of the equity shares in the
Indian environment, as there are many parameters and indicators which shake the near
fundamental of a stock market, like P/E ratio, market capitalization, flow of funds has
domestic as well as international investors.
8. International Journal of Management (IJM), ISSN 0976 – 6502(Print), ISSN 0976 -
6510(Online), Volume 4, Issue 3, May- June (2013)
103
REFERENCES
Books
Pandian punithavathy “Security Analysis and Portfolio Management”,
(7th
Edition; Vikas Publishing house Pvt Ltd).
Kothari, C.R. “Research Methodology”, (4th
Edition: New Age International Publication)
Gupta Shashi R.K., Sharman R.K., “Management Accounting”, (New Delhi Kalyani
Publishers).
Journals
1. McInish, Thomas H., Explaining Investor Behavior using an Adjective Check List,
Journal of Socio-Economics, 20(3): 263-275, 1991.
2. Ronald C. Lease, Wilbuk G. Lewellen and Gary G. Schlarbaum “The Individual
Investor: Attributes and Attitudes”, The Journal of Finance, 20 (2): 413-33, 1974.
3. Kent Baker, H., and John A. Haslem, “Information Needs of Individual Investors”,
The Journal of Accountancy, 64-69, 1973.
4. Joseph K. Winsen, “Investor Behavior and Information”, Journal of Financial and
Quantitative Analysis, 11(1): 13-37, 1976.
5. Glenn N. Pettengill, Susan M. Edwards and Dennis E. Schmitt, “Is momentum
investing a viable strategy for individual investors?”, Financial Services Review, 15
(.) : 181-197, 2006.
6. Nelson Maina Waweru, Evelyne Munyoki and Enrico Uliana, “The Effects of
Behavioural Factors in Investment Decision-Making: A Survey of Institutional
Investors Operating at the Nairobi Stock Exchange”, Int. J. Business and Emerging
Markets, 1 (1): 24-41, 2008.
7. Malcolm Baker and Jeffrey Wurgler, “Investor Sentiment and the Cross-Section of
Stock Returns”, The Journal of Finance, 61(4): 1645-1680, 2006.
8. Anna A. Merikas, Andreas G. Merikas, George S. Vozikis and Dev Prasad,
“Economic Factors and Individual Investor Behavior: The Case of the Greek Stock
Exchange”, Journal of Applied Business Research, 20 (4): 93-98, 2004.
9. Robert A, Nagy and Robert W. Obenberger, “Factors Influencing Individual Investor
Behavior”, Financial Analysts Journal, 50 (4): 63-68, 1994.
10. Paul Vogetheim, Denise D. Schoenbachler, Geoffrey L.Gordon and Craig C. Gordon,
“The Importance of Courting the Individual Investor”, Business Horizons, 44 (1) :
69-76, 2001.
11. Noel Capon, Gavan J. Fitzsimons and Russ Alan Prince, “An Individual Level
Analysis of the Mutual Fund Investment Decision”, Journal of Financial Services
Research , 10(1): 59-82, 1996.
12. Zoran Ivkovic, Clemens Sialm, and Scott Weisbenner, “Portfolio Concentration and
the Performance of Individual Investors”, Journal of Financial and Quantitative
Analysis, 43 (3): 613-656, 2008.
13. Sean Masaki Flynn, “Sentiment and the Interpretation of News about Fundamentals”,
The ICFAI Journal of Behavioral Finance, 3(4), 6-28: 2006.
9. International Journal of Management (IJM), ISSN 0976 – 6502(Print), ISSN 0976 -
6510(Online), Volume 4, Issue 3, May- June (2013)
104
14. Arvid Oskar Ivar Hoffmann1 and Wander Jager1, “The Effect of Different Needs,
Decision-Making Processes and Network-Structures on Simulating Stock-Market
Dynamics: A Framework for Simulation Experiments”, Journal of Management and
Organization, University of Groningen, Landleven 5, 9700, AV Groningen, the
Netherlands.
15. Mei-Chen Lin, “Returns and Investor Behavior in Taiwan: Does Overconfidence
Explain this Relationship?”, Review of Pacific Basin Financial Markets and
Policies, 8 (3): 405-446, 2005.
16. R.Karthik and Dr.N.Kannan, “Impact of Foreign Direct Investment on Stock Market
Development: A Study with Reference to India”, International Journal of
Management (IJM), Volume 2, Issue 2, 2011, pp. 75 - 92, ISSN Print: 0976-6502,
ISSN Online: 0976-6510.
17. Govind Chandra Patra and Dr. Shakti Ranjan Mohapatra, “A Study on Volatility of
Indian Stocks and Index – Pre and Post Derivatives Era”, International Journal of
Management (IJM), Volume 1, Issue 2, 2010, pp. 106 - 128, ISSN Print: 0976-6502,
ISSN Online: 0976-6510.