Weitere ähnliche Inhalte
Ähnlich wie 10120140503004
Ähnlich wie 10120140503004 (20)
Mehr von IAEME Publication
Mehr von IAEME Publication (20)
Kürzlich hochgeladen (20)
10120140503004
- 1. International Journal of Management (IJM), ISSN 0976 – 6502(Print), ISSN 0976 - 6510(Online),
Volume 5, Issue 3, March (2014), pp. 36-46 © IAEME
36
IMPACT OF STOCK SPLIT ANNOUNCEMENT ON STOCK PRICES
D.Bhuvaneshwari1
, Dr. K.Ramya2
1
Research Scholar, Avinashilingam School of Management Technology,
Avinashilingam Institute for Home Science and Higher Education for Women, Coimbatore
2
Assistant Professor (SS), Avinashilingam School of Management Technology,
Avinashilingam Institute for Home Science and Higher Education for Women, Coimbatore
ABSTRACT
Corporate events have numerous effects on the stock market and it is been observed that
stock price movements is an area of research that attracted the attention of various researchers.
Therefore, the present study attempts to contribute to the understanding of the behavior of Indian
share prices in relation to stock split announcements. A standard event study methodology is adopted
in this study to examine the impact and price reactions of CNX Nifty companies of NSE from
January 2006 to December 2013 surrounding sixty days of the announcement dates. Abnormal
returns were calculated and t-tests are conducted to test the significance. From the study, it can be
inferred that stock split announcement have positive impact of stock prices around announcement
dates.
Key Words: Abnormal Returns, CNX Nifty, Corporate Announcements, Stock Splits, Event Study
Methodology.
1. INTRODUCTION
A stock split is a corporate action that increases the number of the corporation’s outstanding
shares by splitting a share into 2 or more. The stock’s market capitalization however remains the
same. In general, a company resorts to stock split when its share become very expensive and when
investors finds hard to invest in the company’s share. Split can occur at any ratio and the ratios like
2:1, 3:2, etc are commonly used. Stock split does not affect the fundamental value of the share but
splitting shares enables many retail investors to invest and take advantage of low prices. This might
also increase the demand of the share and hence prices too.
The main concept of stock splitting is to make share prices at a much more affordable level
and accessible to as many investors as possible. Empirical researchers have been carried out to study
stock price reactions to corporate announcements like dividends, stock splits, bonus issues, etc.
INTERNATIONAL JOURNAL OF MANAGEMENT (IJM)
ISSN 0976-6502 (Print)
ISSN 0976-6510 (Online)
Volume 5, Issue 3, March (2014), pp. 36-46
© IAEME: www.iaeme.com/ijm.asp
Journal Impact Factor (2014): 7.2230 (Calculated by GISI)
www.jifactor.com
IJM
© I A E M E
- 2. International Journal of Management (IJM), ISSN 0976 – 6502(Print), ISSN 0976 - 6510(Online),
Volume 5, Issue 3, March (2014), pp. 36-46 © IAEME
37
Recently, several companies have opted for stock splits. Previous research studies have proved that
in case of stock splits, in addition to changes in distribution of stock returns, the volatility in stock
return increases around the split ex-dates. The market price and efficiency can be studied using the
effect of stock split announcements. It can affect the market price positively or negatively. In this
study, the impact of stock split on stock prices are identified using event study methodology.
2. REVIEW OF LITERATURE
Many assertions are made about the impact of stock splits on stock prices. There are
numerous studies which have estimated the effects of announcements related to stock split and other
corporate events on the stock and market prices. In the present study, the impact of stock split is
identified and the pertinent literatures related to the context are as follows:
Pooja (2013) analyzed the market reaction around stock split announcement using event
study methodology by taking a sample of 27 companies that split their stock during the period
January 1, 2008 to December 31, 2009. The result revealed that there is no announcement effect
associated with stock splits in India. The study found improvement in trading volume of shares but
daily turnover does not increase. Stock Splits were also found to improve the average number of
trades and thus affected the liquidity of stocks in India.
Sultan Singh and Kumari Supna (2013) examined the efficiency of Indian stock market
around stock splits announcement in India during the period 2006-07 to 2009-10. A database of 309
observations by complete enumeration method had been constructed, which reduced to 219
observations after implementing the criteria. The event study methodology had been used for
calculating the abnormal returns. Percentile method and the paired t-test for means have been used to
examine the impact of announcement on liquidity. The study found significant CAAR and mixed
results regarding liquidity aspect. From percentile method it was found that number of transactions
had increased only in few companies but the results of the paired t-test was contradictory to the
results.
Deborah A. Ford, et al (2012) examined the influence of the number of financial analysts
following a firm on market reaction around the announcement of stock splits. Results proved that the
raw as well as abnormal returns at the announcement of stock splits were negatively related to the
level of analyst coverage. The negative relation prevails even after controlling for size, book-to-
market, split factors and post-split target price. The findings of this article suggest that information
asymmetry is an important factor influencing market reaction to stock split announcements.
Anirban Ghatak (2011) aimed to examine the stock price reaction to information release of
bonus issues or stock splits with a view of examining whether the Indian stock market is semi-
strong efficient or not. Event study methodology was used to study the efficiency characteristics. The
study concluded that there is positive AAR before the announcement date but the quantum is less and
they are insignificant.
Koustubh Kanti Ray (2011) stated that stock split and bonus issue has impact over market
movements. These events are tested for abnormal returns and liquidity. –30 to +30 days investigation
window were taken for all the events to test the abnormal returns and the change in liquidity. The
results suggested that the Indian market reacts to the stock split announcements but not to bonus
issues, and the change in liquidity is significant for stock splits at 1% significance level.
Neetu Mehndiratta and Shuchi Gupta (2010) attempted to contribute positively to the
understanding of the behavior of Indian share prices in relation to the dividend announcements. It is
said that dividend announcements are usually considered as the positive signal to its shareholders and
positive impact on share prices are also expected. A standard even study methodology is used to
examine the price reactions on stock prices. This study found that average abnormal returns occur
randomly.
- 3. International Journal of Management (IJM), ISSN 0976 – 6502(Print), ISSN 0976 - 6510(Online),
Volume 5, Issue 3, March (2014), pp. 36-46 © IAEME
38
Pantisa Pavabutr and Kulpatra Sirodom (2008) explored the impact of stock splits on stock
price and various aspects of liquidity using daily and intraday data from the Stock Exchange of
Thailand from 2002-2004. They provided evidence for reductions in trade frictions and increases in
split-adjusted price levels are associated with the size of split factors and post-split trading range.
Stocks with high split factors have better post-split adjusted price performance and lower trade bid-
ask spreads and price impact. The empirical findings lend support to the trading range hypothesis of
stock splits.
A. Gupta and O.P. Gupta (2007) maintained that stock splits are connected with positive
abnormal returns around the announcement. Normally, splits are found to improve the trading
volume of shares and there was an increase in the daily number of traders. But they do not improve
the daily turnover and consequently the liquidity of stocks in India. At the end, it was concluded that
a majority of shares which announced split was traded at low market prices.
E. F. Fama et al. (1969) found that two types of events are associated with a positive stock
market effect. The literatures in this area are divided into three categories: the first category deals
with the potential theoretical reasons that can explain why managers may resort to stock splits and
stock dividends. The second category consists of papers that are predominantly of empirical nature
and those who investigate and document the reaction of the stock market around the announcement
of the decision to split/ bonus. The third category of papers deals with the long term implications of
stock split / stock dividend and compare variables such as rates of returns, variance, short interest,
market betas, traded volume, bid-ask spread, liquidity around pre and post announcement periods.
This paper falls in the second category and focused on reviewing the literature from the point of
different explanations for the announcement of stock split and stock dividends.
3. OBJECTIVES AND HYPOTHESES
3.1 Objectives
1. To examine the stock market reaction to stock split information of CNX Nifty companies.
2. To examine whether there is any abnormal returns around the announcement date of the stock
splits.
3.2 Hypotheses
Hypothesis 1: There is no significant impact on stock prices around the announcements of stock
splits.
Hypothesis 2: There is no significant difference in abnormal returns of stock split announced
companies’ post-announcement of stock split, when compared to pre-announcement of stock split.
4. SAMPLE AND DATA
4.1 Sample
The companies that announced stock split among CNX Nifty listed companies of NSE during
January 2006 to December 2013 have been considered as the sample. The CNX Nifty is a well
diversified 50 stock index accounting for 22 sectors of the economy where 15 companies have
announced stock splits during the selected study period. Companies that have any price sensitive or
lack of information during the event window (-30 days to +30 days) are eliminated.
4.2 Data
Three sets of data have been used in this study. The first set of data consists of stock split
announcement made by the sample companies which was collected from capitaline database. This
includes the dates on which stock splits were announced by the companies. The second set of data
- 4. International Journal of Management (IJM), ISSN 0976 – 6502(Print), ISSN 0976 - 6510(Online),
Volume 5, Issue 3, March (2014), pp. 36-46 © IAEME
39
consists of daily-adjusted closing prices of the selected stocks from NSE. Daily-adjusted closing
prices are assumed to reflect the consensus of the market participants regarding price of the stock at
the end of the trading. The third set of data consists of CNX Nifty index of ordinary share prices
complied and published by NSE on daily basis. These data have been collected from NSE website
(http://www.nseindia.com/). Companies with their company code, NSE symbol and date of stock
split announcement during the selected range of years are clearly listed based on the company code
in table.1.
Table. 1
Companies with Stock Split Announcements
S.
No
Company
Code
Company Name NSE Symbol
Source
Date
1 34 Asian Paints Ltd. ASIANPAINT 09/05/2013
2 230
Housing Development Finance
Corporation Ltd.
HDFC 03/05/2010
3 365 Mahindra & Mahindra Ltd. M&M 25/01/2010
4 502 Sesa Sterlite Ltd. SSLT 29/04/2008
5 554 Tata Power Co. Ltd. TATAPOWER 19/05/2011
6 560 Tata Motors Ltd. TATAMOTORS 26/05/2011
7 2306 Bharat Heavy Electricals Ltd. BHEL 23/05/2011
8 2330 Kotak Mahindra Bank Ltd. KOTAKBANK 11/05/2010
9 3026 Lupin Ltd. LUPIN 05/05/2010
10 4325 Sun Pharmaceutical Industries Ltd. SUNPHARMA 24/09/2010
11 4987 HDFC Bank Ltd. HDFCBANK 18/04/2011
12 6068 Oil & Natural Gas Corporation Ltd. ONGC 16/12/2010
13 15293 Jaiprakash Associates Ltd. JPASSOCIAT 15/10/2007
14 15542 Bharti Airtel Ltd. BHARTIARTL 29/04/2009
15 20287 Jindal Steel & Power Ltd. JINDALSTEL 21/11/2007
5. METHODOLOGY
The study is descriptive in nature and secondary data has been used. In this study, the two
stage approach is used. The first stage consists of estimation of parameters like beta based on the ex-
post returns on stocks and market index and expected returns on each of the stocks based on the
market model. In the second stage, the estimated parameters are used to calculate abnormal returns
around the source date. In this research, the date of stock split announcement is defined as day 0 or
source day. If source day is a non-trading day then the immediately following trading day is
considered as source day. It can also be mentioned as event day. Pre-announcement period includes
30 trading days prior to the stock split announcement i.e. days -30 to -1. Post-announcement period
includes 30 trading days after the stock split announcement i.e. days +1 to +30. Thus, the event
window of 61 trading days (including day 0 as the source day) have considered for the study. The
estimated ARs are averaged across securities to calculate Average Abnormal Returns (AARs) and
AARs are cumulated to ascertain Cumulative Average Abnormal Returns (CAARs). In this study,
the following simplified model of regression is used for estimating the expected returns on each
security by taking the actual returns on market.
- 5. International Journal of Management (IJM), ISSN 0976 – 6502(Print), ISSN 0976 - 6510(Online),
Volume 5, Issue 3, March (2014), pp. 36-46 © IAEME
40
݀݁ݐܿ݁ݔܧ ܴ݁݊ݎݑݐ ൌ ܧ ሺܴ݅ݐሻ ൌ ߙ݅ ߚ݅ ܴ݉ݐ
Where,
E (Rit) = Expected return on security ‘i’ during time period ‘t’.
ai = Intercept of a straight line or alpha coefficient of ith
security.
bi = Slope of a straight line or beta coefficient of ith
security.
Rmt = Expected return on index (CNX Nifty index in this study) during period ‘t’.
Following are the models used for calculations:
Abnormal returns (ARs)
ݐܴ݅ܣ ൌ ܴ݅ݐ െ ܧ ሺܴ݅ݐሻ
Where,
Rit = Actual Returns
E (Rit) = Expected Return on Security
Average abnormal returns (AARs)
ݐܴ݅ܣܣ ൌ
∑ ݐܴ݅ܣே
ୀଵ
ܰ
Where,
i = Number of securities in the study
N = Total number of securities in the portfolio
t = Days surrounding the event-day
Cumulative Average Abnormal Returns (CAAR)
ݐܴܣܣܥ ൌ ݐܴ݅ܣܣ
௧ୀିଷ
Where,
t = -30,…0,…+30
t Value for AAR
ݐ ሺܴܣܣሻ ൌ
ܴܣܣ
ߪ/√15
Where,
σ = Standard deviation
t Value for CAAR
ݐ ሺܴܣܣܥሻ ൌ
CAAR
σ כ √Days
6. DATA ANALYSIS AND INTERPRETATION
6.1 Abnormal Returns
Abnormal returns is used to describe the returns generated by a given security or portfolio
over a period of time which is different from the expected rate of return. The abnormal return of each
company is computed and listed in table. 2.
- 6. International Journal of Management (IJM), ISSN 0976 – 6502(Print), ISSN 0976 - 6510(Online),
Volume 5, Issue 3, March (2014), pp. 36-46 © IAEME
41
Table. 2
Abnormal Returns of the Companies
S .No 1 2 3 4 5 6 7 8 9 10 11 12 13 14 15 Sum of AR
-30 -1.61 -0.5 -0.08 4.03 0.67 -1.56 -0.23 0.95 0.18 -0.66 2.99 1.57 0.03 -8.44 -4.23 -6.89
-29 0.68 -0.51 0.77 -4.76 -1.9 -0.51 0.02 -0.34 1.9 0.34 1.31 0.45 -0.4 -2.11 8.28 3.23
-28 -1.61 0.63 -1.11 0.5 -0.79 0.37 0.97 0.19 0.5 -1.9 -0.82 2.73 0.09 0.31 -2.48 -2.42
-27 0.26 1.72 1.15 -6.54 1.21 -0.37 0.66 0.21 -1.53 -0.64 0.13 1.34 -1.67 0.58 -0.55 -4.06
-26 -0.12 2.3 -1.21 -1.19 0.39 -0.81 -0.14 -1.41 -0.56 3.06 -0.59 -1.07 0.44 -1.72 1.68 -0.95
-25 0.46 2.03 2.79 8.59 0.66 1.6 1.12 0.41 -0.47 0.66 -0.27 -0.43 -0.85 -0.39 0.54 16.45
-24 -1.72 0.86 0.69 -5.04 -1.73 -1.32 -0.66 1.99 -3.23 0.04 -0.12 1.72 1.36 -0.36 -2.24 -9.78
-23 0.09 0.46 0.38 -0.99 0.4 -0.16 -2.35 0.39 1.86 -0.58 0.06 -0.94 0.29 -0.4 -2.03 -3.51
-22 -1.66 -2.9 -3.18 -3.16 0.73 1.46 -0.62 1.54 -1.15 0.22 0.17 0.63 2.1 1.67 -6.83 -10.97
-21 -0.52 1.31 -1.59 0.34 -0.33 -0.57 -4.65 -1.66 0.58 0.16 -1.65 1.13 0.08 -3.7 -0.16 -11.22
-20 -3.18 -0.4 1.03 -0.43 1.03 -0.36 0.93 -2.1 -2.43 -0.55 -2.35 0.1 -0.93 2.01 7.46 -0.19
-19 -1.9 -0.72 1.61 2.91 0.14 1.32 -0.05 0.62 0.89 -0.14 -1.34 -0.19 1.28 -0.94 1.33 4.81
-18 -0.43 -1.01 -0.77 -6.51 0.06 0.23 -2.07 -1.78 -0.84 -1.45 1.11 0.09 -0.57 1.84 4.25 -7.86
-17 0.03 -0.42 0.42 -3.77 -0.44 -1.99 -0.49 -2.51 0.54 0.62 0.86 2.47 -5.16 1.16 3.45 -5.23
-16 2.51 -0.79 1.03 -0.57 -0.54 0.28 1.1 1.44 -0.61 -1.3 -0.88 -0.56 -1.89 -3.1 2.9 -0.99
-15 -0.83 1.83 3.72 -1.71 0.19 -0.16 1.28 0.07 -1.36 -1.22 -0.2 -0.72 -1.22 -0.88 6.48 5.26
-14 0.15 0.45 0.84 0.64 0.17 3.04 2.2 1.03 0.52 -0.56 0.63 -0.42 2.84 1.83 24.62 37.98
-13 -0.99 0 2.19 1.9 3.26 -0.27 1.08 -0.84 2.29 -0.61 0.01 2.26 -0.92 -2.24 2.8 9.92
-12 -0.7 0.63 -1.79 3.48 0.6 -1.89 -0.06 -0.54 -0.42 -0.65 1.37 0.31 2.71 0.46 2.31 5.81
-11 -0.5 0.6 0.04 3.27 -1.83 -0.1 1.74 0.8 0.58 1.65 1.32 0.68 -1.46 -1.69 1.9 7.00
-10 -0.15 -0.64 -0.31 -0.59 -4.37 3.81 0.08 -0.3 -2.01 -0.83 -0.44 3.29 4.09 0.33 -4.53 -2.56
-9 -0.53 -0.11 3.51 -4.3 -1.17 -3.7 -0.22 0.25 -0.92 -0.43 1.08 2.52 3.34 0.44 -4.85 -5.09
-8 1.18 -0.74 -3.77 4.51 -0.02 2.99 -1.07 -2.17 0.64 -0.83 -1.82 1.31 -0.9 1.36 -6.94 -6.27
-7 -0.18 -0.67 0.83 -1.35 2.44 1.55 2.37 0.58 -0.94 2.84 -1.09 0.82 -4.19 1.19 -2.11 2.08
-6 -1.01 0.59 -1.65 -2.02 -1.12 -1.67 -2.68 1.37 1.13 1.89 0.34 2.18 -3.56 4.74 2.53 1.07
-5 0.45 1.57 1.62 1.17 -0.96 -3.4 1.29 1.06 0.85 1.43 2.46 1.83 3.92 -0.12 2.16 15.32
-4 -0.6 -0.49 -1.57 2.34 -0.74 -1.34 1.94 2.47 -0.72 -0.61 -0.02 0.01 -2.7 -3.43 -3 -8.45
-3 3.1 0.52 -1.02 4.37 1.11 3.83 0.58 1.29 0.97 2.56 -1.98 0.08 10.33 4.21 -4.61 25.35
-2 0.36 0.37 1.89 -1.54 0.49 -3.81 0.39 -3.09 3.41 -0.48 1.84 0.83 -3.87 -0.66 -1.99 -5.88
-1 -1.26 0.09 -0.5 5.75 0.63 0.15 -0.91 1.74 -1.06 -1.67 -0.16 0.76 1.12 0.18 4.61 9.45
0 -3.86 -1.12 -4.93 10.67 1.51 -0.35 2.34 -0.46 3.83 1.23 -0.49 0.52 -3.96 0.67 0.31 5.89
1 -1.1 -0.56 -2.79 1.07 -3.3 0.52 -7.09 2.29 -0.33 1.03 0.11 0.79 2.56 -4.13 -5.86 -16.79
2 1.42 -1.03 0.8 1.5 2.76 -6.88 1.37 0.34 -1.14 1.16 0.98 -1.16 -4.83 -1.46 0.93 -5.24
3 0.07 -0.89 -0.92 -0.12 -2.15 -3.57 -2.27 -0.16 -1.25 1.66 1.8 0.08 -5.25 1.71 18.27 7.00
- 7. International Journal of Management (IJM), ISSN 0976 – 6502(Print), ISSN 0976 - 6510(Online),
Volume 5, Issue 3, March (2014), pp. 36-46 © IAEME
42
4 0.79 -1.16 2.03 -2 0.44 0.7 -0.55 4.3 -1.23 0.61 -0.03 1.19 -0.27 1.65 14.25 20.71
5 0.65 2.29 -1.57 -5.01 -2.38 -0.42 0.84 -0.43 -0.11 -0.36 -1.07 0.4 -0.73 -0.34 -5.81 -14.05
6 0.47 1.57 1.82 1.7 0.26 -2.29 -1.5 -1.07 0.63 1.46 0.43 0.09 5.07 -0.99 -0.25 7.40
7 -1.28 1.01 -2.21 1.55 0.31 -2.74 0.2 -0.15 -0.21 -0.23 0.12 1.21 1.44 2.56 -3.93 -2.34
8 -0.86 -1.09 -1.8 -2.49 -0.58 -0.97 1.18 -0.88 -1.75 -1.28 -0.9 0.02 -3.06 1.28 4 -9.17
9 0.25 0.25 0.14 1.05 1.48 0.73 -0.45 -0.45 1.7 0.08 -0.26 1.31 10.26 -2.96 2.86 15.99
10 0.96 -0.81 1.19 3.24 1.74 0.14 -1.24 1.78 -1.65 1.23 0.16 -0.23 -0.69 2.43 8.99 17.25
11 -0.31 -1.88 -1.69 1.04 0.76 -0.04 -0.15 -0.9 0.89 -0.06 -2.74 0.01 5.48 8.64 -2.65 6.39
12 -0.17 0.63 -2.92 -0.45 -0.22 -0.36 0.18 -0.93 0.83 1.12 0.21 0.93 -1.97 -8.81 -1.81 -13.73
13 -0.24 -1.57 2 -2.02 -0.35 -1.6 0.41 -1.42 -0.84 -0.32 -0.22 0.38 -4.12 -5.15 -0.95 -16.01
14 -0.42 -0.77 1.35 -1.44 -0.34 -1.53 1.67 -0.78 0.36 0.12 -0.04 -0.4 2.44 0.33 -2.08 -1.52
15 -0.29 -0.38 1.14 0.15 0.05 2.14 -0.33 2.74 -0.85 -2.45 0.09 -2.1 3.42 0.09 1.61 5.04
16 1.75 0.94 0.51 0.75 -0.19 -0.32 -0.16 -1.7 -1.82 0.25 -0.99 0.04 4.51 -5.84 4.17 1.91
17 -0.55 -0.16 -1.12 -0.46 0.58 2.74 1.93 -1.99 1.42 0.11 2.11 -0.81 1.08 -2.29 -1.18 1.41
18 -3.43 2.57 -0.37 -0.02 -0.5 -5.42 0.01 -1.78 1.39 -0.34 -3.94 1.7 -1.66 -4.08 -0.43 -16.31
19 -0.39 -1.29 -0.85 0.86 1.58 0.74 0.98 2.99 -0.14 3.19 0.38 0.06 0.09 2.05 -6.65 3.60
20 -0.32 -1.31 -1.19 2.68 -0.4 -0.97 1.69 -0.71 -1.21 0.98 -0.63 2.83 -2.72 0.59 -5.81 -6.50
21 -1.36 -0.35 -2.28 3.09 -0.32 -2.98 -1.12 -0.62 -0.65 -0.48 -0.09 -0.38 1.35 -3.8 0.41 -9.59
22 -0.93 -1 0.06 -5.95 2.05 0.54 -0.55 -1.63 -0.15 -0.42 2.1 -0.02 -2.87 -0.58 0.95 -8.40
23 -1.04 1.51 4.09 -0.26 -1.89 0.52 0.14 0.8 0.42 -1.08 -1.45 0.23 -0.37 -0.49 -1.16 -0.02
24 -0.79 -1.33 3.51 -6.49 -0.22 -0.69 -3.45 -0.88 -0.91 0.93 4.08 0.01 0.58 1.25 1.96 -2.46
25 0.1 0.84 0.62 -2.35 1.6 0.11 1.83 -0.7 0.41 -0.7 -2.07 -1.53 12.47 0.84 -2.59 8.88
26 -1.03 -0.09 -0.23 5.12 -0.86 -0.42 0.81 -1.18 0.88 3.06 1.24 -1.67 -1.34 1.52 5.45 11.25
27 1.84 0.49 -0.32 3.39 2.23 -0.98 1.09 -0.19 -1.52 -0.15 -2.01 3.34 -1.73 -2.87 -0.05 2.55
28 -0.05 0.67 3.8 1.72 0.65 1.93 1.42 0.25 -1.77 2.29 -1.38 0.49 4.97 0.44 -1.37 14.05
29 -0.01 1.13 1.26 -1.1 -0.56 0.33 0.67 0.07 1.12 -1.22 2.05 -0.09 -1.83 2.59 3.4 7.82
30 0.54 0.29 0.15 1.33 -0.66 -0.57 -0.27 0.85 -0.24 1.24 0.25 3.18 0.79 -2.11 1.5 6.27
From the above AR table, it is clearly shown that there is more number of negative returns
than the positive returns in pre-announcement event window. In post-announcement, positive returns
are more than the negative returns which means the investors could gain positive abnormal returns
after the announcement of stock split.
6.2 AAR, CAAR and t Test
The abnormal returns of individual security are averaged for each day surrounding the event
day i.e. 31 days before the event day and 30 days after the event day. The AAR is the average
deviation of actual returns of a security from the expected returns. CAAR provides information about
the average price behavior of securities during the event window. CAAR is calculated by cumulating
average abnormal returns. To study the significance of returns and to test the hypotheses t test was
used. The Calculated AAR, CAAR and t value (both AAR and CAAR) are shown in table. 3.
- 8. International Journal of Management (IJM), ISSN 0976 – 6502(Print), ISSN 0976 - 6510(Online),
Volume 5, Issue 3, March (2014), pp. 36-46 © IAEME
43
Table. 3
Average Abnormal Returns (AAR), Cumulative Average Abnormal Returns (CAAR) and t Values of Stock Split Announced Companies
Event
Window
AAR CAAR
t Value
(AAR)
t Value
(CAAR)
Event
Window
AAR CAAR
t Value
(AAR)
t Value
(CAAR)
-30 -0.46 -0.46 -0.61 -0.16 0 0.39 3.82 0.41 0.18
-29 0.22 -0.24 0.30 -0.06 1 -1.12 2.70 -1.49 0.16
-28 -0.16 -0.41 -0.48 -0.18 2 -0.35 2.35 -0.53 0.16
-27 -0.27 -0.68 -0.52 -0.17 3 0.47 2.82 0.34 0.09
-26 -0.06 -0.74 -0.17 -0.23 4 1.38 4.20 1.38 0.18
-25 1.10 0.36 1.84* 0.06 5 -0.94 3.26 -1.71* 0.26
-24 -0.65 -0.30 -1.30 -0.06 6 0.49 3.75 1.08 0.35
-23 -0.23 -0.53 -0.86 -0.18 7 -0.16 3.60 -0.34 0.33
-22 -0.73 -1.26 -1.15 -0.17 8 -0.61 2.99 -1.37 0.28
-21 -0.75 -2.01 -1.73* -0.38 9 1.07 4.05 1.44 0.22
-20 -0.01 -2.02 -0.02 -0.24 10 1.15 5.20 1.73* 0.32
-19 0.32 -1.70 0.97 -0.39 11 0.43 5.63 0.55 0.29
-18 -0.52 -2.23 -0.89 -0.27 12 -0.92 4.71 -1.43 0.29
-17 -0.35 -2.57 -0.60 -0.31 13 -1.07 3.65 -2.34** 0.31
-16 -0.07 -2.64 -0.16 -0.42 14 -0.10 3.54 -0.32 0.43
-15 0.35 -2.29 0.61 -0.26 15 0.34 3.88 0.79 0.35
-14 2.53 0.24 1.58 0.01 16 0.13 4.01 0.20 0.24
-13 0.66 0.90 1.52 0.13 17 0.09 4.10 0.24 0.39
-12 0.39 1.29 0.97 0.19 18 -1.09 3.01 -1.83* 0.19
-11 0.47 1.76 1.26 0.27 19 0.24 3.25 0.40 0.20
-10 -0.17 1.59 -0.26 0.14 20 -0.43 2.82 -0.78 0.18
-9 -0.34 1.25 -0.52 0.11 21 -0.64 2.18 -1.49 0.18
-8 -0.42 0.83 -0.59 0.06 22 -0.56 1.62 -1.10 0.11
-7 0.14 0.97 0.28 0.10 23 0.00 1.62 0.00 0.15
-6 0.07 1.04 0.12 0.09 24 -0.16 1.46 -0.24 0.08
-5 1.02 2.06 2.38** 0.24 25 0.59 2.05 0.64 0.08
-4 -0.56 1.50 -1.22 0.16 26 0.75 2.80 1.30 0.17
-3 1.69 3.19 1.92* 0.18 27 0.17 2.97 0.35 0.20
-2 -0.39 2.80 -0.71 0.24 28 0.94 3.91 1.95* 0.27
-1 0.63 3.43 1.18 0.30 29 0.52 4.43 1.39 0.39
0 0.39 3.82 0.41 0.18 30 0.42 4.84 1.34 0.52
*Significant at 10% level
**Significant at 5% level
- 9. International Journal of Management (IJM), ISSN 0976 – 6502(Print), ISSN 0976 - 6510(Online),
Volume 5, Issue 3, March (2014), pp. 36-46 © IAEME
44
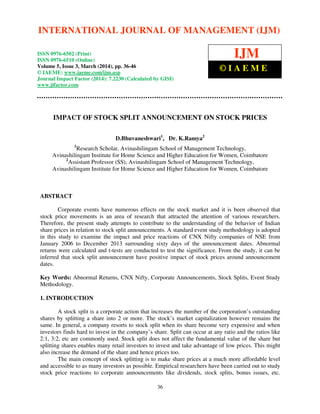
The values of AARs presented in table shows that there are fluctuating returns both positive
and negative returns around the event day. The AAR was positive for thirteen days and negative for
seventeen days during the thirty day pre announcement period. During the post announcement
period there was 16 positive AARS and 14 negative AARS. The influence of the announcement was
found to be positive and significant for 5 days (-25,-5,-3, +10 and +28 days), and significant negative
returns for four days (-21, +5, +13, +18 days). The AAR positively significant at 5% level on -5 day,
reflect leakage of the information (insider information - directors, senior officers or major
shareholders). It was found that the share price reaction was positive on the event day of 0.39% and
also clearly shown that the stock split announcements provided significant positive information to
the firms. Therefore, the hypothesis 1 can be rejected and it is implied that there is significant
abnormal returns around the stock split announcements. The CAAR during (-30 to -10) days was
1.587%,(-30 to 0 day) was 3.818% and 4.844% from (-30 to +30 days). This implies that investors
could earn excess return during the event window period.
Fig. 1: AAR of stock splits
Fig. 2: CAAR of stock splits
-1.50
-1.00
-0.50
0.00
0.50
1.00
1.50
2.00
2.50
3.00
-30-28-26-24-22-20-18-16-14-12-10 -8 -6 -4 -2 0 2 4 6 8 10 12 14 16 18 20 22 24 26 28 30
AAR of Stock Splits
AAR
-4.00
-3.00
-2.00
-1.00
0.00
1.00
2.00
3.00
4.00
5.00
6.00
7.00
-30-28-26-24-22-20-18-16-14-12-10 -8 -6 -4 -2 0 2 4 6 8 10 12 14 16 18 20 22 24 26 28 30
CAAR of Stock Splits
CAAR
- 10. International Journal of Management (IJM), ISSN 0976 – 6502(Print), ISSN 0976 - 6510(Online),
Volume 5, Issue 3, March (2014), pp. 36-46 © IAEME
45
6.3 Paired t test for AAR
Paired t tests typically consist of a sample of matched pairs of similar units, or one group of
units. Paired t tests are often referred to as dependent samples t tests. AAR for the sample companies
has been separated into two categories (pre and post - stock split announcement AAR) and paired t
test has been done using the both categories. The calculated result of paired t test is shown in the
table. 4.
Table. 4
Paired t Test for Pre and Post Stock Split Announcement AAR
t Test: Paired Two Sample for Means Variable 1 Variable 2
Mean 0.114233074 0.034191045
Variance 0.541410748 0.489269373
Observations 30 30
Pearson Correlation 0.096232982
Hypothesized Mean Difference 0
Degrees of Freedom 29
t Statistics 0.45421233
P(T<=t) one-tail 0.326528722
t Critical one-tail 1.699126996
P(T<=t) two-tail 0.653057444
t Critical two-tail 2.045229611
Observed t statistics (0.454) is lesser than the tabular t value (1.699). The significance level is
at 5% where P value (one tailed) is 32.65% which is greater than the significance level. Therefore,
the hypothesis 2 is rejected. This means that there is significant difference in abnormal returns of
CNX Nifty companies’ post-stock split announcement, when compared with pre-stock split
announcement and the investors could gain abnormal returns on stock prices.
6.4 Share Price Performance on Stock Splits
Table. 5
Share Price Performance on Stock Splits
Particulars
No. of
companies
Percentage
Companies having positive mean return during event
window
9 60%
Companies having negative mean return during event
window
6 40%
Companies having positive return on announcement
date
8 53.33%
Companies having negative return on announcement
date
7 46.67%
Total Companies 15 100%
The above table shows that number of companies having positive mean return during the
event window is more than the companies having negative mean return. Number of companies
- 11. International Journal of Management (IJM), ISSN 0976 – 6502(Print), ISSN 0976 - 6510(Online),
Volume 5, Issue 3, March (2014), pp. 36-46 © IAEME
46
having positive return on announcement date is also more than the companies having negative return.
Therefore, it can be interpreted that stock split announcements have positive impact on company’s
stock prices.
7. CONCLUSION
Using an event study methodology, the study found that the investors gain significant returns
on the announcement date and around the announcement dates of stock split. t values for both AAR
and CAAR was used to interpret the results. These facts show that stock split announcements leads
to more positive abnormal returns and helps in predicting the future returns and market efficiency.
REFERENCES
1. Pooja, Stock split announcement and liquidity effect: Evidence from India. XIMB Journal, 10
(1), 2013,135 - 148.
2. Sultan Singh & Kumari Supna, Efficiency of Indian stock market: Evidences based on stock
splits. International Journal of Research in Computer Application and Management, 3 (7),
2013, 12 - 21.
3. Deborah A. Ford, Hoang H. Nguyen, & Van T. Nguyen, Analyst coverage and market reaction
around stock split announcement. Applied Financial Economics, 22 (2), 2012, 135 - 145.
4. Anirban Ghatak, Capital market reaction around the stock splits and bonus issues: Evidence
from some Indian IT stocks. Research Journal of Social Science and management, 1 (5), 2011,
191 - 213.
5. Koustubh Kanti Ray, Market reaction to bonus issue and stock splits in India: An empirical
study. The IUP Journal of Applied Finance, 17 (1), 2011, 54 - 69.
6. Neethu Mehndiratta & Shuchi Gupta, Impact of dividend announcement on stock prices.
International Journal of Information Technology and Knowledge Management, 2 (2), 2010,
405 - 410.
7. Pantisa Pavabutr & Kulpatra Sirodom, The impact of stock splits on price and liquidity on the
stock exchange of Thailand. International Research Journal of Finance and Economics, 20,
2008, 123 - 131.
8. A. Gupta & O. P. Gupta, Market reaction to stock market splits: Evidence from India. The IUP
Journal of Applied Finance, 13 (1), 2007, 5 - 22.
9. E.F. Fama, L. Fisher, M. Jensen & R. Roll, The adjustments of stock prices to new
information. International Economic Review, 10 (1), 1969, 1 - 21.
10. Sindhu .K.P., Dr. Kalidas .M.G. and Anil Chandran. S, “A Study on Factors Influencing
Investor Sentiment in Indian Stock Market”, International Journal of Management (IJM),
Volume 5, Issue 1, 2014, pp. 7 - 13, ISSN Print: 0976-6502, ISSN Online: 0976-6510.
11. Govind Chandra Patra and Dr. Shakti Ranjan Mohapatra, “A Study on Volatility of Indian
Stocks and Index – Pre and Post Derivatives Era”, International Journal of Management (IJM),
Volume 1, Issue 2, 2010, pp. 106 - 128, ISSN Print: 0976-6502, ISSN Online: 0976-6510.
12. http://www.nseindia.com/.
13. http://www.nseindia.com/products/content/equities/equities/eq_security.htm.
14. http://www.nseindia.com/products/content/equities/indices/historical_index_data.htm.
15. http://www.nseindia.com/products/content/equities/indices/cnx_nifty.htm.