Income Replacement and Data Analytics: Retirement Planning for the Future
•
3 gefällt mir•3,500 views

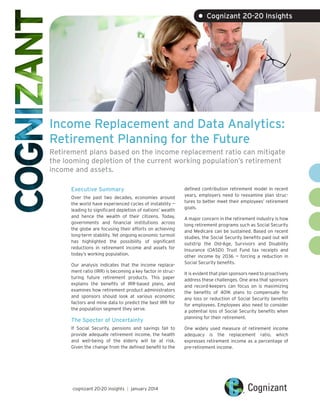
While governments and financial institutions work to achieve long-term stability, the unstable economic landscape threatens to significantly reduce the working population's retirement income and assets. The Income Replacement Ratio (IRR), supported by data analytics, is becoming an important factor in structuring future retirement products and helping more plan participants achieve their retirement goals.

Empfohlen
Empfohlen
Weitere ähnliche Inhalte
Was ist angesagt?
Was ist angesagt? (20)
Ähnlich wie Income Replacement and Data Analytics: Retirement Planning for the Future
Ähnlich wie Income Replacement and Data Analytics: Retirement Planning for the Future (20)
Mehr von Cognizant
Mehr von Cognizant (20)
Income Replacement and Data Analytics: Retirement Planning for the Future
- 1. Income Replacement and Data Analytics: Retirement Planning for the Future Retirement plans based on the income replacement ratio can mitigate the looming depletion of the current working population’s retirement income and assets. Executive Summary Over the past two decades, economies around the world have experienced cycles of instability — leading to significant depletion of nations’ wealth and hence the wealth of their citizens. Today, governments and financial institutions across the globe are focusing their efforts on achieving long-term stability. Yet ongoing economic turmoil has highlighted the possibility of significant reductions in retirement income and assets for today’s working population. Our analysis indicates that the income replace- ment ratio (IRR) is becoming a key factor in struc- turing future retirement products. This paper explains the benefits of IRR-based plans, and examines how retirement product administrators and sponsors should look at various economic factors and mine data to predict the best IRR for the population segment they serve. The Specter of Uncertainty If Social Security, pensions and savings fail to provide adequate retirement income, the health and well-being of the elderly will be at risk. Given the change from the defined benefit to the defined contribution retirement model in recent years, employers need to reexamine plan struc- tures to better meet their employees’ retirement goals. A major concern in the retirement industry is how long retirement programs such as Social Security and Medicare can be sustained. Based on recent studies, the Social Security benefits paid out will outstrip the Old-Age, Survivors and Disability Insurance (OASDI) Trust Fund tax receipts and other income by 2036 — forcing a reduction in Social Security benefits. It is evident that plan sponsors need to proactively address these challenges. One area that sponsors and record-keepers can focus on is maximizing the benefits of 401K plans to compensate for any loss or reduction of Social Security benefits for employees. Employees also need to consider a potential loss of Social Security benefits when planning for their retirement. One widely used measure of retirement income adequacy is the replacement ratio, which expresses retirement income as a percentage of pre-retirement income. • Cognizant 20-20 Insights cognizant 20-20 insights | january 2014
- 2. 2 Income Replacement Ratio The income replacement ratio (IRR) is the amount of income needed post-retirement to maintain the plan participant’s standard of living pre-retire- ment. The formula to compute the IRR is: IRR = Post-Retirement Income/ Pre-Retirement Income Post Retirement Income = (PR Income — PR Tax — PR Savings — PR Misc. Expenses + Age Related Expenses + Post Retirement Tax). PR stands for Pre-Retirement. The IRR typically ranges from 65% to 90%. It is usually less than 100% because both taxes and savings generally decline post-retirement. Work- related expenses, mortgages and the cost of supporting a family also tend to be taken care of before retirement. At the same time, higher medical costs and additional leisure expenses usually become more important considerations for retirees. IRR Need Analysis Understanding the factors that impact IRR requirements can help plan sponsors, record- keepers and participants deepen their insights and maximize the benefits of IRR-based retirement goals. According to our analysis, the key factors affecting the IRR are plan participants’ household income, family status, educational attainment, outside assets and retirement age. To arrive at the “IRR need,” plan sponsors should analyze their employee population and group individuals based on those four key factors, which we have termed “input parameters.” (See Figure 1). The data collected on all employees should then be fed into the IRR need Analysis Methodology framework. A combination of different values of the input parameters will result in different IRR needs. However, not all input parameters will have the same impact on the IRR need. We have assigned different weightages to the input param- eters (see Figure 1) depending on their potential impact on the IRR need. IRR need determines the extent of income replacement required for plan participants post- retirement. The data analysis includes assigning an IRR need score to each participant based on the impact of the input parameter on the IRR and the weightage of the input parameter. The total score for each participant will determine their IRR need. Based on the analysis of the IRR score, par- ticipants can be grouped into three categories: High, Medium or Low. The IRR need will drive the output parameter values for the various groups of participants. Output parameters are associated with retire- ment plans offered to plan participants. Plan sponsors can devise retirement offerings by modifying the output parameters so that par- ticipants will be able to meet their IRR need. For example, retirement offerings for High IRR need participants will have different output parameters than those offered to participants with Low IRR need. Following are the output parameters that can help better define a retirement product: • Investment option: The Investment Option could be High, Medium or Low, based on the growth potential of the investments. Higher growth investments will be associated with higher risk. • Product features: Sponsors will have the option of selecting appropriate product features, such as Auto-Enrollment, Plan Match and Auto Increase, for a group of participants based on their IRR need. • Retiree medical plan: Based on a participant’s profile and the associated income replace- ment need, sponsors can choose to provide post-retirement medical benefits to selected participants. Statistical analysis can be conducted to determine the effects of the input parameters on the IRR. Statistical analysis tests the effects of a range of variables, with the probability that a respondent’s income replacement ratio will exceed the sample’s median ratio. The independent variables in the cognizant 20-20 insights Figure 1 Parameter Weightage for IRR Analysis Input Parameters Weightage Income 0.4 Family Status 0.3 Educational Attainment 0.1 Outside Assets 0.1 Retirement Age 0.1
- 3. 3cognizant 20-20 insights statistical analysis include Income, Family Status (marital status and number of dependents), Edu- cational Attainment, Outside Assets and Retire- ment Age. The analysis therefore controls the effects of the factors mentioned in Figure 1 (see page 2) on the replacement ratio. The results in Figures 4, 5, 6 and 7 demonstrate the impact of these factors on the IRR. In a study conducted by Michigan Retirement Research Center, the median IRR for the statistically selected sample was 68. Leveraging the Outcome of the Analysis Once participants’ appropriate IRR need is estab- lished, the next logical step for sponsors and plan administrators will be to identify the best plan for each participant. This will require analyzing the performance of the existing offerings, under- standing the participant’s current profile, and designing/suggesting appropriate plan features. Data Mining Data mining processes can be used to identify par- ticipants’ IRR need and offer customized solutions and guidance to help participants reach their retirement goals. Record-keepers maintain plan- and participant-specific historical transactions and demographic data. This information can then be analyzed and used to draw valid conclusions. Parameters for Effective Analysis and Outcome Input Parameters IRR need Key Parameter Output Parameters Determine Guide Devise Create Survey Data Support • Income • Family Status • Educational Attainment • Outside Assets • Investment Option • Product Features • Retiree Medical Plan Customized Retirement Offering Plan Participants Plan Sponsors Plan Administrators Figure 2 Greater IRR for Low and High- Income Groups; Lower IRR for Medium-Income Groups Low Medium High Income IRR Figure 3 Figure 4 Illustrated Effect of Income on IRR Income Income Replacement Rate 0-30% 0.72 30%-50% 0.59 50%-70% 0.67 70%-80% 0.68 80%-90% 0.73 90%-100% 0.76 Figure 5 Illustrated Effect of Marital Status on IRR Marital Status Income Replacement Rate Married 0.75 Not Married 0.55 Figure 6 Illustrated Effect of Number of Dependents on IRR Number of Dependents Income Replacement Rate 0 0.47 1 0.70 2 0.74 3 0.70
- 4. cognizant 20-20 insights 4 Plan sponsors can conduct surveys for all plan participants to gather certain demographic data and other relevant information. This data can then be examined to customize the retirement offering. Participants can be offered plan features based on their household income, educational qualification, marital status, number of children, etc. Marketing communications to plan partici- pants can be tailored to encourage more engage- ment, active involvement, and use of the various features and benefits of the plan. Targeted invest- ment advice highlighting high-yielding investment options can also be sent to participants. Plan features that will drive plan performance and par- ticipation rates can be identified by analyzing his- torical data — helping to improve future offerings. Participants’ medical claims data can be analyzed to tailor healthcare plans and encourage employees to adopt healthier habits. By identi- fying gaps in medical treatment, employers can help participants seek the proper care to prevent major healthcare costs. Specialized plans with customized features can be offered to partici- pants to persuade them to remain with an orga- nization. To accelerate an offering’s time to market, plan sponsors and administrators can consult with third-party service providers with relevant expe- rience in the retirement domain and capabili- ties in data analytics. The service provider can work closely with administrators and sponsors to collect the data required for the research and accurately profile participants. Conclusion Plan participation rates and income replacement are key to measuring a retirement plan’s perfor- mance. Each participant’s IRR need is different, and based on factors such as household income, educational qualification and marital status, for example. Plan sponsors and record-keepers should determine a plan participant’s IRR need by analyzing participant and plan-level data. This will help sponsors customize retirement offerings to help more plan participants achieve their retire- ment goals. Participants’ data from the record-keeper and data collected through surveys should be mined for actionable information. Thorough analysis of participant data can provide insights that can be used to help make better decisions, such as deter- Educational Attainment Income Replacement Rate Less than High School 0.57 High School Graduate 0.64 Some College 0.71 College and above 0.90 Figure 7 Illustrated Effect of Educational Attainment on IRR The Role of Stakeholders in the Retirement Planning Process Plan Sponsors Plan Administrators • Understanding of post-retirement income replacement need. • Understanding factors impacting income replacement. • Identify IRR need for plan participants. • Customize retirement offering. • Offer customizable retirement products to sponsors based on participants’ IRR need. • Provide investment advice based on participants’ IRR need. Plan Participants Figure 8
- 5. cognizant 20-20 insights 5 mining the offering that will be the best fit for the participant. Products’ features can be designed based on analysis of the data. (See Figure 9). Plan sponsors should educate all employees about their IRR need and devise actionable strat- egies for improving plan participation rates. At the same time, retirement-planning companies need to help their end customers better predict and plan for their future financial needs. Robust data analytics can help organizations assure more effective retirement planning and stay ahead of the game in the next decade. Data Mining Components and Benefits Industry Data Encourage long and loyal employee service. Customized communication. Improve returns on the investments. Product features vs. plan performance. Plan fee management. Tailor healthcare plans. Analysis based on combination of domain knowledge and statistical techniques. Outcome of analysis for actionable information. Transactional Data Demographic Data Figure 9 References • Calculating Your Replacement Ratio. http://www.smart401k.com/Content/Education/Smart401k/ Home/retirement-strategy/calculate-replacement-ratio.aspx. • Income Replacement Ratios in Health and Retirement Study. http://www.ssa.gov/policy/docs/ssb/v72n3/v72n3p37.html. • Allen, Earle. Secret to a 401(K) Plan’s Success: The Income Replacement Ratio. http://www.shrm.org/hrdisciplines/benefits/articles/pages/replacementratio.aspx. • Hewitt, AON. 2012 Hot Topics in Retirement. http://www.aon.com/attachments/human-capital-con- sulting/2012_Hot_Topics_in_Retirement_highlights.pdf. • Scholz, John Carl and Ananth Seshadri. What Replacement Rates Should Households Use? http://www.mrrc.isr.umich.edu/publications/papers/pdf/wp214.pdf. • Principal Financial Group. Participant Savings Rates and Income Replacement Ratio. http://www. principal.com/businesses/planningcenter/employeebenefits/bestpractices/savings-rates-income- replace-ratios.htm. • Jack VanDerhei, Temple University and EBRI Fellow. Measuring Retirement Income Adequacy: Calculating Realistic Income Replacement Rates. http://www.researchgate.net/publication/6778381_ Measuring_retirement_income_adequacy_calculating_realistic_income_replacement_rates. • Cognizant Business Consulting. IRR Need Analysis Methodology.
- 6. About Cognizant Cognizant (NASDAQ: CTSH) is a leading provider of information technology, consulting, and business process out- sourcing services, dedicated to helping the world’s leading companies build stronger businesses. Headquartered in Teaneck, New Jersey (U.S.), Cognizant combines a passion for client satisfaction, technology innovation, deep industry and business process expertise, and a global, collaborative workforce that embodies the future of work. With over 50 delivery centers worldwide and approximately 171,400 employees as of December 31, 2013, Cognizant is a member of the NASDAQ-100, the S&P 500, the Forbes Global 2000, and the Fortune 500 and is ranked among the top performing and fastest growing companies in the world. Visit us online at www.cognizant.com or follow us on Twitter: Cognizant. World Headquarters 500 Frank W. Burr Blvd. Teaneck, NJ 07666 USA Phone: +1 201 801 0233 Fax: +1 201 801 0243 Toll Free: +1 888 937 3277 Email: inquiry@cognizant.com European Headquarters 1 Kingdom Street Paddington Central London W2 6BD Phone: +44 (0) 20 7297 7600 Fax: +44 (0) 20 7121 0102 Email: infouk@cognizant.com India Operations Headquarters #5/535, Old Mahabalipuram Road Okkiyam Pettai, Thoraipakkam Chennai, 600 096 India Phone: +91 (0) 44 4209 6000 Fax: +91 (0) 44 4209 6060 Email: inquiryindia@cognizant.com © Copyright 2014, Cognizant. All rights reserved. No part of this document may be reproduced, stored in a retrieval system, transmitted in any form or by any means, electronic, mechanical, photocopying, recording, or otherwise, without the express written permission from Cognizant. The information contained herein is subject to change without notice. All other trademarks mentioned herein are the property of their respective owners. About the Authors Krishnendu Saha is a Senior Consultant with Cognizant Business Consulting’s Banking and Financial Services Practice. Krishnendu has more than nine years of experience in leading business and IT engage- ments, primarily in the benefits administration and capital markets domains. He can be reached at Krishnendu.Saha@cognizant.com. Nishant Dev Arya is a Senior Consultant with Cognizant Business Consulting’s Banking and Financial Services Practice. Nishant has more than nine years of experience in leading business and IT engage- ments, primarily in the Cards and Payments and Asset Management domains. He can be reached at Nishant.Dev@cognizant.com. Jay Das is a Senior Manager with Cognizant Business Consulting’s Banking and Financial Services Practice. Jay has 13 years of experience in sectors such as oil and gas, BPO, retail banking, asset and wealth management, and risk management and compliance in financial services in both emerging markets and in the U.S. In financial services, Jay has worked on several consulting engagements at diversified asset and wealth management organizations in the U.S. He can be reached at Jayanta.Das2@cognizant.com. Glossary Plan sponsor: The plan sponsor is a designated party – usually a company or employer – that sets up a healthcare or retirement plan for the benefit of the organization’s employees. The responsibilities of the plan sponsor include determining membership parameters, selecting investment choices and, in some cases, providing contribution payments in the form of cash and/or stock. Plan administrator: The plan administrator ensures that money is being contributed to the fund, that the proper asset allocation decisions are made, and that payouts are promptly distributed among all qualified plan participants or beneficiaries. Plan participant: A plan participant either contributes to a pension plan or is in a position to receive benefit payments from the plan. Plan participants can include a retired person receiving distributions from a pension plan, a beneficiary, or a dependent named by a contributing member. Auto-enroll: This is the process of automatically enrolling participants in the plan, unless they choose not to participate. Plan match: This involves the employer matching some pre-defined part of the employee’s contribution to the retirement plan. Auto-increase: This is the process of automatically increasing the participant’s contribution by a pre- defined value every year.