Improving the Efficacy of Root Cause Analysis
•
1 gefällt mir•445 views

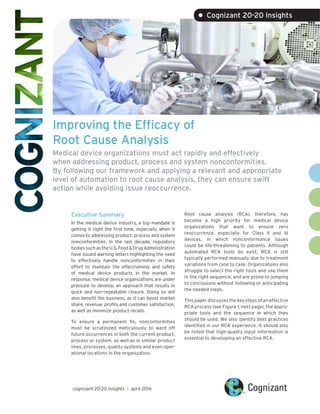
When medical device organizations apply a relevant and appropriate level of automation to root cause analysis, they can ensure swift action on nonconformities and avoid issue reoccurrence.

Empfohlen
Empfohlen
Weitere ähnliche Inhalte
Was ist angesagt?
Was ist angesagt? (20)
Andere mochten auch
Andere mochten auch (8)
Ähnlich wie Improving the Efficacy of Root Cause Analysis
Ähnlich wie Improving the Efficacy of Root Cause Analysis (20)
Mehr von Cognizant
Mehr von Cognizant (20)
Improving the Efficacy of Root Cause Analysis
- 1. Improving the Efficacy of Root Cause Analysis Medical device organizations must act rapidly and effectively when addressing product, process and system nonconformities. By following our framework and applying a relevant and appropriate level of automation to root cause analysis, they can ensure swift action while avoiding issue reoccurrence. Executive Summary In the medical device industry, a top mandate is getting it right the first time, especially when it comes to addressing product, process and system nonconformities. In the last decade, regulatory bodiessuchastheU.S.Food&DrugAdministration have issued warning letters highlighting the need to effectively handle nonconformities in their effort to maintain the effectiveness and safety of medical device products in the market. In response, medical device organizations are under pressure to develop an approach that results in quick and non-repeatable closure. Doing so will also benefit the business, as it can boost market share, revenue, profits and customer satisfaction, as well as minimize product recalls. To ensure a permanent fix, nonconformities must be scrutinized meticulously to ward off future occurrences in both the current product, process or system, as well as in similar product lines, processes, quality systems and even oper- ational locations in the organization. Root cause analysis (RCA), therefore, has become a high priority for medical device organizations that want to ensure zero reoccurrence, especially for Class II and III devices, in which nonconformance issues could be life-threatening to patients. Although automated RCA tools do exist, RCA is still typically performed manually due to treatment variations from case to case. Organizations also struggle to select the right tools and use them in the right sequence, and are prone to jumping to conclusions without following or anticipating the needed steps. This paper discusses the key steps of an effective RCA process (see Figure 1, next page), the appro- priate tools and the sequence in which they should be used. We also identify best practices identified in our RCA experience. It should also be noted that high-quality input information is essential to developing an effective RCA. cognizant 20-20 insights | april 2016 • Cognizant 20-20 Insights
- 2. cognizant 20-20 insights 2 Every medical device organization deals with non- conformities or problems (issues or complaints) that need to be acted upon quickly and effec- tively. The input sources of these problems can include customer complaints, returned products, in-house rejections, monitoring trends, noncon- formity reports, etc. Such inputs may or may not include sufficient information for performing an RCA; it’s vital for the team to gather complete and relevant information to build a strong foundation for successful analysis. At a very high level, nonconformities can be cat- egorized according to their level of severity, in terms of regulatory norms, risk to human life, brand reputation, customer demand, etc. (see Figure 2, next page). The problem statement should be framed in a way that answers the basic questions of what, when and where the loss in performance or nonconfor- mity was observed. Further, to avoid ambiguity, it should specify (when possible) the feature that has failed and the source of the specifica- tion (drawing, process sheet, etc.). For example, if the reason for a rejected component is “high thickness of parts,” then it can be recorded as, “Part thickness not within specified limits (5±1 mm) at supporting ribs, while being produced at Machine A in Q2, 2016.” Any tooling and other supporting details worth mentioning can also be included. This way, the RCA team will study both the chances of thickness being as high as 6 mm, as well as future possibilities of thickness lower than 4 mm. When stating the problem measurement response (i.e., the attribute or variable), attempts should be made to convert the attribute response into a variable response. When a problem seems to be a combination of two or more problems, oppor- tunities should be found to treat each of them as an individual stream for study. Statistical methods such as Pareto charts1 and histograms2 should be used, as applicable. At the problem clarification stage, it is important to understand what the source is saying but no need to explain the problem exhaustively. In fact, causes and suggestive actions should not be part of the problem statement. Grasping the Situation: The What, Not the Why When stating the problem, the RCA team should avoid asking “why” and instead begin gathering artifacts that help reveal the source of the problem. To do this, we recommend using the “3G” lean practices of gemba (the real place), gembutsu (the real thing) and genjitsu (the real The Process of Root Cause Analysis This diagram illustrates the key steps in an ideal RCA process, as well as the appropriate set of tools and optimal sequence of use. Figure 1 Clarify Problem Grasp Situation Collect Causes Cause Validation Cause Analysis Initial problem statement/perception “SMART” defined problem Locate stages where problem can occur and be detected Potential causes Possible causes Standardize Brainstorming, fishbone diagram, fault tree, relations diagram, Johari Window analysis Experimental testing, physical trials, risk analysis tools 5-Whys/1-How, SIPOC diagram, fishbone diagram Cause analysis tool, design of experiments approach, hypothesis testing, paired comparison, product/process search, affinity diagram, histogram, Pareto Effectiveness Verifications Actions Root Cause(s) Flow Narrowing Down to Root Cause Typical Tools 5-Whys Analysis Gemba, Gembutsu, Genjitsu Pareto, histogram, check sheets
- 3. cognizant 20-20 insights 3 data).3 This should be done as close as possible to the time of the problem occurrence, with the intent of collecting multiple observations from the actual site where the problem occurred. These artifacts and observations will form the quality inputs for the cause analysis step. The information (documents, machine and human remembrance) should be cross-checked for accuracy to eliminate perception or observation gaps. When possible, secondary sources should be checked to calibrate or verify reported and collected information. When information varies from source to source, such discrepancies should be noted as input for the next stage. When collecting the above observations, the team should plot SIPOC4 and process flow diagrams, and represent possible stages at which problems or nonconformance can occur, as well as the last stage it will get detected. This will help prioritize efforts and determine the scope of study. Figure 3 (next page) shows how drilling down into affected areas (the highlighted zone) for further investigation saves effort by eliminating non-rel- evant areas. Collecting Possible Causes Possible causes can emanate from multiple sources, including the actual details captured in the problem statement and situation observation. All the observed causes should be considered for the purpose of validation. Possible causes can also be identified by monitoring the problem from a wider viewpoint (different time spans, fault sources, locations, etc.) and identifying variations in these parameters. Significant variation should be considered as a con- tributor to the problem. In Figure 4 (next page), for example, data collected over a two-month obser- vation period clearly shows that all machines are creating cracked parts, meaning that no specific machine is causing the defect. Observing the crack zone variations, meanwhile, suggests the RCA team should further investigate what is leading to cracks at specific areas: the supporting ribs and screw holes. Possible causes could be found by comparing metallurgical differences, assembly processes, tooling used, etc. at each crack zone. Another fruitful way to collect possible causes is brainstorming by cross-functional teams (CFT). With this approach, it’s important to keep the focus on the quantity of causes rather than their quality. Everyone should be encouraged to think creatively, and all suggestions should be accepted without debate or criticism. By using a complete process flow diagram that shows all suspected sources of incoming variations for each process, the team can identify the sources considered as possible causes. When collecting causes, the team should ensure complete clarity to avoid later misinterpretation. Varying Levels of Issue Severity Figure 2 High Severity Examples Life or business risk Regulatory Customer complaints Threat to organization’s reputation Immediate corrective action needed May be top priority May not have all complaint details Problem occurrence out of reach Low Severity Examples Generated from trends Internal logs Selected for improvement Warranty returns Key CharacteristicsKey Characteristics Only immediate monitoring expected Many cases have historical data Many cases have all complaint details Problem occurrence reachable for trials
- 4. cognizant 20-20 insights 4 For example, rather than just saying “human error,” “malfunction” or “improper procedure,” the team should record the type of human error or malfunc- tion, or what was improper about the procedure. For causes related to methods, procedures, work instructions, statements of procedure, etc., the use of Johari Window analysis5 can help identify inadequacies, lack of adherence, communication gaps, training needs, etc. Techniques such as a preliminary hazard analysis (PHA),6 fault tree analysis (FTA)7 and hazard and operability studies (HAZOP)8 can also accelerate the generation of possible causes. Validating the Cause After exhausting all options for collecting possible causes, the RCA team should validate each possible cause that has a sufficient or justi- fiable sample size. The validation process must be chosen carefully to distinguish perceived causes from those that are potentially creating the problem or nonconformity. If reliable data exists to validate a cause, it should be added to the list of potential causes. The cause validation technique will vary based on factors like testing type (destructive vs. non- destructive), time required, amount of disruption to the existing setup, etc. It is usually carried out at the actual failure location or through its repre- sentative field exercise, using a lab setup and sta- tistical tools. Validation is performed by creating a situation in which the cause is acting at an out- of-specification value, keeping other contributing parameters constant. Using a SIPOC Diagram to Increase Efficiency Figure 3 Supplier Step 1 Step 2 Step 3 ........... Customer DETAILED PROCESS FLOW Shows greater detail (documents, inspections, re-work flows) FIRST-LEVEL PROCESS FLOW Shows higher level of process steps SIPOC Identifying Possible Causes by Observing Variations Figure 4 12 12 8 16 0 2 4 6 8 10 12 14 16 18 Machine A Machine B Machine C Machine D Number of cracked parts by machine (in 2 months) 22 15 2 1 0 5 10 15 20 25 Number of cracked parts per crack zone (in 2 months) At supporting ribs At screw holes At center of part At sharp corners
- 5. cognizant 20-20 insights 5 For example, when studying the failure of a short molding in a plastic component, the cross-func- tional team might identify causes such as a low injection temperature or low hydraulic pressure. In this scenario, the RCA team should conduct a validation that maintains injection temperature and hydraulic pressure (one at a time) at values lower than their specification limit, while ensuring other process parameters are kept constant. If the collected data shows short molding parts being produced under these conditions, then these can be seen as potential causes. The potential causes should then be checked in a hazard or risk analysis tool such as ReliaSoft’s xFMEA or HACCP.9 If the control set of any of the causes is strong, and the cause also shows very low occurrence, then those causes can be eliminated from further study, perhaps after verifying the adherence levels of those controls at the design or process level. Causes that exhibit poor control, high occurrence or no detection mechanism should be assigned high priority. In short, cross-checking with xFMEA or HACCP can help decide which causes should be prioritized or skipped in further studies. Analyzing the Cause Once a list of potential causes has been prepared, it’s time for analysis. A cause analysis tool (see Figure 5) can help determine whether a cause is properly defined for conducting a “5-Whys” analysis or needs to be revisited.10 If the potential cause lacks specification, or the speci- fication is poorly justified, the nonconformance issue may not be resolved. If a cause shows no variation in the collected data, the team can conclude that it’s not contributing to the nonconformity and can be eliminated from further study. Causes that are properly specified, are derived from a justified basis and show variation in the monitored data should be analyzed in further detail, as these factors are all prerequi- sites for carrying out the 5-Whys analysis. The cause analysis step uses multiple statistical tools to form conclusions with high confidence levels while minimizing guesses or dependence on expert advice. Use of Shainin problem-solv- ing techniques, such as product/process search, component search, paired comparison and full factorial experiments, will lead to a simplified way of concluding whether problems are caused by a process or component.11 Using the design of experiments (DOE) approach, meanwhile, will help narrow down parameters or mixes of parameters that are leading to nonconformance.12 Certain prerequisites should be considered, such as sufficient data volumes and tool applicability, based on the situation. The tools mentioned above should be used by individuals with the proper expertise, experience or guidance. When using templates or tools, their underlying assumptions and limitations should be understood. For example, a Pareto analysis is often applicable when all events or factors have occurred and exhibit low severity, and there’s a need to prioritize them (i.e., 80% of the problems are due to 20% of the causes). However, this approach is not recommended for causes, as they must be targeted for 100% elimi- nation. Cases of nonconformity with high severity may not be a case for Pareto. Using a Tool to Analyze Causes Cause analysis tools can help determine whether causes are properly defined for conducting a 5-Whys analysis. Figure 5 Is there a specification for the cause? Is there justifiable basis to derive the specification? Is the specification monitored? Is monitoring performed with an appropriate sampling plan? Is there any variation in monitored data? Action Plan No Derive specification Yes No Establish justifiable basis Yes Yes No Begin monitoring Yes Yes Yes No Derive appropriate sam- pling plan and begin moni- toring accordingly Yes Yes Yes Yes No This is not cause Yes Yes Yes Yes Yes Perform 5-Whys analysis on this cause
- 6. cognizant 20-20 insights 6 1 2 3 4 5 6 7 8 Effective zone to reach feasible root cause Number of Times “Why” Asked Action Effectiveness 5-Whys Analysis At this point, the team will have generated a set of causes that must go through a complete 5-Whys analysis to determine root cause (see Figure 6). When a cause or sub-cause has two or more sub-causes, the use of a legged 5-Whys analysis is encouraged (see Figure 7). This will avoid a force-fit or biased root cause determination. The best way to verify a 5-Whys exercise is to validate it in the reverse order of tracing causes for the problem under study. Most importantly, if “human error” is determined as the root cause during the 5-Whys analysis, the team should drill down further to identify the human causes for the error, such as unawareness or a difficult or cumbersome task. Figure 8 (next page) lists examples of deeper causes of human error. Human error causes, such as “forgot to perform” and “repetitive work,” may lead to actions such as process/operation automation, poka-yoke or Kaizen.13 Meanwhile, root causes such as “no procedure” or “lack of training” may lead to inef- 5-Whys Analysis Figure 6 Drilling Down into a 5-Whys Results Figure 7 Part missing in assembly Flash of lugs Why Why Why Why Why (Potential Cause) Problem Part fallen after fitment Difficult fitment Part not fitted Repetitive work Functional failure Forgot to fit Loose fitment of lugs
- 7. cognizant 20-20 insights 7 fective actions that are prone to problem reoc- currence (e.g., developing procedures, correcting procedures, training, visual aids, etc.). In these cases, the team needs to revisit the 5-Whys analysis to clearly understand the causes. Sometimes, actions derived in the 5-Whys exercise may appear to be feasible at more than one level of sub cause(s); in this case, actions should be diligently selected based on the optimal choice of the sub-cause, using a decision matrix. Once the true root causes are identified, multiple implementation actions could be identified (both corrective and preventive) to address each root cause. Completely addressing these root causes will eliminate nonconformance with a very high confidence of non-reoccurrence. Moving Forward RCA is a crucial point for effectively addressing nonconformities, especially through complaints and corrective and protection action. Both inputs to RCA and the RCA process need to be effective to arrive at actionable areas to be addressed. An RCA exercise is only as good as its inputs and follow-up actions. Even if an RCA is done effectively, the root causes must be thoroughly addressed to enable a holistic and non-repeatable closure of the original nonconformity through both corrective and preventive measures. Addi- tionally, the effectiveness of the actions must be verified with documentation. By improving the efficacy of the RCA process, medical device companies can significantly limit re-occurrences of the nonconformities. This helps save considerable effort, cost and time for addressing recalls and adverse events (if any), while retaining the active status of the product in the market for a longer timespan. This also means increased safety and trust for the product, with the potential to increase market share. Typically, a medical device company that observes or receives a warning about ineffective RCA needs to first assess its current state (as-is), followed by a plan for developing a to-be state by identifying gaps in the process, tools and meth- odologies utilized. We recommend performing these actions using a Six-Sigma approach. The level of modifications required to existing RCA process will depend on the gaps identified and could vary from organization to organization. It is also crucial to train relevant stakeholders on the modified RCA process. We also recommend verifying the effectiveness of the closure of root cause through both corrective and preventive measures. The methods, tools and techniques will vary from case to case, with the need for any one effectiveness verification action to be authenticated through one or different means. Effectiveness verification is the last gate for nonconformity closure and is typically audited by an experienced independent reviewer. Cognizant has the required expertise, framework of RCA process tools and techniques to perform efficient and effective RCA. Human Error Causes Figure 8 Lack of Knowledge Forgot Repetition of work Human error Difficulty
- 8. cognizant 20-20 insights 8 References • “Ten Most Common Reasons for FDA 483 Observations and Warning Letter Citations,” Master Control, Inc., http://images.vertmarkets.com/crlive/files/downloads/e1a9fcbc-2eb4-4835-a885-1e333314dca0/ white_paper_top_10_483.pdf. • Geoff Vorley, “Mini Guide to Root Cause Analysis,” Quality Management & Training Ltd., 2008, http:// www.root-cause-analysis.co.uk/images/Green%20RCA%20mini%20guide%20v5%20small.pdf. • “Guidance for Performing Root Cause Analysis with Performance Improvement Projects,” QAPI, https://www.cms.gov/medicare/provider-enrollment-and-certification/qapi/downloads/guidancefor- rca.pdf. • Mark Paradies, “7 Secrets of Root Cause Analysis,” TapRoot, Jan. 7, 2011, http://www.taproot.com/ archives/24425 • Bob Mehta, “CAPA and Complaints: Root Cause Investigation,” The Quality Management Forum, Vol. 40, No. 4, Winter 2015, http://www.mddionline.com/article/capa-and-complaints-ascertaining- root-cause. • Jamie Hartford, “CAPA and Complaints: Ascertaining Root Cause,” MDDI, Dec. 11, 2013, http://www. mddionline.com/article/capa-and-complaints-ascertaining-root-cause. • Dalgobind Mahto and Anjani Kumar, “Application of Root Cause Analysis in Improvement of Product Quality and Productivity,” Journal of Industrial Engineering and Management, Vol. 1, No. 2, 2008, http://www.jiem.org/index.php/jiem/article/view/3. • “Quality Management for Process Improvement,” Mahindra Institute of Quality. • Albert W. Wu, Angela K. M. Lipshutz, Peter J. Pronovost, “Effectiveness and Efficiency of Root Cause Analysis in Medicine,” The Journal of the American Medical Association, 2008, https://www.research- gate.net/publication/5582469_Effectiveness_and_efficiency_of_root_cause_analysis_in_medicine. Footnotes 1 A Pareto chart, also called a Pareto distribution diagram, is a vertical bar graph in which values are plotted in decreasing order of relative frequency from left to right. Pareto charts are extremely useful for analyzing which problems need attention first because the taller bars on the chart, which represent frequency, clearly illustrate which variables have the greatest cumulative effect on a given system. The Pareto chart provides a graphic depiction of the Pareto Principle, a theory maintaining that 80% of the output in a given situation or system is produced by 20% of the input. Source: Whatis.com, http:// whatis.techtarget.com/definition/Pareto-chart-Pareto-distribution-diagram. 2 A histogram is a graphical representation of the distribution of numerical data. Source: Wikipedia, https://en.wikipedia.org/wiki/Histogram. 3 The 3Gs are a fundamental element of continuous improvement. The concept is that by observing the actual process at the actual place, the team can base their decision on actual – not second-hand – facts. Source: Gembutsu Consulting, http://www.gembutsu.com/gemba_gembutsu_defined.html. 4 A SIPOC – or suppliers, inputs, processes, outputs, customers – diagram documents a business process from beginning to end, serving as a high-level process map. Source: TechTarget, http://searchcio.tech- target.com/definition/SIPOC-diagram-suppliers-inputs-process-outputs-customers. 5 The Johari Window is a communication model used to improve understanding between individuals. The word “Johari” is taken from the names of Joseph Luft and Harry Ingham, who developed the model in 1955. There are two key ideas behind the tool: That you can build trust with others by dis- closing information about yourself, and with the help of feedback from others, you can learn about yourself and come to terms with personal issues. Source: MindTools, https://www.mindtools.com/Com- mSkll/JohariWindow.htm.
- 9. cognizant 20-20 insights 9 6 Preliminary hazard analysis identifies system hazards, translates them into high-level system safety design constraints, assesses hazards and establishes a hazard log. Source: Safeware Engineering, http://www.safeware-eng.com/White_Papers/Preliminary%20Hazard%20Analysis.htm. 7 Fault tree analysis is a top-down, deductive failure analysis that uses Boolean logic to combine a series of lower level events. Source: Wikipedia, https://en.wikipedia.org/wiki/Fault_tree_analysis. 8 A HAZOP study is a structured and systematic examination of a planned or existing process or opera- tion, with the goal of identifying and evaluating problems that may represent risks or prevent efficient operation. Source: Wikipedia, https://en.wikipedia.org/wiki/Hazard_and_operability_study. 9 Hazard Analysis Critical Control Point (HACCP) is a management system in which food safety is addressed through the analysis and control of biological, chemical and physical hazards from raw material production, procurement and handling, to manufacturing, distribution and consumption of the finished product. Source: FDA, http://www.fda.gov/Food/GuidanceRegulation/HACCP/. 10 A 5-Whys analysis is a technique used in the “analyze” phase of the Six Sigma DMAIC (define, mea- sure, analyze, improve, control) methodology. By repeatedly asking the question “Why” (five is a good rule of thumb), you can peel away the layers of symptoms which can lead to the root cause of a problem. Source: iSixSigma, http://www.isixsigma.com/tools-templates/cause-effect/determine- root-cause-5-whys/. 11 Dorian Shainin was an American quality consultant and professor who developed a series of problem- solving techniques that have become the core of the Shainin System for quality and reliability improve- ment. Source: Wikipedia, https://en.wikipedia.org/wiki/Dorian_Shainin. 12 Design of experiments (DOE) is a systematic method for finding cause-and-effect relationships. Source: iSixSigma, http://www.isixsigma.com/tools-templates/design-of-experiments-doe/design-experi- ments-%E2%90%93-primer/. 13 Poka-yoke is a Japanese term that means mistake proofing. A poka-yoke device is one that prevents incorrect parts from being made or assembled, or easily identifies a flaw or error. Source: iSixSigma, http://www.isixsigma.com/dictionary/poka-yoke/. Kaizen is the practice of continuous improvement. Source: Kaizen Institute, https://www.kaizen.com/about-us/definition-of-kaizen.html.
- 10. About Cognizant Cognizant (NASDAQ: CTSH) is a leading provider of information technology, consulting, and business process outsourcing services, dedicated to helping the world’s leading companies build stronger business- es. Headquartered in Teaneck, New Jersey (U.S.), Cognizant combines a passion for client satisfaction, technology innovation, deep industry and business process expertise, and a global, collaborative work- force that embodies the future of work. With over 100 development and delivery centers worldwide and approximately 221,700 employees as of December 31, 2015, Cognizant is a member of the NASDAQ-100, the S&P 500, the Forbes Global 2000, and the Fortune 500 and is ranked among the top performing and fastest growing companies in the world. Visit us online at www.cognizant.com or follow us on Twitter: Cognizant. World Headquarters 500 Frank W. Burr Blvd. Teaneck, NJ 07666 USA Phone: +1 201 801 0233 Fax: +1 201 801 0243 Toll Free: +1 888 937 3277 Email: inquiry@cognizant.com European Headquarters 1 Kingdom Street Paddington Central London W2 6BD Phone: +44 (0) 20 7297 7600 Fax: +44 (0) 20 7121 0102 Email: infouk@cognizant.com India Operations Headquarters #5/535, Old Mahabalipuram Road Okkiyam Pettai, Thoraipakkam Chennai, 600 096 India Phone: +91 (0) 44 4209 6000 Fax: +91 (0) 44 4209 6060 Email: inquiryindia@cognizant.com © Copyright 2016, Cognizant. All rights reserved. No part of this document may be reproduced, stored in a retrieval system, transmitted in any form or by any means, electronic, mechanical, photocopying, recording, or otherwise, without the express written permission from Cognizant. The information contained herein is subject to change without notice. All other trademarks mentioned herein are the property of their respective owners. About the Authors Manoj Kadu is Senior Associate of Projects in Cognizant’s Product Engineering & Lifecycle Management Practice, with the Engineering and Manufacturing Solutions business unit. He has worked for more than nine years in the manufacturing industry, in manufacturing, quality and project management roles, spanning the automotive, agriculture/construction, vehicle and industrial machinery sectors. A certified Six Sigma Black Belt, Manoj is a mechanical engineering graduate from the University of Pune and earned his master’s degree in business administration (operations management) from IGNOU University. He can be reached at Manoj.Kadu@cognizant.com. Madan Unde is Senior Manager of Projects in Cognizant’s Product Engineering Practice, with the Engi- neering and Manufacturing Solutions Business Unit. He has over 13.5 years of experience in the engi- neering industry, working in both engineering OEMs and services organizations providing solutions to global OEMs. He has worked in multiple industries, including life sciences (medical devices), high-tech, industrial automation and machine tools, providing solutions across various technical areas, such as product design and development, innovation, continuous improvement, complaints investigation and resolution, CAPA management and product sustenance engineering. Madan has actively participated in and handled concept-to-commercialization of OEM products and has significant experience in technically managing complex engineering projects. A certified Six Sigma Black Belt Professional and Value Engineer- ing Associate Value Specialist, Madan is a mechanical engineering graduate and industrial engineering post-graduate, both from the University of Pune. He can be reached at Madan.Unde@cognizant.com. Codex 1806