Weitere ähnliche Inhalte
Ähnlich wie Inventory management & control (20)
Mehr von Anupam Kumar (20)
Kürzlich hochgeladen (20)
Inventory management & control
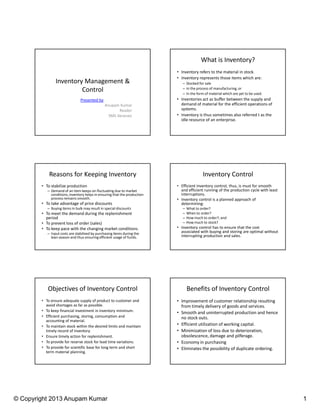
- 1. What is Inventory?
• Inventory refers to the material in stock.
• Inventory represents those items which are:
Inventory Management & – Stocked for sale
Control – In the process of manufacturing, or
– In the form of material which are yet to be used.
Presented by: • Inventories act as buffer between the supply and
Anupam Kumar demand of material for the efficient operations of
Reader systems.
SMS Varanasi • Inventory is thus sometimes also referred t as the
idle resource of an enterprise.
Reasons for Keeping Inventory Inventory Control
• To stabilize production • Efficient inventory control, thus, is must for smooth
– Demand of an item keeps on fluctuating due to market and efficient running of the production cycle with least
conditions, inventory helps in ensuring that the production interruptions.
process remains smooth. • Inventory control is a planned approach of
• To take advantage of price discounts determining:
– Buying items in bulk may result in special discounts – What to order?
• To meet the demand during the replenishment – When to order?
period – How much to order?; and
• To prevent loss of order (sales) – How much to stock?
• To keep pace with the changing market conditions. • Inventory control has to ensure that the cost
– Input costs are stabilized by purchasing items during the associated with buying and storing are optimal without
lean season and thus ensuring efficient usage of funds. interrupting production and sales.
Objectives of Inventory Control Benefits of Inventory Control
• To ensure adequate supply of product to customer and • Improvement of customer relationship resulting
avoid shortages as far as possible. from timely delivery of goods and services.
• To keep financial investment in inventory minimum. • Smooth and uninterrupted production and hence
• Efficient purchasing, storing, consumption and no stock outs.
accounting of material.
• To maintain stock within the desired limits and maintain • Efficient utilization of working capital.
timely record of inventory. • Minimization of loss due to deterioration,
• Ensure timely action for replenishment. obsolescence, damage and pilferage.
• To provide for reserve stock for lead time variations. • Economy in purchasing
• To provide for scientific base for long term and short • Eliminates the possibility of duplicate ordering.
term material planning.
© Copyright 2013 Anupam Kumar 1
- 2. Technique of Inventory Control ABC Analysis
• One of the most commonly used inventory • Applying the Pareto Principle to inventory
management and control.
control technique is the ABC analysis.
– Only a few items are responsible for the maximum impact
• ABC Analysis: on the inventory cost and thus the inventories should be
categorized as A, B and C.
– The ABC analysis is based on the principle of mal-
• In this analysis, the classification of existing inventory
distribution called the Pareto Principle.
is based on annual consumption and annual value of
• Pareto Principle: the items.
– “80% of the nations wealth is typically owned by • The ABC analysis may be applied to areas like stores
less than 20% of the population.” layout, evolving of reordering strategies, priority
treatment of items, value analysis, stock records, etc.
ABC Categorization Illustration No. 1
• A Category Items: • Perform ABC analysis on the following sample of
– These account for 10 – 20% of the item types which items in inventory.
are responsible for 60 – 80% of the total value of Items Demand Rate
items used.
A 300 10
• C Category Items: B 2800 15
– These have the minimum impact on the overall C 30 10
material cost and constitute almost 50 – 60% of the
types of items. However, the value of the items may D 1100 5
only constitute 5 – 10% of the total material. E 40 5
• B Category Items: F 220 100
– Those items which are left after the type A and type C G 150 5
items are categorized as type B. H 800 5
I 600 15
Soln.
J 80 10
Illustration No. 1 (Soln.) ABC Class Categorization
Rank Items Demand Rate Value Cum. Value %age Classificatio Type A Items Type B Items Type C Items
Value n Control and Monitoring High Moderate Minimum
1 B 2800 15 42000 42000 47.97% Value Consumption High Moderate Minimum
2 F 220 100 22000 64000 73.10% Top 60 - 80 % Order Size calculation Requirement Usage of Level of
3 I 600 15 9000 73000 83.38% estimation inventory inventory
4 D 1100 5 5500 78500 89.66% B Category Vendors Many 2 to 3 Usually 2
5 H 800 5 4000 82500 94.23% Receipt & Records Exhaustive Moderate Minimum
6 A 300 10 3000 85500 97.66% Lead time optimization Highly reqd. Moderately reqd. Minimum
7 J 80 10 800 86300 98.57% Bottom 5 - Scheduling Highly reqd. Less frequent Bulk ordering
8 G 150 5 750 87050 99.43% 10% Ordering Frequent Less frequent Bulk ordering
9 C 30 10 300 87350 99.77% Expediting Continuous Less frequent Bulk ordering
10 E 40 5 200 87550 100.00% Forecasting Accurate Moderate Approximate
Safety stock calculations 2 weeks 2 months Over 3 month
© Copyright 2013 Anupam Kumar 2
- 3. Inventory Control Fixed Period System or P System
• Inventory Control basically deals with two • In this system the inventories are checked at a
problems: fixed pre-determined period of time.
– When should an order be placed? (Order level) • After each review, the orders are invariably
placed, unless
– How much should be ordered? (Order quantity) – There has been no off take of the material during the
• These questions are answered by the use of period.
inventory models like EOQ. • The order size varies with the actual utilization of
material.
• The most prominent inventory models are:
• In case of high variation in demand, the level of
– Fixed Order Quantity Model (Q System) inventories fluctuate and the size of the order
– Fixed Period Model (P System) also vary considerably.
Limitation of P System Fixed Quantity System or Q System
• In the fixed period system as the inventories • In this system the size of the • This is to ensure that the
order is fixed but the time cost of keeping track of the
are checked only after a fixed pre-determined of ordering is allowed to items may not exceed the
period: vary depending upon the value of the items.
– Determination of review period becomes critical. actual usage of material. • The following factors are
• Order is placed once the important in the Q system:
– Long periods of slack in demand may lead to level of inventory reaches – Lead Time
carrying of large inventories. the pre-determined Re- – Order Size (Economic Order
– Processing of order during the low demand Order Level. Quantity)
• This method is used for – Safety Stock
periods may prove to be costly.
items of low unit value such – Expected Demand Rate.
– Economic Order Quantity is ignored.
as nuts, screws, nails, etc.
Relevant Costs in Inventory Control Economic Order Quantity
• Costs that encourage to • Cost that encourage • Economic Order Quantity is
have larger inventory: smaller inventory: that order quantity that
– Setup Cost or Ordering – Inventory carrying costs minimizes the total
Cost – Storage costs
– Procurement Cost inventory holding cost and
– Deterioration,
– Depreciation Cost obsolescence and pilferage ordering cost.
– Loss due to non-fulfillment • Cost which may increase
of demand and delay in or decrease with the size
production • Economic Order Quantity is
of inventory: the amount of inventory to
– Direct material and labour
cost – Handling Costs
be ordered at one time for
– Costs incurred on – Price Fluctuations
purposes of minimizing
overtime, hiring, training
and lay-offs. annual inventory cost.
© Copyright 2013 Anupam Kumar 3
- 4. EOQ (Derivation) Economic Order Quantity
• Total Cost = Procurement cost + Inventory Qoptimum = (2Cp*A/Cc)1/2 ; Derivation
carrying cost + Cost of material Total cost (optimum) = (2Cp* A * Cc)1/2 + A*C
Cp – Procurement Cost
• TC = Cp*(A/Q) + (Q/2)*Cc + A*C
A – Annual Demand
• d(TC)/d(Q) = - (Cp*A)/Q2 + (Cc / 2) + 0 Cc – Inventory Carrying Cost
• d(TC)/d(Q) = 0 C – Cost of material
⇒(Cc / 2) = (Cp*A)/Q2 • Assumptions:
⇒Qoptimum = (2 Cp*A/ Cc)^(1/2) – Consumption or usage of material is at a constant rate.
– Material would be supplied without fail with constant lead
⇒Toptimum = (2 Cp*A*Cc)^(1/2) + A*C
time.
Illustration No. 2 Illustration No. 2 (Soln.)
• A company requires annually 1200 Kgs of a chemical Cp = Rs. 22.50 Total Cost = 1423 + 300000
which costs Rs. 250 per kg. Placing each order costs A = 1200 Kg = 3,01,423
the company Rs. 22.50 and carrying cost is 15% of Cc = 15% of Rs. 250 ii. Maximum size of
the cost of the average inventory of the chemical per = Rs. 37.50 inventory = Safety Stock +
Economic Order Quantity
annum. Qoptimum = (2Cp*A/Cc)1/2
= 300 + 38 = 338 Kg
– Find the economic order quantity and total expense on the = (2* 22.50 *
capital. 1200 / 37.50)1/2 Average Inventory Size = Safety
Stock + (Economic Order
– If additionally the company decided to maintain a stock of = 38 Kg.
Quantity)/2
300 kgs, find the maximum as well as average inventory. Total cost = (2Cp* A * Cc)1/2
= 300 + 38/2 = 319 Kg
+ A*C
= (2 * 22.50 * 1200
Solution
*37.5)1/2 + 1200*250
Illustration No. 3 & 4 Illustration No. 5
• A Company uses annually 48000 units of a raw • A manufacturing company purchase 9000 parts of a
material costing Rs. 1.25 per unit. Placing each order machine for its annual requirements ordering for
costs Rs. 45 and carrying cost is 15% of the average month usage at a time, each part costs Rs. 20. The
inventory. Find the economic order quantity. ordering cost per order is Rs. 15 and carrying charges
• An oil engine manufacturer purchases lubricants at are 15% of the average inventory per year.
the rate of Rs. 42 per piece from a vendor. The • You have been assigned to suggest a more economic
requirement of these lubricants are 1800 per year. purchase policy for the company.
What should be the ordering quantity per order, if • What advice you offer and how much would it save
the cost per placement of an order is Rs. 16 and the company per year?
inventory carrying cost per rupee per year is 20
paise.
© Copyright 2013 Anupam Kumar 4