2. Page 2 of 20Kishore et al. SpringerPlus (2015) 4:775
of speckle noise (Touzi 2002; Dinh-Hoan Trinh et al. 2014; Sonia et al. 2012; Huang
and Xiaoping 2013). Lessening the effects of speckle at device and image level is exten-
sively researched. Device level improvements in the form of 3D (Fenster and Downey
2013) and 4D ultrasound scanners (Solberg et al. 2011) are available. These improve-
ments come at a cost that is unbearable by hospitals in poorer countries. Therefore,
cheaper alternatives for improving visually as a necessary post processing step for 2D
ultrasound images. These post processing steps include speckle noise removal, contrast
enhancement and edge preserving methods. Speckle noise results from multiple reflec-
tions of ultrasound waves from the hard tissues of the scanned human body. The nature
of speckle is multiplicative. Therefore difficult to model in real time, so inverse filter-
ing methods to remove noise may be effective. In the last decade, there were denois-
ing methods influenced by the fields of computer science, signal processing, probability
and artificial intelligence (Compas et al. 2014; Chernyakova and Eldar 2014; Zhang et al.
2010; Ng et al. 2006; Belaid et al. 2011). A set of algorithms under signal processing cat-
egory based on spatial and frequency domains improves visibility.
Spatial domain filtering techniques such as linear, adaptive linear filtering, adaptive
Wiener, median, anisotropic diffusion, constraint least mean squares and higher order
filtering applied for speckle reduction (Byram et al. 2013; Loizou et al. 2012; Gavriloaia
and Gavriloaia 2011; Christos and Constantinos 2008; Yeoh and Zhang 2006). These
algorithms did a great job on improving ultrasound images in early days of ultrasound
detections. The spatial domain filtering lessens noise inducing a blur to the objects in the
ultrasound images. Filter coefficient selection is a difficulty faced by these spatial filter-
ing algorithms.
Pixel based likelihood approaches (Zhang et al. 2007; Yu et al. 2012) such as Bayes
classifier Tao Hou et al. (2010) and Gaussian mixture models (GMM) (Gavriloaia and
Gavriloaia 2011) denoise algorithms set in the ultrasound scanner. Currently most real
time scanners around the world employ these algorithms. Computing the probability
density functions and joint probability density functions classify noisy pixels and object
pixels in ultrasound images. The probability based algorithms are a little low on accu-
racy. The denoised ultrasound images in the ultrasound machine still have noise. Their
effectiveness loses ground because of the speckle ingredient in ultrasound image varies
rapidly between successive images.
Other pixel processing method that revolutionized image processing is thresholding.
Thresholding reduces noise from medical ultrasound images by putting a constraint on
selection of correct threshold (Achim et al. 2001). However thresholding drops the vis-
ual quality of the objects in the image (Trinh et al. 2014). The worst hit parts are edges
of objects in the medical image. Edge detection and contrast enhancement are two
most popular thresholding methods used on images for visual quality improvement.
These processing algorithms suffer dearly when there is a slight difference in sensitivity
between pixel intensities of noise and edges (Shaimaa et al. 2012; Lee et al. 2012).
Frequency domain processing of ultrasound images involves filtering of speckle noise
in transformed domain (Andria et al. 2013; Wei et al. 2013, 2014). The wavelet trans-
form is exclusively used for speckle reduction. The multiresolution filter bank approach
frames computing fast 2D wavelet transform (Dantas and Costa 2007; Rabbani et al.
2008). Filter banks work well at reducing speckle in ultrasound medical images. There
3. Page 3 of 20Kishore et al. SpringerPlus (2015) 4:775
are quite a few problems associated with wavelet approaches such as decrease image
resolution at higher levels, choice of mother wavelet and loss of edge at higher levels of
decomposition (Esakkirajan et al. 2013). Different algorithms are proposed in literature
to overcome these effects in recent times showing little enhancements to visual qual-
ity (Adamo et al. 2013). Artificial intelligence methods such as artificial neural networks
(ANN) (Andria et al. 2012), fuzzy logic (Park and Nishimura 2007), genetic algorithms
(Zhang et al. 2010) and ant bee colony algorithm deal with the speckle intelligently
(Munteanu et al. 2008). ANN and Fuzzy need extensive training to perform the task
on larger data sets. These algorithms give better visual quality only when trained with
larger data sets. However, difficulties increase due to the continuously varying nature of
speckle in the medical image.
Finally, model based techniques are introduced to produce 3D ultrasound imag-
ing (Fenster and Downey 2013; Latifoglu 2013). This reduced the noise to large extent
improving the visibility of objects in the medical image. But these improvements come
at a higher price. For most of the poorer countries, it is a matter of affordability. Hence,
even though 3D ultrasound model based images is exclusively used in practice it is still
difficult to find in a country like India. Hence the speckle reduction in ultrasound medi-
cal images will be a major research area in the coming years.
This research paper proposes a novel two fold processing method to reduce the effect
of speckle in ultrasound medical images (Huang et al. 2009; Gao and Bui 2005; Rui et al.
2007; Yu et al. 2001). The proposed method calculates the wavelet coefficients from med-
ical image using a multiresolution filter bank approach. The coefficients scaling of ampli-
tude is soft and hard thresholding. Wavelet based object edge reconstruction on the
thresholded medical images by using fusion technique is proposed. The wavelet based
fusion acts as a value addition to thresholded images to restore the edges of objects in
the ultrasound image. This twofold algorithm reduces speckle noise and restores edge
quality for better and faster diagnostics by doctors. Verification of the proposed method
by doctors at AMMA Hospital, Vijayawada, INDIA and NRI Medical college Hospital,
Guntur, INDIA were initiated.
The rest of the paper is organizes as follows. “Twofold proposed technique” gives two-
fold technique using wavelet transform. “Results and discussion” discusses the results
of the proposed algorithm on ultrasound medical image of fetus obtained from AMMA
hospital Vijayawada. “Conclusion” compares the results from the proposed algorithm
with the results from standard denoising algorithms on medical images. Section 5 con-
cludes the proposed research based on experiments conducted in the previous sections.
Twofold proposed technique
The two fold technique proposed involves a twostep process in wavelet domain. First
step is block thresholding of ultrasound medical image wavelet coefficients followed by
fusion of thresholded image with the original image. Thresholding employs hard and
soft wavelet thresholding on detailed wavelet coefficients (Marsousi et al. 2013). Apart
from removing speckle they also blur the edges. The fusion in wavelet domain restores
lost edges of objects during the thresholding. Fusion also improves the contrast of the
denoised image. Here adaptive block fusion ensures correct fusion rule at a particu-
lar level preserves object properties such as edge and contrast. An ultrasound medical
4. Page 4 of 20Kishore et al. SpringerPlus (2015) 4:775
image U(x, y), where x, y ∈ Z† and U ∈ R† is convolved with a standard orthogonal 2D
filter coefficients f L
s1s2(x, y),where s1 and s2 ⊂ R† denote the scaling factors and L ⊂ Z† is
decomposition level to produce a 2D discrete wavelet transform having approximate and
detailed coefficients as in Eqs. (1) and (2).
The 2D DWT approximate coefficients for a 2D ultrasound signal U(x, y) is formulated as
And the detailed coefficients are formulated as
The wavelet decomposition level ‘L’ iterates breaking up the image into various frequency
surfaces. ‘l’ gives low frequency items of the filter and ‘h’ are the high frequency items of the
filter. Finally ‘b’ stands for block size.
The noise in the ultrasound images is found around a few wavelet coefficients. When
compared to wavelet object coefficients in the ultrasound image, they are present in
large coefficients. Edges mark the boundaries of objects in the image. Thresholding in
wavelet domain is making the smaller noise coefficients negligible and larger edge coef-
ficients important. Thresholding of wavelet coefficients reduces speckle noise. How-
ever this affects tissue edges that are objects in the denoised images. The edge appears
blurred making visually difficult to understand object boundaries.
Therefore global thresholding of wavelet coefficients results in edge loss of objects in
the image. Edge loss represents blurring of the edges and decrease in contrast of the
ultrasound image as a whole. This can be avoided to a certain extent using the block
based thresholding of wavelet coefficients. Block processing makes the thresholding
local to that particular block and preserving the contrast in the ultrasound images. Two
classes of thresholding algorithms are used to filter wavelet coefficients. They are Hard
Thresholding (HT) and Soft Thresholding (ST) as discussed below.
Block based hard thresholding (BHT)
Block based Hard Thresholding (BHT) is applied on detailed wavelet coefficients of
ultrasound image using the expression
where DL
bht contain the hard threshold wavelet coefficients at locations (i,j) at level.TL
bh is
the block threshold value for a particular block of size b = 1 × 2 where 1, 2 ∈ Z′, Z′
be any positive even number.TL
bh is computed for each block using the expression.
(1)AL
b =
b
i=1
Ui(x, y) × f IL
s1s2
(x, y)
(2)DL
b =
b
i=1
Ui(x, y) × f hL
s1s2
(x, y)
(3)DL
bht(i, j) =
Db(i, j) if |Db(i, j)| > TL
bh
0 if |Db(i, j)| ≤ TL
bh
(4)TL
bh =
1
i=1
2
j=1
DL
b(i, j)/M
5. Page 5 of 20Kishore et al. SpringerPlus (2015) 4:775
M is the maximum number of gray levels in the original image Ui(x, y).
Block based soft thresholding (BST)
Block based soft thresholding is defined according to, the soft threshold valueTL
bs in each
block is computed as
where M is the number of pixels in the image and ξ gives
ξ on detailed wavelet coefficients estimates to
Block based Soft thresholding (BST) on detailed wavelet coefficients using the equation
where DL
bst(i, j)are soft thresholded coefficients at level L at location (i,j).Where sgn(n) is
a signum function. The inverse transformation using the low pass and high pass recon-
struction filters results in a quality image U(d)(x, y). However, closer observation of
denoised images shows blocking artifacts at some locations on the image. This happens
when the block size b = 1 × 2, where 1, 2 ∈ Z′ , is small comparable to the size of
the original ultrasound image. Though thresholding in wavelet domain removes speckle
well with blurring of the region of interest objects.
The proposed solution for removing blocking artifacts and blurring of region of inter-
est objects comes from wavelet based fusion. Fusion in wavelet domain improves the
visual quality of the degraded images from multiple sources. The second technique is
fusion of the original ultrasound medical image and the denoised ultrasound image from
the first technique in wavelet domain.
The fusion aims to combine wavelet coefficients of block denoised US image U(d)(x, y)
with original ultrasound medical image U(x,y).The coefficients of different blocks fuse
together by selection of fusion rules and levels in wavelet for each block. Wavelet level
select and fusion type are selected based on the properties of object strength present in
the blocks. The object strength parameter is edge strength (Gao and Bui 2005) of each
denoised block.
Edge strength is most widely used in image processing to measure the quality edge
detection algorithms (Gao and Bui 2005). Here it measures the strength of edges in
the original US image which contribute towards object characteristics. Two D gradient
operator calculates the edge magnitude ǫ(x, y)and edge orientation θ(x, y) for each pixel
in the block. For the original ultrasound image U(x,y),it is defined as
(5)TL
bs = ξ 2log(m)
(6)ξA
b =
|median(Ub(x, y))|
0.6745
(7)ξD
b =
|median(DL
b)|
0.6745
(8)DL
bst(i, j) =
sgn(DL
b(i, j)) × (|DL
b(i, j)| − TL
bs) if |DL
b(i, j)| > TLD
bs
0 if |DL
b(i, j)| ≤ TLD
bs
(9)ǫb
(x, y) = gb
x (x, y)2 + gb
y (x, y)2
6. Page 6 of 20Kishore et al. SpringerPlus (2015) 4:775
where ǫb(x, y) and θb(x, y) provide edge information and edge orientation respectively of
each block b. gb
x (x, y) and gb
y (x, y) are block gradients along x and y directions. The next
step computes histogram of magnitude hb
gm(x, y)and orientation hb
gθ (x, y)for the original
ultrasound image. The histograms of gradient (Bhuiyan et al. 2009) blocks give the mag-
nitude and orientation of pixels marking edges of objects in the block.
Comparing the histograms of adjacent blocks magnitude and orientation will disclose
the presence of object. For comparison of gradient histograms a parameter called nor-
malized differential mean (NDM) is computed on the adjacent blocks. The expression
for NDM for two gradient magnitude histograms is
Nb(K,K+n)
ǫ and N
b(K,K+n)
θ denote the normalized differential means of gradient magni-
tude histogram and gradient orientation histogram between Kth and (K + n)th blocks
for each pixel i ∈ (b ⊆ 1, 2) within the block. The values Nb(K,K+n)
ǫ ,N
b(K,K+n)
θ ⊂ R2
belong to a set of positive real numbers between 0, 1. The extreme valve of 0 shown
no difference between the two adjacent blocks whereas orthogonality between blocks is
indicated the value of 1. The degree of object presence in a particular block is indicated
by a value close to 1.
Each block of original ultrasound image U(x,y) and denoised ultrasound image
U(d)(x, y) are fused at various levels and with different fusion rules based on the mag-
nitude and orientation values. The complete picture of the entire de-noising process is
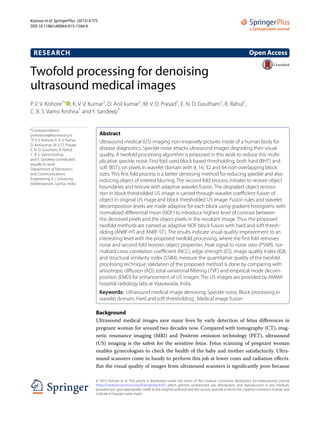
represented in the Fig. 1.
Adjacent blocks are checked to select the fusion level and fusion rule from a set of five
fusion levels and eight fusion rules in wavelet domain.
The five fusion levels are named as L1, L2, L3, L4 and L5. Fusion
rules select approximate and detailed wavelet coefficients for fusion
from their respective levels. Eight fusion rules are represented as
F(Amax,Dmax), F(Amin,Dmax), F(Amax,Dmin), F(Amin,Dmin), F(Aimg1,Dmax)
, F(Aimg1,Dmin)
, F(Aimg2,Dmax)
,
F(Aimg2,Dmin)
, F(Amax,Dmax)fusion rule selects approximate maximum coefficients and
detailed maximum coefficients from original ultrasound medical image U(x,y) and block
de-noised ultrasound medical image U(d)(x, y) with hard and soft thresholding in wave-
let domain. Remaining fusion rules are defined in literature (Di Huang et al. 2014) and
selected accordingly. The following fusion mechanisms are employed for various values
of Nb
ǫ and Nb
θ in the range of 0–1 between blocks
(10)and θb
(x, y) = tan−1
(
gb
y (x, y)
gb
x (x, y)
)
(11)N
b(K,K+n)
θ =
iǫb
|h
i(k)
gθ (x, y) − h
i(k+n)
gθ (x, y)|
||h
i(k)
gθ (x, y) + h
i(k+n)
gθ (x, y)||
(12)N
b(K,K+n)
θ =
iǫb
|h
i(k)
gθ (x, y) − h
i(k+n)
gθ (x, y)|
||h
i(k)
gθ (x, y) + h
i(k+n)
gθ (x, y)||
(13)[F(Aimg1,Dmax )
, L1] ⇐ 1 ≤ (Nb
ǫ , Nb
θ ) ≤ 0.955
7. Page 7 of 20Kishore et al. SpringerPlus (2015) 4:775
Inequalities 13 to 19 are the proposed new set of fusion rules based on selection of levels
and fusion rules. Figure 1 shows the astonishing improvement in ultrasound image qual-
ity by reducing the noise component in the image. From the Fig. 1 it can be observed
that the fused de-noised image U
(d)
f (x, y) is visually far superior quality compared to the
ultrasound images on the left of the Fig. 1, which are original ultrasound and thresh-
olded ultrasound images.
Testing of the proposed de-noising method to remove multiplicative speckle from the
onsite ultrasound medical images procured from AMMA hospital radiology depart-
ment. The fetus images are obtained in consultation with their doctors by agreeing upon
all legal matters as per the constitution of government of India
(14)[F(Aimg1,Dmin
)
, L1] ⇐ 0.954 ≤ (Nb
ǫ , Nb
θ ) ≤ 0.855
(15)[F(Aimg2,Dmax )
, L2] ⇐ 0.854 ≤ (Nb
ǫ , Nb
θ ) ≤ 0.755
(16)[F(Aimg2,Dmin
)
, L2] ⇐ 0.754 ≤ (Nb
ǫ , Nb
θ ) ≤ 0.655
(17)[F(Amin,Dmin
)
, L3] ⇐ 0.654 ≤ (Nb
ǫ , Nb
θ ) ≤ 0.555
(18)[F(Amin,Dmin
)
, L4] ⇐ 0.554 ≤ (Nb
ǫ , Nb
θ ) ≤ 0.455
(19)[F(Amin,Dmin
)
, L5] ⇐ 0.454 ≤ (Nb
ǫ , Nb
θ ) ≤ 0.001
Fig. 1 Proposed fusion process for level selection and rule selection for ultrasound medical image de-noising
in wavelet domain
8. Page 8 of 20Kishore et al. SpringerPlus (2015) 4:775
Results and discussion
Testing of the proposed method for speckle reduction on ultrasound medical images has
to be accomplished by measuring the visual excellence. The parameters that are trusted
with this job are peak signal to noise ratio (PSNR), normalized cross correlation coef-
ficient (NCC), edge strength, image quality index (IQI), and structural similarity index
(SSIM) (Yu et al. 2001; Lanzolla et al. 2011; Wang and Bovik 2002; Wang et al. 2004).
The following popular denoising algorithms from literature that are most likely used for
speckle reduction are anisotropic diffusion (AD) (Farias and Akamine 2012), Total Vari-
ational Filter (TVF) (Yoon et al. 2012) and Empirical mode decomposition (EMD) (Hu
and Jacob 2012). Our proposed algorithm is tested against these techniques both visually
and measurably.
For experimentation on ultrasound medical images are procured from two hospitals
in Vijayawada, Andhra Pradesh, India. They are AMMA hospitals and NRI medical col-
lege hospital. The doctors are consulted and legal agreements are signed as per Indian
constitution for sharing ultrasound fetal medical information. And more over doctors
helped in detecting and gauging the visual quality of the proposed method with remain-
ing filtering methods in extracting the information from the ultrasound scans. Time for
information extraction from filtered images is noted to find the importance of applying
this method for clinical application.
The images used for experimental testing of proposed speckle reduction technique are
fetus ultrasound images. These images contain fetus of women at various stages of preg-
nancy. A total of 4 ultrasound images are used for experimentation. These images are
generated by 4 ultrasound machines from Philips excited with 42Hz sonographic sound
and response imaging display of 13 cm as shown in Fig. 2. Images are converted from
machine specific imaging format to tagged image file format (tiff) with 8 bit sampling
rates. Images are normalized to standard resolution of 256 × 256.
The following block sizes of 8, 16, 32 and 64 divides the pixels into standard blocks.
DWT translates each block from spatial domain to wavelet domain. Hard Threshold-
ing (BHT) on detailed wavelet coefficients using the Eq. (4) gives adjusted coefficients.
The approximate coefficients show smooth variation and are hence un-thresholded. The
individual blocks having approximate and thresholded detailed components are inverse
transformed to spatial domain. Finally, concatenation of all the blocks gives a denoised
ultrasound spatial domain medical image. Only 8, 16, 32 and 64 blocks provided good
denoising for a standard 256 × 256 resolution image. Less than 8 and greater than 64
block size, consume processer time and with very little influence on the end result
respectively. Figure 3a, b show the result of denoised ultrasound fetus images of Fig. 2a,
b for a block size of 16.
Similarly, block soft thresholding (BST) reduces the speckle using eq’n (8) applied
of detailed coefficients of each block. Figure 3c, d provides results of soft threshold-
ing. Observing the resultant images in Fig. 3, show a smooth variation among pixels in
case of soft thresholding compared to hard thresholding. Compared with original US
images, visual improvement is noticeable in the resulting images. But, the trained doc-
tors at AMMA hospital did not show much of an interest in the images of Fig. 3. The
reason is blurring of objects of interest resulted due to higher thresholds of wavelet coef-
ficients and not much of a difference observed for lower thresholds. A suggestion from
9. Page 9 of 20Kishore et al. SpringerPlus (2015) 4:775
Fig. 2 a–d Fetus Ultrasound Images captured at radiology lab of AMMA hospital of various patients
Fig. 3 Processed US images of original images from 2(a)–2(d) using (a–d) Block Hard Thresholding with
block sizes 64,32,16 and 8, e–h Block Soft Thresholding with block sizes 64,32,16 and 8
10. Page 10 of 20Kishore et al. SpringerPlus (2015) 4:775
the practicing doctors of US imaging is to improve contrast between the object of inter-
est and the remaining portions of the image so that they can have better visual informa-
tion and can help faster detection. Their point was to high light the object of interest
region with less noise removal and smoothing the remaining portions resulting in a high
contrast US image. Hence the second fold processing on the block thresholded denoised
images is initiated.
In the second fold each block of denoised image in the first fold compares with 8 adja-
cent blocks to identify a valid edge and its orientation. Normalized differential means of
histogram gradient values selects the wavelet level and fusion rule. For the original ultra-
sound image in Fig. 2a we apply a 64 block denoising using soft thresholding technique
to obtain Fig. 3e in the first fold. The second fold begins with identifying edge containing
blocks from original US image in 2(a). In this the 256 × 256 is divided into 16 blocks of
each 64 × 64. Computing histogram of gradients on each 64 × 64 block and extracting
mean magnitude and mean orientations on adjacent blocks. The mean values are shown
in the Fig. 4 for as an example. Magnitude and angle mean of 1st 64 × 64 block and it’s
neighbors produces the values imprinted on left figure in Fig. 4. The first two horizon-
tal blocks compared in mean histogram gradient (Nb
ǫ , Nb
θ ) took values (0.483,0.322).
similarly for vertical and diagonal neighborhoods the values are (0.383,0.273) and
(0.983,0.273) respectively. These values help to detect the presence of edges in a block
and to restore these edges in that particular block from the original ultrasound image
through fusion. Fusion is performed in wavelet domain. The type of fusion and wavelet
decomposition level for fusion depend on the mean gradient histogram values.The rules
for fusion are as in eq’s 13-19. Eight fusion rules and 5 levels of decomposition are used.
Fig. 4 Fusion algorithm for developing denoised high contrast ultrasound images
11. Page 11 of 20Kishore et al. SpringerPlus (2015) 4:775
As in Fig. 4 the 1st 64 × 64 block does not have edges and hence select level 5 wavelet
decomposition (L = 5) with minimum value coefficients from approximate and detailed
components for fusion. From Fig. 4 it can be seen that the object of interest occupies
block (2, 2). The mean histogram values with neighboring blocks for this block are very
high (0.983, 0.958). The information seems important to the user and hence L = 1 and
approximate components from original Ultrasound image and maximum of details by
comparing both the original US and Denoised US images. It is clearly observable that
compared to denoised image the fusion based denoised image gives object of interest
clarity.
Here we show the visual clarity of the proposed two fold denoising against block
hard and soft thresholding for the image Fig. 2c. Object clarity in the denoised image
with high contrast helps detect and analyze the two fold denoised images in short time.
Figure 5 showing original US image in 5(a) from Fig. 2c, denoised image BHT in Fig. 5b,
BST in Fig. 5c, Adaptive fusion with HT (ANBF-HT) in Fig. 5d and Adaptive fusion with
ST (ANBF-ST) in Fig. 5e.
Visually the two fold denoised images preserve objects and show good contrast
between the object boundaries and the rest of the image. Figure 6 shows the denoising
methods for block sizes 32, 16 and 8.
Increasing non overlapping block size results in increasing contrast but introduces
blocking artifacts that tend to distract observations at high resolutions above 512 pix-
els. But at medium resolutions such as 256 × 256, blocking artifacts does not influence
Fig. 5 Comparison images of visual quality for block hard and soft thresholding and two fold processing
methods for a block size of 64 a Original US image from 2(c), b BHT, c BST, d Adaptive Fusion Hard Threshold-
ing (ANBF-HT), e Adaptive Fusion soft thresholding (ANBF-ST)
12. Page 12 of 20Kishore et al. SpringerPlus (2015) 4:775
quality. Table 1 show the fusion rules and levels for the image in Fig. 5. There will 16
blocks for a 256 × 256 US image. Table 1 gives the happenings on each block during
denoising.
Denoising quality of the US images can be best assessed using a set of calculations
known as denoising quality metrics. These are peak signal to noise ratio (PSNR), image
quality index (IQI), normalized cross correlation coefficient (NCC), edge strength (ES)
and structural similarity index (SSIM) as in (Rui et al. 2007; Yu et al. 2001; Marsousi et al.
2013). Metrics calculations on considered block sizes for all images of Fig. 2, gives values
in Table 2. Divisions in Table 2 show for 4 US images in Fig. 2 with 4 block sizes.
From the Table 2, a set of observations will decide on the performance of two fold
techniques used for enhancing US images. The observations of our interest are related
of speckle reduction given by psnr, edge preserving by ES and SSIM, relativity with
originality by NCC and contrast by IQI. Overall performance from the Table regard-
ing proposed method is within the acceptable measures according to ultrasound image
denoising research.
Figure 7 shows the PSNR in db for the test images in Fig. 2 for two fold processing with
hard thresholding (ANBF-HT) and soft thresholding (ANBF-ST).
From the plots in Fig. 7, PSNR for the proposed two fold techniques give mixed results.
The first two test images from Fig. 2a, b are from the same patient with a one minute
delay in image capture. In the graph of Fig. 7a there is a 100 % domination of ANBF-HT
and it gives good PSNR of around 40db at block sizes 8 and 16. For higher block sizes
PSNR falls, but under acceptable levels. Coming to Fig. 2b and its PSNR plot in Fig. 7b,
there is 50 % domination by the two methods ANBF-HT and ANBF-ST. But ANBF-HT
is a clear winner at higher block sizes.
The above results point towards the characteristics of speckle in real time ultrasound
imaging. The reason for variations in block sizes for hard and soft thresholding is in the
Table 1 Level and Fusion rule selection based in Eqs. (11–19) for the image in Fig. 4 using
ANBF-HT
Block no (Nb
ǫ , Nb
θ ) Level Fusion rule
1 0.181,0.102 5 F(Amin, Dmin)
2 0.399,0.322 5 F(Amin, Dmin)
3 0.229,0.213 5 F(Amin, Dmin)
4 0.182,0.101 5 F(Amin, Dmin)
5 0.976,0.979 1 F(Amin, Dmin)
6 0.958,0.950 1 F(Amin, Dmin)
7 0.949,0.922 2 F(Aimg1, Dmin)
8 0.637,0.620 3 F(Amin, Dmin)
9 0.425,0.433 5 F(Amin, Dmin)
10 0.543,0.521 4 F(Amin, Dmin)
11 0.523,0.532 4 F(Amin, Dmin)
12 0.282,0.221 5 F(Amin, Dmin)
13 0.388,0.342 5 F(Amin, Dmin)
14 0.422,0.431 5 F(Amin, Dmin)
15 0.412,0.412 5 F(Amin, Dmin)
16 0.199,0.195 5 F(Amin, Dmin)
13. Page 13 of 20Kishore et al. SpringerPlus (2015) 4:775
object structure in the US image. Figure 2a, b, d have good solid edge boundary com-
pared to Fig. 2c. As the two fold technique adaptively selects edge blocks for fusion, hard
threshold dominates for preserving sharp discontinuities. Figure 2c is having smooth
variation of pixels and hence the PSNR is dominant for soft thresholding (ANBF-ST) as
in Fig. 7c. Figure 8a–d provides plots of NCC, ES, IQI and SSIM for the proposed two
fold denoising methods.
NCC (Normalized Cross Correlation) is the figure telling the relativity of the denoised
image with original US image. Figures close to 1 indicate high correlation. Fig. 8a–d
shows a constant NCC value over the entire range of methods and block sizes. This
shows that the objects in image are intact after denoising. Edge Strength (ES) is increas-
ing with increase in block size. The reason this characteristic of ES is the presence of
thick edges in the original image occupying more than 8 or 16 pixels. IQI (Image Qual-
ity Index) falls with block size increase in all the cases and at times fluctuating rapidly
Table 2 Quality metrics for test images in Fig. 2 for two fold techniques for various block
US TEST IMAGES Fig. 2 PSNR NCC ES IQI SSIM
SOFT 81(S81) 25.7301 0.9604 0.5286 0.8303 0.7421
SOFT 82(S82) 33.6710 0.9335 0.5342 0.8287 0.7550
SOFT 83(S83) 28.0827 0.9186 0.8909 0.7659 0.6957
SOFT 84(S84) 23.2421 0.9526 0.5447 0.8615 0.7734
SOFT 161(S161) 31.5440 0.9638 0.6297 0.7742 0.7449
SOFT 162(S162) 32.5186 0.9406 0.6301 0.7822 0.7666
SOFT 163(S163) 40.1493 0.9302 0.9992 0.8414 0.8938
SOFT 164(S164) 22.7073 0.9535 0.6405 0.8022 0.7587
SOFT 321(S321) 25.4860 0.9734 0.8221 0.7058 0.7948
SOFT 322(S322) 31.3533 0.9578 0.8110 0.7113 0.8135
SOFT 323(S323) 33.1039 0.9476 0.9825 0.7177 0.7343
SOFT 324(S324) 25.2114 0.9605 0.8035 0.7157 0.7791
SOFT 641(S641) 30.3625 0.9788 0.9604 0.6544 0.7988
SOFT 642(S642) 39.5023 0.9814 0.8568 0.7480 0.9029
SOFT 643(S643) 30.1731 0.9489 0.9717 0.7089 0.7249
SOFT 644(S644) 38.5144 0.9742 0.8212 0.7365 0.8299
HARD 81(S81) 39.2534 0.9702 0.5146 0.8841 0.7983
HARD 82(S82) 30.4953 0.9452 0.5210 0.8811 0.8054
HARD 83(S83) 27.0829 0.9394 0.8403 0.8655 0.7741
HARD 84(S84) 29.9035 0.9604 0.5338 0.9164 0.8263
HARD 161(S161) 40.2058 0.9726 0.6144 0.8048 0.7962
HARD 162(S162) 30.6303 0.9520 0.6286 0.7955 0.7996
HARD 163(S163) 28.7951 0.9431 0.9561 0.8211 0.7722
HARD 164(S164) 34.4221 0.9665 0.6422 0.8422 0.8188
HARD 321(S321) 32.8812 0.9713 0.8286 0.6834 0.7855
HARD 322(S323) 28.8381 0.9510 0.8284 0.6810 0.7973
HARD 323(S324) 37.5740 0.9434 0.9934 0.7719 0.7752
HARD 324(S324) 33.4592 0.9658 0.8034 0.7441 0.8179
HARD 641(S641) 43.0055 0.9711 0.9187 0.6183 0.7809
HARD 642(S642) 28.5056 0.9566 0.9219 0.8497 0.9388
HARD 643(S643) 29.7116 0.9514 0.9383 0.8129 0.8125
HARD 644(S644) 29.7116 0.9616 0.9419 0.6863 0.8091
14. Page 14 of 20Kishore et al. SpringerPlus (2015) 4:775
Fig. 6 32,16 and 8 block Comparison images having columns a BHT , b BST, c Adaptive Fusion Hard Thresh-
olding (ANBF-HT), d Adaptive Fusion soft thresholding (ANBF-ST)
Fig. 7 PSNR in db for the test images from Fig. 2 using two fold methods i.e. ANBF-HT and ANBF-ST for block
sizes 8, 16, 32 and 64
15. Page 15 of 20Kishore et al. SpringerPlus (2015) 4:775
between blocks and thresholds as in Fig. 8c. Except for Fig. 8c, SSIM is fairly constant.
Figure 2c has smooth edges which are difficult to structure out from the object and
hence good SSIM.
All in all the parameters show the proposed methods for denoising retains most of the
object characteristics removing speckle, thereby improving visual contrast preserving
object boundaries.
The most famous denoising algorithms of recent times for ultrasound image denoising
are Anisotropic Diffusion (AD) and Total Variational Filtering (TVF). Also included a
recently proved technique for denoising is Empirical Mode Decomposition (EMD).
Let us compare our proposed algorithm with these already proved techniques for
denoising. The only drawback these methods face are from their dependence on gradient
and number of iterations to reach the gradient image to preserve edges while denoising.
Figures 9 and 10 are competitive images of the proved techniques AD, TVF and EMD
with the proposed two fold techniques ANBF-HT with block size 16 and ANBF-ST with
block size 8, for two test images in Fig. 2a, c.
From the visual perception of doctors at AMMA hospitals by seeing Figs. 9 and 10,
they think our two fold proposed method clearly dominates the lot. The only case where
they disagreed is on Fig. 9e which shows blocking artifacts due to lower block sizes.
Higher block sizes avoid these artifacts. But the images are high in contrast to recognize
objects in the image.
The other three methods performed well to remove speckle but the quality of bounda-
ries of objects in the images are poor, except for the TVF method. Checking for quality
metrics to ascertain the superiority of denoising methods for US test images of Fig. 2.
Fig. 8 Plots of NCC, ES, IQI and SSIM for Test images in Fig. 2
16. Page 16 of 20Kishore et al. SpringerPlus (2015) 4:775
Fig. 9 Test image from Fig. 2a denoised using a Anisotropic Diffusion with 40 iterations, b Total variational
Filtering (TVF) with 50 iterations, c Empirical Mode Decomposition (EMD) with 5 Modes, d Adaptive Normal-
ized Diffusion Mean Block Fusion-HT (ANBF-HT) with block size 16, e Adaptive Normalized Diffusion Mean
Block Fusion-ST (ANBF-ST) with block size 8
Fig. 10 Test image from Fig. 2c denoised using a Anisotropic Diffusion with 44 iterations, b Total variational
Filtering (TVF) with 65 iterations, c Empirical Mode Decomposition (EMD) with 5 Modes, d Adaptive Normal-
ized Diffusion Mean Block Fusion-HT (ANBF-HT) with block size 32, e Adaptive Normalized Diffusion Mean
Block Fusion-ST (ANBF-ST) with block size 16
17. Page 17 of 20Kishore et al. SpringerPlus (2015) 4:775
Calculating and plotting the metrics for the proposed methods (ANBF-HT and ANBF-
ST with 4 block sizes each) against AD, TVF and EMD. Plot in Fig. 11 is a range plot
showing the range of values on y-axis and the denoising methods on x-axis.
Figure 11a has PSNR distributions on the test images in Fig. 2 for proposed two fold
techniques and the standard US denoising methods. The two fold methods lost it on
PSNR compared to anisotropic diffusion (AD). Two fold techniques are showing better
PSNR with respect to TVF and EMD. Figure 11b–e plots of NCC, ES, IQI and SSIM for
individual test images. Close observations of the plots reveal the two fold techniques
object boundary preservation compared to other models. Total variational filtering is the
only method that protects object boundaries during denoising.
Fig. 11 Comparative Quality metrics for various denoising algorithms a PSNR in db, b NCC, c ES, d IQI and e
SSIM
18. Page 18 of 20Kishore et al. SpringerPlus (2015) 4:775
The biggest drawback of AD, TVF and EMD is their iterative nature with in turn adds
to execution time. MATLAB 13a is the programming language for achieving the goal.
The machine is a HP laptop with i3 processor having a support RAM of 3GB. Finally
comparisons on the execution time of each of the codes in MATLAB on the specified
machine are given in Fig .12. These execution times are machine specific.
From Fig. 12, block size 8 based denoising methods with either HT or ST executes
for 82 s. Block 16, block 32 and block 64 execute for an average of 40 sec, 20 sec and 9
sec respectively. AD and TVF are iterative gradient dependent methods and hence took
88 and 98 s for 40 iterations. Good denoised US images are generated by having a large
number of iterations, which in turn slows the execution process. Same is the case with
EMD.
Conclusion
This paper proposes a twofold processing algorithm to reduce multiplicative speckle
noise in ultrasound medical images for better visual quality. First fold reduces noise with
wavelet block based thresholding, which affects image object boundaries and texture,
thereby reducing the visual quality of objects in the image. The second fold restores
object boundaries and texture from original ultrasound image through wavelet block
fusion. Fusion rules and wavelet decomposition level selection between blocks of orig-
inal US and threshold denoised US image is achieved using gradient histogram based
Normalized Differential Mean (NDM) valve for adjacent blocks. Object blocks having
boundary and texture are restored at lowest level from original US image and non-object
regions from thresholded US image from the first fold. Hard and soft wavelet threshold-
ing methods are incorporated in the first fold. The two fold methods are Adaptive Nor-
malized Diffusion Mean Block Fusion - Hard Thresholding (ANBF-HT) and Adaptive
Normalized Diffusion Mean Block Fusion - Soft Thresholding (ANBF-ST) for different
block sizes. Four different block sizes are selected for testing such as 8, 16, 32 and 64 for
both thresholding and fusion. The results are encouraging for clinical application, when
Fig. 12 Execution times of denoising methods
19. Page 19 of 20Kishore et al. SpringerPlus (2015) 4:775
compared to other popular methods. Quality metrics show a high degree of relativity
with existing proven techniques for ultrasound image denoising such as anisotropic dif-
fusion, total variational filtering and empirical mode decomposition.
Authors’contributions
Substantial contributions to the conception or design of the work, ideas, theory formulation and mathematical analysis
PVVK. The Ultrasound Image Acquisition KVVK. First fold analysis—MVDP, KVVK, DAK, RR. Second fold analysis—KVVK,
CBSVK, EGD, YS. Result formulations—Dr. PVVK. Testing and plotting—KVVK, MVDP, DAK Interpretation of data for
work—PVVK. Drafting the work and revising it critically for important intellectual content—Dr. PVVK. All authors read and
approved the final manuscript.
Acknowledgements
We thank Amma Hospital radiology department for providing Ultrasound images for analysis and helping in determin-
ing the quality of processed images for evaluation.
Competing interests
The authors declare that they have no competing interests.
Received: 13 October 2015 Accepted: 26 November 2015
References
Achim A, Bezerianos A, Tsakalides P (2001) Novel Bayesian multiscale method for speckle removal in medical ultrasound
images. IEEE Trans Med Imag 20(8):772–783
Adamo F, Andria G, Attivissimo F, Lanzolla Anna Maria Lucia, Spadavecchia Maurizio (2013) A comparative study on
mother wavelet selection in ultrasound image denoising. Measurement 46(8):2447–2456
Andria G, Attivissimo F, Cavone G, Giaquinto N, Lanzolla AML (2012) Linear filtering of 2-D wavelet coefficients for denois-
ing ultrasound medical images. Measurement 45(7):1792–1800
Andria G, Attivissimo F, Lanzolla AML, Savino M (2013) A Suitable threshold for speckle reduction in ultrasound images.
IEEE Trans Instrument Measurem 62(8):2270–2279
Belaid A, Boukerroui D, Maingourd Y, Lerallut J-F (2011) Phase-based level set segmentation of ultrasound images. IEEE
Trans InformTechnol Biomed 15(1):138–147
Bhuiyan MIH, Ahmad MO, Swamy MNS (2009) Spatially adaptive thresholding in wavelet domain for despeckling of
ultrasound images. Image Process IET 3(3):147–162
Byram B, Trahey GE, Palmeri M (2013) Bayesian speckle tracking. Part II: biased ultrasound displacement estimation. IEEE
Trans Ultrason Ferroelect Freq Control 6(1)
Chernyakova T, Eldar Y (2014) Fourier-domain beamforming: the path to compressed ultrasound imaging. IEEE Trans
Ultrason Ferroelect Freq Control 61(8):1252–1267
Compas CB, Wong EY, Huang X, Sampath S, Lin BA, Pal P, Papademetris X, Thiele K, Dione DP, Stacy M, Staib LH, Sinusas AJ,
O’Donnell M, Duncan JS (2014) Radial basis functions for combining shape and speckle tracking in 4D echocardiog-
raphy. IEEE Trans Med Imag 33(6):1275–1289
Dantas RG, Costa ET (2007) Ultrasound speckle reduction using modified gabor filters. IEEE Trans Ultrason Ferroelectr
Freq Control 54(3):530–538
El-said SA, Azar AT (2012) Speckles Suppression Techniques for Ultrasound Images. J Med Imag Rad Sci 43(4):200–213
Esakkirajan S, Chinna TV, Rashad M, Ganapathi S (2013) Adaptive wavelet packet-based de-speckling of ultrasound
images with bilateral filter, Original Research Article. Ultrasound Med Biol 39(12):2463–2476
Farias MCQ, Akamine WYL (2012) On performance of image quality metrics enhanced with visual attention computa-
tional models. Electronics Lett 48(11):631–633
Fenster A, Downey DB (2013) 3-D ultrasound imaging: a review. IEEE Eng Med Biol Mag 15(6):41–51
Gao S, Bui TD (2005) Image segmentation and selective smoothing by using Mumford-Shah model. IEEE Trans Image
Process 14(10):1537–1549
Gavriloaia G, Gavriloaia R (2011) Spatiotemporal filtering for ultrasound images. In: 2011 4th International Conference on
Biomedical Engineering and Informatics (BMEI), vol. 1, 15–17 Oct. 2011, pp 502–505
Hu Y, Jacob M (2012) Higher degree total variation (HDTV) regularization for image recovery. IEEE Trans Image Process
21(5):2559–2571
Huang Q, Zheng Y, Minhua Lu, Wang Tianfu, Chen Siping (2009) A new adaptive interpolation algorithm for 3D ultra-
sound imaging with speckle reduction and edge preservation. Comp Med Imag Graph 33(2):100–110
Huang Di, Zhu Chao, Wang Yunhong, Chen Liming (2014) HSOG: a novel local image descriptor based on histograms of
the second-order gradients. IEEE Trans Image Process 23(11):4680–4695
Huang J, Yang X (2013) Fast reduction of speckle noise in real ultrasound images. Signal Processing 93(4):684–694 (ISSN
0165-1684)
Lanzolla AML, Cavone G, Savino M, Spadavecchia M (2011) Analysis of influence parameters on image quality in ultra-
sound examination. In: Proceeedings of MeMeA, Bari, Italy, pp 238–240
Latifoglu F (2013) A novel approach to speckle noise filtering based on Artificial Bee Colony algorithm: an ultrasound
image application. Comp Methods Programs Biomed 111(3):561–569
20. Page 20 of 20Kishore et al. SpringerPlus (2015) 4:775
Lee M-S, Yen C-L, Ueng S-K (2012) Speckle reduction with edges preservation for ultrasound images: using function
spaces approach. Image Process IET 6(7):813–821
Loizou CP, Kasparis T, Christodoulides P, Theofanous C, Pantziaris M, Kyriakou E, Pattichis CS (2012) Despeckle filtering in
ultrasound video of the common carotid artery. In: 2012 IEEE 12th International Conference on Bioinformatics and
Bioengineering (BIBE), 11–13 Nov. 2012, pp 721–726
Loizou CP, Pattichis CS (2008) Despeckle Filtering Algorithms and Software for Ultrasound Imaging. Synthesis Lectures on
Algorithms and Software in Engineering 2008, pp 1–166
Marsousi M, Plataniotis K, Stergiopoulos S (2013) A multi-steps segmentation approach for 3D ultrasound images using
the combination of 3D-Snake and Level-Set. In: 2013 18th International Conference on Digital Signal Processing
(DSP), 1–3 July 2013, pp 1–4
Munteanu C, Morales FC, Ruiz-Alzola J (2008) Speckle reduction through interactive evolution of a general order statistics
filter for clinical ultrasound imaging. IEEE Trans Biomed Eng 55(1):365–369
Ng J, Prager R, Kingsbury N, Treece G, Gee A (2006) Modeling ultrasound imaging as a linear, shift-variant system. IEEE
Trans Ultrason Ferroelectr Freq Control 53(3):549–563
Ortiz SHC, Chiu T, Fox MD (2012) Ultrasound image enhancement: a review. Article Biomed Signal Processing Control
7(5):419–428
Park H, Nishimura T (2007) Reduced Speckle noise on Medical Ultrasound Images Using Cellular Neural Network. In:
9th Annual International Conference of the IEEE Engineering in Medicine and Biology Society, 2007. EMBS 2007. 2,
22–26 Aug. 2007, pp 2138–2141
Rabbani H, Vafadust M, Abolmaesumi P, Gazor S (2008) Speckle noise reduction of medical ultrasound images in complex
wavelet domain using Mixture priors. IEEE Trans Biomed Eng 55(9):2152–2160
Rui W, Jiangli L, Deyu L, Tianfu W (2007) Edge Enhancement and Filtering of Medical Ultrasonic Images Using a Hybrid
Method. In: The 1st International Conference on Bioinformatics and Biomedical Engineering, 2007. ICBBE 2007, pp
876–879
Solberg OV, Lindseth F, EirikBø L, Muller S, Lervik Bakeng JB, Tangen GA, Toril A, Nagelhus Hernes (2011) 3D ultrasound
reconstruction algorithms from analog and digital data. Ultrasonics 51(4):405-419 (ISSN 0041-624X)
Tao Hou, Yuanyuan Wang, Yi Guo (2010) Despeckling Medical Ultrasound Images Based on Blind Deconvolution and
Maximum-Likelihood Estimation. In: 2010 4th International Conference on Bioinformatics and Biomedical Engineer-
ing (iCBBE). pp1–4, 18–20 June 2010
Touzi R (2002) A review of speckle filtering in the context of estimation theory. IEEE Trans Geosci Remote Sens
40(11):2392–2404
Trinh DH, Luong M, Dibos F, Rocchisani JM, Pham CD, Nguyen TQ (2014) Novel example-based method for super-resolu-
tion and denoising of medical images. IEEE Trans Image Process 23(4):1882–1895
Wang Z, Bovik AC (2002) A universal image quality index. IEEE Signal Process Lett 9(3):81–84
Wang Z, Bovik AC, Sheikh HR, Simoncelli EP (2004) Image quality assessment: from error visibility to structural similarity.
IEEE Trans Image Process 13(4):600–612
Wei et al. (2013) Sampling reconstruction of N-dimensional bandlimited images after multilinear filtering in fractional
Fourier domain. Optics Communica 295:26–35
Wei et al. (2014) Reconstruction of multidimensional bandlimited signals from multichannel samples in the linear canoni-
cal transform domain. IET Signal Processing 8(6):647–657
Yeoh WS, Zang C (2006) Constrained least squares filtering algorithm for ultrasound image deconvolution. IEEE Trans
Biomed Eng 53(10):2001–2007
Yoon C, Seo H, Lee Y, Yoo Y, Song TK, Chang JH (2012) Optimal sound speed estimation using modified nonlinear ani-
sotropic diffusion to improve spatial resolution in ultrasound imaging. IEEE Trans Ultrason Ferroelectr Freq Control
59(5):905–914
Yu L, Zu D, Wang W, Bao S (2001) Multi-modality medical image fusion based on wavelet analysis and quality evaluation.
J Syst Eng Electron 12(1):42–48
Yu L, Zu D, Wang W, Bao S (2001) Multi-modality medical image fusion based on wavelet analysis and quality evaluation.
J Syst Eng Electron 12(1):42–48
Yu J, Hou T, Guo Y, Wang Y (2012) Despeckling medical ultrasound image based on spatially adaptive maximum-likeli-
hood estimation. In: 2012 International Conference on Audio, Language and Image Processing (ICALIP), 16–18 July
2012
Zhang Yingtao, Cheng HD, Tian Jiawei, Huang Jianhua, Tang Xianglong (2010) Fractional subpixel diffusion and fuzzy
logic approach for ultrasound speckle reduction. Pat Recogn 43(8):2962–2970
Zhang Y, Cheng HD, Tian J, Huang J, Tang X (2010) Fractional subpixel diffusion and fuzzy logic approach for ultrasound
speckle reduction. Pat Recogn 43(8):2962–2970
Zhang F, Yang MY, Koh LM, Kim Y (2007) Nonlinear diffusion in Laplacian pyramid domain for ultrasonic speckle reduc-
tion. IEEE Trans Med Imaging 26(2):200–211