Tilapia Growth Performance in Small-Volume Floating Cages
•
3 gefällt mir•967 views

Tilapia Growth Performance in Small-Volume Floating Cages

Empfohlen
Empfohlen
Weitere ähnliche Inhalte
Was ist angesagt?
Was ist angesagt? (20)
Andere mochten auch
Andere mochten auch (20)
Ähnlich wie Tilapia Growth Performance in Small-Volume Floating Cages
Ähnlich wie Tilapia Growth Performance in Small-Volume Floating Cages (20)
Mehr von Alberto Nunes
Mehr von Alberto Nunes (8)
Kürzlich hochgeladen
Kürzlich hochgeladen (20)
Tilapia Growth Performance in Small-Volume Floating Cages
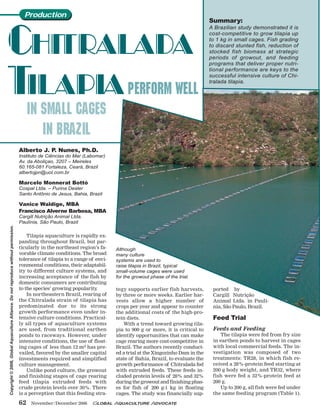
- 1. 62 November/December 2006 GLOBAL AQUACULTURE ADVOCATE Alberto J. P. Nunes, Ph.D. Instituto de Ciências do Mar (Labomar) Av. da Aboliçao, 3207 – Meireles 60.165-081 Fortaleza, Ceará, Brazil albertojpn@uol.com.br Marcelo Monnerat Bottó Cospal Ltda. – Purina Dealer Santo Antônio de Jesus, Bahia, Brazil Vanice Waldige, MBA Francisco Alverne Barbosa, MBA Cargill Nutrição Animal Ltda. Paulínia, São Paulo, Brazil Tilapia aquaculture is rapidly ex- panding throughout Brazil, but par- ticularly in the northeast region’s fa- vorable climate conditions. The broad tolerance of tilapia to a range of envi- ronmental conditions, their adaptabil- ity to different culture systems, and increasing acceptance of the fish by domestic consumers are contributing to the species’ growing popularity. In northeastern Brazil, rearing of the Chitralada strain of tilapia has predominated due to its strong growth performance even under in- tensive culture conditions. Practical- ly all types of aquaculture systems are used, from traditional earthen ponds to raceways. However, under intensive conditions, the use of float- ing cages of less than 12 m3 has pre- vailed, favored by the smaller capital investments required and simplified culture management. Unlike pond culture, the growout and finishing stages of cage rearing feed tilapia extruded feeds with crude protein levels over 30%. There is a perception that this feeding stra- tegy supports earlier fish harvests, by three or more weeks. Earlier har- vests allow a higher number of crops per year and appear to counter the additional costs of the high-pro- tein diets. With a trend toward growing tila- pia to 900 g or more, it is critical to identify opportunities that can make cage rearing more cost-competitive in Brazil. The authors recently conduct- ed a trial at the Xingozinho Dam in the state of Bahia, Brazil, to evaluate the growth performance of Chitralada fed with extruded feeds. These feeds in- cluded protein levels of 28% and 32% during the growout and finishing phas- es for fish of 200 g-1 kg in floating cages. The study was financially sup- ported by Cargill Nutrição Animal Ltda. in Paulí- nia, São Paulo, Brazil. Feed Trial Feeds and Feeding The tilapia were fed from fry size in earthen ponds to harvest in cages with local commercial feeds. The in- vestigation was composed of two treatments: TR28, in which fish re- ceived a 28%-protein feed starting at 200 g body weight, and TR32, where fish were fed a 32%-protein feed at 200 g. Up to 200 g, all fish were fed under the same feeding program (Table 1). Although many culture systems are used to raise tilapia in Brazil, typical small-volume cages were used for the growout phase of the trial. Chitralada TilapiaPerform Well In Small Cages In Brazil Summary: A Brazilian study demonstrated it is cost-competitive to grow tilapia up to 1 kg in small cages. Fish grading to discard stunted fish, reduction of stocked fish biomass at strategic periods of growout, and feeding programs that deliver proper nutri- tional performance are keys to the successful intensive culture of Chi- tralada tilapia. Production Copyright©2006,GlobalAquacultureAlliance.Donotreproducewithoutpermission.
- 2. GLOBAL AQUACULTURE ADVOCATE November/December 2006 63 Feeding times and the number of ra- tions per day were kept the same for both treatments over the complete rearing cycle. Extruded feed was al- ways delivered in feeding rings, with rations quantities adjusted weekly after fish weighing. Stocking and Grading A total of 30,000 Chitralada fry of 1.3- to 1.7-g weight were acquired lo- cally. Prior to stocking in cages, the animals were sex reversed in hapa mesh enclosures set up in an earthen pond. The study began by stocking 18,000 animals in three 4-m3 net pens of 5 mm mesh size. After 40 days of rearing, the tila- pia were size graded and transfered to three 4-m3 cages with mesh size of 17 mm under a stocking density of 775 fish/m3. This strategy aimed to homogenize fish size among the stocked population. The early grow- out phase lasted 20 days, after which the fish were graded and stunted ani- mals discarded. In the growout and finishing stages, three cages for each treatment were used. Fish in each net pen or floating cage were counted and weighed weekly to calculate the mean body weight. For each cage, weighing was repeated with a minimum of two new fish samplings. After weighing, animals were returned to their re- spective pens or cages. A total of 488 fish samplings were conducted dur- ing the 207-day study period. Results Growth The weekly growth rates of the fish progressively decreased during the rearing cycle from 40% in the ini- tial stages to less than 1% before har- vest (Figure 1). Fish were harvested after 30 weeks of growout with mean body weights of 857 and 991 g for treatments TR28 and TR32, respec- tively. Statistical analyses indicated significant differences in fish growth between the feeding treatments (P < 0.05). Tilapia in treatment TR32 showed higher body weight values when compared to treatment TR28. Early Growout Data obtained for the first stages of growout indicated it is possible to achieve good growth performance for Chitralada even when they are subjected to high stocking densities in clear water conditions. In the early growout, feed costs were U.S. $12.16 for producing 1,000 juveniles Table 1. Feeding program for the tilapia study. Feeding rates and ration frequency were reduced progressively with higher body weights. Feed Crude Feeding Rate Protein Feed Fish Weight (g) (% stocked Rations/ Level Size From To biomass) Day 0.5 1.5 18.0 12 45% 300 μ 1.5 3 16.0 10 3 5 15.0 9 40% 1-2 mm 5 10 8.0 8 10 15 8.0 7 15 25 7.0 6 36% 3-4 mm 25 35 6.0 6 35 45 6.0 6 45 60 5.0 5 60 90 5.0 5 32% 4-5 mm 90 120 5.0 5 120 170 4.5 4 170 200 4.0 4 200 250 3.5 3 250 300 3.5 3 300 350 3.0 3 350 400 3.0 3 400 450 2.5 3 450 500 2.5 3 28% or 32% 8-9 mm 500 540 2.0 3 540 570 1.8 3 570 600 1.8 3 600 630 1.5 3 630 650 1.5 3 650 670 1.2 3 670 700 1.0 3 700 Harvest 1.0 3 Days of Growout Figure 1. Weekly growth rates of tilapia. The decrease at day 62 reflects fish grading. WeeklyWeightGain(%) 50 40 30 20 10 0 -10 -20 41 53 62 74 88 102 116 130 144 158 172 186 200 28%-Protein Feed 32%-Protein Feed After 30 weeks of cage culture, this tilapia reached 1.2 kg.
- 3. of 23.4 g average body weight. In this phase, fish mortality was below 5% and feed-conversion ratios were close to 1.0 (Table 2). Growout During the later growout, which had optimum water temperatures of around 29.3° C, the tilapia grew better when fed the 32%-protein feed than the 28%-protein feed (Table 3). Growth performance differences between the treatments were evident when final feed conversion and survival were compared. Under the TR32 treatment, feed costs were U.S. $0.03/kg of har- vested fish lower than for the TR28. This reflected savings of U.S. $30.00/ mt of fish harvested. However, up to the 26th week of growout, there was only a seven-day fish weight difference between feed- ing treatments (Figures 2 and 3). Therefore, for fish up to 750 g, a lower feed protein level appeared to provide a greater advantage in economical terms. Feed-conversion values increased during the culture trial period, but particularly after stocked biomass surpassed the 170 kg/m3 threshold or after tilapia achieved 730 g in body weight. This may have been due to the limited physical space in the cages or poor environmental conditions. With greater fish biomass, hierarchical fish behavior intensifies and greater amounts of metabolites are excreted. Lower feed access and poorer water quality can result in increased stress to fish. Reducing fish biomass at this stage should improve results. However, it is possible the detri- ment in fish growth could be the con- sequence of a metabolic retraction by Chitralada at this developmental stage. Another possibility is that the greater stress imposed on fish under higher stocking densities could lead to higher energy demands. Protein in the feed can be allocat- ed as an energy source if energy de- mands exceed those met by the lipid and carbohydrate sources in the feed. If this occurs, tilapia growth and feed-conversion ratios can be compromised. As such, this could explain the better growth perform- ance delivered by the 32%-protein feed in fish above 750 g. Table 2. Growth and feed costs for tilapia fry grown at high density in net pens. Parameters Net Pen #1 Net Pen #2 Net Pen #3 Initial weight (g) 1.50 1.50 1.50 Final weight (g) 21.70 24.70 23.80 Feed-conversion ratio 1.05 1.04 0.98 Survival 98.3% 96.8% 96.4% Biomass gain (g) 118.73 134.26 128.85 Cost/1,000 fish (U.S. $) $11.75 $12.76 $11.98 Cost/kg fish (U.S. $) $0.58 $0.55 $0.54 Cost/net pen (U.S. $) $69.26 $74.08 $69.30 Table 3. Growth and feed costs of tilapia over the growout period. Parameters TR28 TR32 Average final weight (g) 857.3 991.4 Feed-conversion ratio 1.89 1.69 Final survival 80.2% 86.1% Biomass gain/cage (kg) 614.91 782.74 Cost/kg of fish (U.S. $) $0.67 $0.64 Fish weighing was carried out weekly in the early morning and before first feeding. Figure 3. Performance of tilapia fed 32%-protein feed. 350 325 300 275 250 225 200 175 150 125 100 75 50 25 0 190 231 274 308 371 408 448 517 559 613 651 726 739 799 797 849 857 14th 15th 16th 17th 18th 19th 20th 21st 22nd 23rd 24th 25th 26th 27th 28th 29th 30th Fish Body Weight (g)/Week of Culture kg/m3 Feed-ConversionRatio 350 325 300 275 250 225 200 175 150 125 100 75 50 25 0 203 239 286 340 395 460 502 560 604 651 728 768 805 866 881 945 991 14th 15th 16th 17th 18th 19th 20th 21st 22nd 23rd 24th 25th 26th 27th 28th 29th 30th Fish Body Weight (g)/Week of Culture kg/m3 Feed-ConversionRatio Figure 2. Performance of tilapia fed 28%-protein feed. Stocked Fish Biomass Feed Delivered Feed-Conversion Ratio 2.0 1.8 1.6 1.4 1.2 1.0 0.8 0.6 0.4 0.2 0.0 2.0 1.8 1.6 1.4 1.2 1.0 0.8 0.6 0.4 0.2 0.0 Stocked Fish Biomass Feed Delivered Feed-Conversion Ratio 64 November/December 2006 GLOBAL AQUACULTURE ADVOCATE