

Empfohlen
Weitere ähnliche Inhalte
Was ist angesagt?
Was ist angesagt? (20)
Andere mochten auch
Andere mochten auch (20)
Ähnlich wie Raster data model
Ähnlich wie Raster data model (20)
Mehr von Sumant Diwakar
Mehr von Sumant Diwakar (20)
Kürzlich hochgeladen
Kürzlich hochgeladen (20)
Raster data model
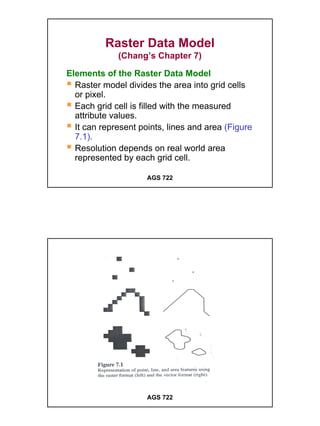
- 1. Raster Data Model (Chang’s Chapter 7) Elements of the Raster Data Model Raster model divides the area into grid cells or pixel. Each grid cell is filled with the measured attribute values. It can represent points, lines and area (Figure 7.1). Resolution depends on real world area represented by each grid cell. AGS 722 AGS 722 1
- 2. Raster Data Model The larger the area represented, the lower the resolution of data. Cells are identified by their positions in the grid. Raster data is geo-referenced by: • Real world coordinates of the reference point • Cell size in real world distance • Use the upper-left or lower-left corner of grid as the reference point. AGS 722 IDRISI Metadata AGS 722 2
- 3. Raster Data Model Storage requirement is high. Ex: If the area is 100 km x 100 km and cell size is 10 m. It needs 10,000 rows x 10,000 columns or 100,000,000 pixels. If one byte is used per pixel, it requires 100 MB storage AGS 722 Types of Raster Data 1. Satellite Imagery Remotely sensed satellite data are recorded in raster format. Spatial resolution varies: • 30 m. for Landsat 4 and 5 (use the Thematic Mapper scanner), and Landsat 7 (use Enhanced Thematic Mapper-Plus, ETM+ scanner). AGS 722 3
- 4. • 20 m. for SPOT images (Multi-spectral sensor), and 10 m. for SPOT Panchromatic sensor). • 4 m. and 1 m. for IKONOS Multi-spectral and Panchromatic images respectively. The pixel value in a satellite image represents light energy reflected or emitted from the Earth’s surface. AGS 722 The measurement of light energy is based on electromagnetic spectrum. Panchromatic images are comprised of a single spectral band. Multi-spectral images have multiple bands. – Landsat TM has 7 band. Land use, land cover and hydrography can be classified from image processing system. Satellite images can be diaplayed in black and white or in color. AGS 722 4
- 5. Landsat TM Bands AGS 722 Composite Color Images AGS 722 5
- 6. 2. Digital Elevation Models (DEM) DEM consists of an array of uniformly spaced elevation data. DEM are produced from: – a stereoplotter and aerial photograph with overlapping areas. – Satellite imagery such as SPOT stereo model using special software. AGS 722 3. Digital Orthophotos Prepared from aerial photograph or other remotely sensed data. Displacement caused by camera tilt and terrain relief has been removed. They are geo-referenced and can be registered with topographic and other maps. AGS 722 6
- 7. Digital Orthophoto AGS 722 4. Binary Scanned Files Scanned image containing values of 1 and 0. Maps to be digitized are typically scanned at 300 or 400 dpi (dots per inch). 5. Graphic Files Maps, photographs and images can be stored as digital graphic files. – e.g. TIFF (Tagged Image File Format), GIF (Graphic Interchangeable Format), JPEG (Joint Photographic Exports Group), etc. – GeoTIFF is a geo-referenced version of TIFF format. AGS 722 7
- 8. Raster Data Structure Refers to storage of raster data so that it can be processed by the computer. Cell-by Cell Encoding A raster model is stored as a matrix. Its cell values are written into a file by row and column. (Figure 7.2) Ideal to store the cell values that change continuously, e.g.,DEM. AGS 722 AGS 722 8
- 9. For multi-spectral satellite image, each cell has more than one value, data are stored in either of the following formats. – The band interleaved by line (.bil): this method stores the 1st value of every row sequentially, followed by the second value of every row, and so on in one image. AGS 722 Multi-band Satellite Data Structure .bsq .bil Figure 7.x .bip AGS 722 9
- 10. The Band Sequential (.bsq) method: stores values of each band sequentially in one image. The Band Interleave by Pixel (.bip): each row of an image is stored sequentially, row 1 all bands, row 2 all bands, and so on. (See Figure 7.x) AGS 722 Multi-band Satellite Data Structure .bsq .bil Figure 7.x .bip AGS 722 10
- 11. Run-length Encoding Records the cells by row and by group Each group includes a cell value and the number of cells with that value. If all cells in a row contain the same value, only one group is recorded, hence save computer memory. See Figure 7.3. AGS 722 AGS 722 11
- 12. Chain Code Method Represent the boundary of a region by using a series of cardinal directions and cells. – Ex: N1 means moving north by 1 cell, S4 means moving south by 4 cells. See Figure 7.4 AGS 722 AGS 722 12
- 13. Block Code Method Uses square blocks to represent the region. – A unit square represents 1 cell. – 4-square block represents 2 x 2 cells – 9-square block represents 3 x 3 cells, and so on. Each square block is coded only with the location of a cell (lower left of the block), and the side length of the block. See Figure 7.5 AGS 722 AGS 722 13
- 14. Quad Tree Method Uses recursive decomposition to divide a grid into a hierarchy of quadrants. (Figure 7.6). A quadrant having cells with the same value will not be sub-divided, and it is stored as a leaf node. Leaf nodes are coded with the value homogeneous quadrant. A quadrant having different cell values will be subdivided until a quadrant at the finer level contains only one value. AGS 722 AGS 722 14
- 15. This method is efficient for storing and processing data. Different raster GIS software use different method of storing data. – IDRISI and GRASS use either cell-by-cell or run length encoding method. – SPANS uses a quad-tree data structure. AGS 722 Data Compression Refers to the reduction of raster data volumes. Run length encoding method may reach 10:1 compression ratio. TIFF and GIF files use lossless compression which allows the original image to be precisely reconstructed. AGS 722 15
- 16. Data Compression JPEG files use lossy compression which can achieve high compression ratios but can not reconstruct the original image fully. MrSid (Multi-resolution Seamless Image Database) has capability of recalling image data at different resolution or scales and also can compress a large image. AGS 722 Projection of Raster Data Projected raster data are based on rows and columns but the rows and columns are measured in real-world coordinates. – Ex: • Rows: 463, Columns: 318, Cell size: 30 m • UTM coordinates at the lower left corner: 499995, 5177175 • UTM coordinates at the upper right corner: 509535, 5191065 AGS 722 16
- 17. • The cell in Row 1 and Column 1 at the upper left corner has UTM coordinates of 499995, 5191035. Data Conversion Conversion of vector to raster data is called rasterization. Conversion of raster to vector data is called vectorization. (Figure 7.8) Both require use of computer algorithms which most GIS software have. AGS 722 AGS 722 17
- 18. Integration of Raster and Vector Data Can take place in data display, data processing, data conversion, or data analysis. DEM are input data to extract topographic features such as contour, drainage network, watersheds, etc. Most GIS packages allow simultaneous display of raster and vector data. Data conversion must be performed first if the analysis of both raster and vector data is required. AGS 722 18