1. Market Review and Outlook
QE Index and Volume
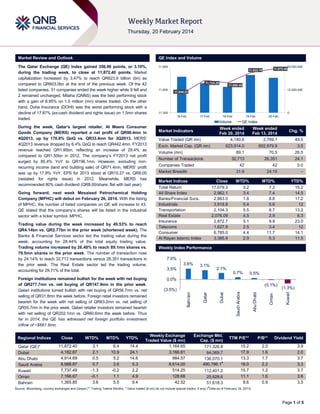
The Qatar Exchange (QE) Index gained 356.90 points, or 3.10%,
during the trading week, to close at 11,872.40 points. Market
capitalization increased by 3.47% to reach QR623.9 billion (bn) as
compared to QR603.0bn at the end of the previous week. Of the 42
listed companies, 31 companies ended the week higher while 9 fell and
2 remained unchanged. Milaha (QNNS) was the best performing stock
with a gain of 8.95% on 1.5 million (mn) shares traded. On the other
hand, Doha Insurance (DOHI) was the worst performing stock with a
decline of 17.87% (ex-cash dividend and rights issue) on 1.5mn shares
traded.
11,900
Regional Indices
Qatar (QE)*
Dubai
Abu Dhabi
Saudi Arabia
Kuwait
Oman
Bahrain
Close
11,872.40
4,182.87
4,914.69
8,988.87
7,737.49
7,166.67
1,365.85
WTD%
MTD%
YTD%
3.1
2.1
0.5
0.7
-1.3
-0.1
3.6
6.4
10.9
5.2
2.6
-0.2
1.1
5.5
14.4
24.1
14.6
5.3
2.2
4.9
9.4
11,300
0
16-Feb
17-Feb
18-Feb
19-Feb
Volume
20-Feb
QE Index
Week ended
Feb 20, 2014
4,140.6
Week ended
Feb 13, 2014
2,769.1
623,914.0
602,979.9
3.5
89.1
70.5
26.5
32,713
26,351
24.1
42
42
0.0
Market Breadth
31:9
24:15
–
Market Indices
Close
Total Return
17,079.3
All Share Index
2,962.1
Banks/Financial Svcs.
2,863.0
Industrials
3,918.8
Transportation
2,104.3
Real Estate
2,076.09
Insurance
2,872.7
Telecoms
1,627.8
Consumer
6,785.0
Al Rayan Islamic Index
3,385.9
Market Indices
Weekly Index Performance
WTD%
3.2
3.4
1.8
5.4
5.5
4.5
5.1
2.5
4.4
2.9
Market Indicators
Value Traded (QR mn)
Exch. Market Cap. (QR mn)
Volume (mn)
Number of Transactions
Companies Traded
Chg. %
49.5
MTD%
7.2
7.4
8.8
5.6
8.7
2.9
9.9
3.4
11.7
5.3
YTD%
15.2
14.5
17.2
12
13.2
6.3
23.0
12
14.1
11.5
7.0%
3.6%
3.5%
3.1%
2.1%
0.7%
0.5%
0.0%
Weekly Exchange
Traded Value ($ mn)
1,164.65
3,166.81
984.57
8,614.00
514.25
128.68
42.52
Exchange Mkt.
Cap. ($ mn)
171,326.8
84,069.7
136,070.1
490,786.1#
112,401.2
25,628.6
51,618.3
Oman
Abu Dhabi
(1.3%)
Kuwait
(0.1%)
(3.5%)
Saudi Arabia
Foreign institutions remained bullish for the week with net buying
of QR277.7mn vs. net buying of QR147.9mn in the prior week.
Qatari institutions turned bullish with net buying of QR56.7mn vs. net
selling of QR31.8mn the week before. Foreign retail investors remained
bearish for the week with net selling of QR83.2mn vs. net selling of
QR55.7mn in the prior week. Qatari retailer investors remained bearish
with net selling of QR202.1mn vs. QR60.6mn the week before. Thus
far in 2014, the QE has witnessed net foreign portfolio investment
inflow of ~$661.8mn.
12,500,000
Dubai
Trading value during the week increased by 49.53% to reach
QR4.14bn vs. QR2.77bn in the prior week (shortened week). The
Banks & Financial Services sector led the trading value during the
week, accounting for 28.44% of the total equity trading value.
Trading volume increased by 26.48% to reach 89.1mn shares vs.
70.5mn shares in the prior week. The number of transaction rose
by 24.14% to reach 32,713 transactions versus 26,351 transactions in
the prior week. The Real Estate sector led the trading volume,
accounting for 29.71% of the total.
11,690.49
11,546.23
Qatar
Going forward, next week Mesaieed Petrochemical Holding
Company (MPHC) will debut on February 26, 2014. With the listing
of MPHC, the number of listed companies on QE will increase to 43.
QE stated that the company‟s shares will be listed in the industrial
sector with a ticker symbol, MPHC.
11,724.20
11,600
Bahrain
During the week, Qatar’s largest retailer, Al Meera Consumer
Goods Company (MERS) reported a net profit of QR90.4mn in
4Q2013, up by 170.8% QoQ vs. QR33.4mn for 3Q2013. MERS‟
4Q2013 revenue dropped by 6.4% QoQ to reach QR442.4mn. FY2013
revenue reached QR1.95bn, reflecting an increase of 29.4% as
compared to QR1.50bn in 2012. The company‟s FY2013 net profit
surged by 85.4% YoY to QR196.1mn. However, excluding nonrecurring income (land and building sale) of QR71.4mn, MERS‟ profit
was up by 17.9% YoY. EPS for 2013 stood at QR10.27 vs. QR9.00
(restated for rights issue) in 2012. Meanwhile, MERS has
recommended 80% cash dividend (QR8.00/share; flat with last year).
25,000,000
11,872.40
11,822.78
TTM P/E**
P/B**
Dividend Yield
15.2
17.9
13.3
18.0
15.7
11.1
9.6
2.0
1.6
1.7
2.2
1.2
1.6
0.9
3.9
2.0
3.7
3.3
3.7
3.6
3.5
#
Source: Bloomberg, country exchanges and Zawya (** Trailing Twelve Months; * Value traded ($ mn) do not include special trades, if any) ( Data as of February 19, 2013)
Page 1 of 5
2. News
Economic News
Doha Metro tunnel work to start in 3Q2014 – The tunnel
boring work for Doha Metro will start in 3Q2014, while the
construction work is progressing on 21 stations. Business
Development Manager Sara al-Muhannadi said 15 tunnelboring machines (TBMs) for the metro rail project are now
being manufactured. The delivery of the first train will be in
3Q2017, followed by the power-on for the first test section in
4Q2017. Qatar Rail‟s Senior Program Director Markus
Demmler said that the completion of all stations and tunnels will
be in 4Q2018 and the operations are scheduled to start in
4Q2019. (Gulf-Times.com)
MDPS: Qatar's CPI at lowest level since August 2012 –
According to the Ministry of Development Planning & Statistics
(MDPS), Qatar's Consumer Price Index (CPI) for January 2014
rose up by only 2.3% year-on-year, the lowest level since
August 2012. On a month-on-month based, it rose 0.3% as
compared to December 2013. Food prices were the key factor
behind the slowdown falling 0.7% month-on-month (1.6% yearon-year, which is the slowest rate of increase since August
2010). Housing and rents (the largest weight of overall inflation
with a 32.2% share) rose 1.0% month-on-month but were
steady at 2.8% year-on-year in January 2014. (Peninsula
Qatar, QNB Group)
Market & Corporate News
QE to list MPHC on February 26 – The Qatar Exchange (QE)
is scheduled to list the shares of Mesaieed Petrochemical
Holding Company (MPHC) on February 26, 2014. The decision
to list MPHC on QE resulted after the company obtained
approval from the Qatar Financial Markets Authority and fulfilled
all the necessary listing requirements. With the listing of
MPHC, the number of listed companies on QE will increase to
43. QE stated that the company‟s shares will be listed in the
industrial sector with a ticker symbol, MPHC. (Peninsula Qatar)
MERS reports QR90.4mn net profit for 4Q2013 – Al Meera
Consumer Goods Company (MERS) reported a net profit of
QR90.4mn in 4Q2013, up by 170.8% QoQ vs. QR33.4mn for
3Q2013. MERS‟ 4Q2013 revenue dropped by 6.4% QoQ to
reach QR442.4mn. FY2013 revenue reached QR1.95bn,
reflecting an increase of 29.4% as compared to QR1.50bn in
2012. The company‟s FY2013 net profit surged by 85.4% YoY
to QR196.1mn. However, excluding non-recurring income (land
and building sale) of QR71.4mn, MERS‟ profit was up by 17.9%
YoY. EPS for 2013 stood at QR10.27 vs. QR9.00 (restated for
rights issue) in 2012. Meanwhile, MERS has recommended
80% cash dividend (QR8.00/share; flat with last year), which
will have to be approved by shareholders at the annual general
assembly, scheduled on March 26, 2014. (QE, QNBFS
Research)
QNB, QDB and Al-Naqeeb join hands for new plant in SME
aid – As part of its commitment to provide banking products
and services to Small and Medium sized Enterprises (SMEs),
QNB Group, was the first bank to join Qatar Development
Bank‟s (QDB) QDB Al Dhameen program back in 2010. As the
bank which has financed the most clients through Al Dhameen
we continue our commitment to the SME sector. As part of this,
a signing ceremony took place during which QNB, Al-Naqeeb
Plastic Factory and QDB signed the relevant documents for a
new financing that is supported through the Al-Dhameen
program. Al Dhameen is a Private Sector Enterprise program
pioneered by QDB that enables lending to businesses that
require collateral. QNB is a keen supporter of the program and
is committed to working in close partnership with QDB to help
grow the private sector and support the free market economy in
Qatar. (QNB Group Press Release)
QNNS’ BoD to meet on February 26 – Qatar Navigation
Company‟s (QNNS) board of directors will meet on February
26, 2014 to discuss the company‟s financial results ending on
December 31, 2013. (QE)
GWCS’ Logistics Village to be ready by June – The Gulf
Warehousing Company's (GWCS) Chairman Fahad bin Hamad
bin Jassim Al Thani announced that the fourth phase expansion
of GWC's Logistics Village Qatar will be completed by June
2014. Addressing GWC's ordinary annual general assembly,
Fahad said that the logistics village matters a lot for both the
company‟s future success as well as the future of logistics
services in Qatar. The original master plan for the logistics
village was completed in April 2013, with all the warehouses
and services fully reserved. The company began the additional
fourth phase expansion, which acts as a complement to the
master. (Peninsula Qatar)
QCFS reports QR11.4mn net profit, recommends 20% cash
dividend – Qatar Cinema and Film Distribution Company
(QCFS) has reported a net profit of QR11.4mn in 2013 as
compared to QR11.8mn in 2012. EPS amounted to QR2.00 in
2013 vs. QR2.07 in 2012. Meanwhile, QCFS‟ board has
recommended 20% cash dividend, i.e. QR 2.0 per share. (QE)
QIC gets shareholders’ nod for capital hike to QR1.6bn –
An extraordinary general meeting of Qatar Insurance Company
(QIC) has approved an increase in its capital to QR1.6bn from
QR1.28bn by distributing bonus shares at the rate of one share
for every four shares held by shareholders. The EGM
authorized QIC‟s board of directors to amend article six of the
company‟s article of association to reflect the capital increase.
Meanwhile, the board‟s recommendation for distributing a cash
dividend of QR2.5 a share and a special 50th anniversary
bonus share of 25% has also been approved. (Gulf-Times.com)
DBIS reports QR17.2mn net profit in 4Q2013 – Dlala
Brokerage & Investment Holding Company (DBIS) reported a
net profit of QR17.2mn in 4Q2013, an increase of 58.4% QoQ.
Net profit for 2013 amounted to QR5.4mn as compared to
QR26.1mn in 2012. Net brokerage & commission income stood
at QR8.7mn in 4Q2013, reflecting an increase of 21.8% QoQ.
For the FY2013, net brokerage & commission income
amounted to QR29mn, a rise of 19.3% YoY. EPS amounted to
QR0.245 for 2013 as compared to QR1.176 in 2012.
Meanwhile, DBIS‟ board has recommended transferring the
year‟s profits to retained earnings. (QE)
MCGS reports QR89.4mn net profit, recommends 30% cash
dividend – Medicare Group (MCGS) has reported a net profit
of QR89.4mn in 2013 as compared to QR44.8mn in 2012. EPS
amounted to QR3.18 in 2013 vs. QR1.59 in 2012. Meanwhile,
MCGS‟ board recommended 30% cash dividend, i.e. QR 3.0
per share. The company‟s ordinary AGM is expected to be held
next April (date yet to be confirmed) (QE)
QISI posts QR70.9mn net profit in 2013 – Qatar Islamic
Insurance Company (QISI) reported a net profit of QR70.9mn in
2013 as compared to QR58.3mn in 2012. EPS for 2013
amounted to QR4.73 as compared to QR3.89 in 2012.
Meanwhile, QISI‟s BoD proposed a 37.5% (3 riyals per share)
profit distribution to its shareholders, which needs to be
discussed in the next AGM scheduled on March 12, 2014 in
Ezdan Hotel. (QE)
Page 2 of 5
3. Qatar Exchange
Top 5 Gainers
Top 5 Decliners
0.0%
12.0%
-3.5%
9.0%
8.8%
8.3%
-7.0%
8.0%
6.7%
-2.5%
-3.1%
-6.5%
6.3%
4.0%
-14.0%
0.0%
-21.0%
-17.9%
Milaha
Medicare
Group
Industries
Qatar
Barwa Real
Estate
Widam Food
Co.
Source: Qatar Exchange (QE)
Doha
Insurance
Islamic
Qatar German
Gulf
Holding Group
Co. for
International
Medical
Services
Devices
Masraf Al
Rayan
Source: Qatar Exchange (QE), Bloombeg
Most Active Shares by Value (QR Million)
Most Active Shares by Volume (Million)
750.0
24.0
635.3
536.2
17.2
500.0
16.8
16.0
319.4
250.0
217.1
215.2
7.5
8.0
4.9
0.0
4.6
Masraf Al
Rayan
Qatar Gas
Transport
(Nakilat)
0.0
Industries
Qatar
Barwa Real
Estate
QNB Group
Commercial
Bank of Qatar
Source: Qatar Exchange (QE)
23.28%
80%
10.28%
60%
27.56%
Vodafone
Qatar
Barwa Real
Estate
Net Traded Value by Nationality (QR Million)
145
17.78%
Non-Qatari
1,245
12.29%
1,390
26.19%
40%
38.87%
United
Development
Source: Qatar Exchange (QE)
Investor Trading Percentage to Total Value Traded
100%
Vodafone
Qatar
43.75%
20%
(145)
Qatari
2,896
2,751
0%
Buy
Sell
Qatari Individuals
Qatari Institutions
Non-Qatari Individuals
Non-Qatari Institutions
Source: Qatar Exchange (QE)
(500)
-
500
Net Investment
1,000
1,500
Total Sold
2,000
2,500
3,000
3,500
Total Bought
Source: Qatar Exchange (QE)
Page 3 of 5
4. TECHNICAL ANALYSIS OF THE QE INDEX
Source: Bloomberg
The QE index recorded gains for the second straight week, as it tagged a new five-year high. The index closed at 11,872.40, up about 3.1% for the week.
The index moved higher in four of the five trading sessions, as it broke above its resistance level of 11,734 as well as the psychological resistance of
11,800. The upmove over the last couple of weeks was supported by high trading volumes, which is always a positive sign. The MACD is diverging away
from the signal line on the positive side, while the RSI is trending higher in the overbought zone. Thus, with both the technical indicators providing a bullish
signal, the uptrend is likely to continue. However, we cannot rule out short-term profit booking after the strong gains witnessed over the last couple of
weeks. The next immediate resistance is seen near the 11,910 level followed by the 12,000 level, which could be a strong psychological resistance. On the
flip side, support is seen at the 11,734 level, after which the next support is around the 11,680 level.
DEFINITIONS OF KEY TERMS USED IN TECHNICAL ANALYSIS
RSI (Relative Strength Index) indicator – RSI is a momentum oscillator that measures the speed and change of price movements. The RSI oscillates
between 0 to 100. The index is deemed to be overbought once the RSI approaches the 70 level, indicating that a correction is likely. On the other hand, if
the RSI approaches 30, it is an indication that the index may be getting oversold and therefore likely to bounce back.
MACD (Moving Average Convergence Divergence) indicator – The indicator consists of the MACD line and a signal line. The divergence or the
convergence of the MACD line with the signal line indicates the strength in the momentum during the uptrend or downtrend, as the case may be. When the
MACD crosses the signal line from below and trades above it, it gives a positive indication. The reverse is the situation for a bearish trend.
Candlestick chart – A candlestick chart is a price chart that displays the high, low, open, and close for a security. The „body‟ of the chart is portion between
the open and close price, while the high and low intraday movements form the „shadow‟. The candlestick may represent any time frame. We use a one-day
candlestick chart (every candlestick represents one trading day) in our analysis.
Doji candlestick pattern – A Doji candlestick is formed when a security's open and close are practically equal. The pattern indicates indecisiveness, and
based on preceding price actions and future confirmation, may indicate a bullish or bearish trend reversal.
Shooting Star/Inverted Hammer candlestick patterns – These candlestick patterns have a small real body (open price and close price are near to each
other), and a long upper shadow (large intraday movement on the upside). The Shooting Star is a bearish reversal pattern that forms after a rally. The
Inverted Hammer looks exactly like a Shooting Star, but forms after a downtrend. Inverted Hammers represent a potential bullish trend reversal.
Page 4 of 5
5. Price % Change 5(Feb 20)
Day
% Change
YTD
Market Cap.
QR Million
TTM P/E
P/B
Div. Yield
195.00
2.90
13.37
136,447
14.4
2.6
3.6
Qatar Islamic Bank
81.40
0.49
17.97
19,234
14.4
1.6
4.6
Commercial Bank of Qatar
75.00
4.90
5.93
18,558
11.6
1.2
8.0
Doha Bank
67.80
3.67
16.49
17,518
11.8
1.6
6.1
Al Ahli Bank
67.10
4.52
22.00
8,527
16.2
2.4
4.5
Qatar International Islamic Bank
74.20
0.41
20.26
11,232
15.0
2.1
4.7
Masraf Al Rayan
39.05
(2.50)
24.76
29,288
17.2
2.8
2.6
Al Khaliji Bank
21.60
1.89
8.05
7,776
14.1
1.4
4.6
National Leasing
29.20
(0.85)
(3.15)
1,445
16.6
1.1
5.1
Dlala Holding
20.70
2.22
(6.33)
460
N/M
2.0
N/A
Qatar & Oman Investment
12.40
0.00
(0.96)
391
26.0
1.2
4.0
Islamic Holding Group
42.50
(6.49)
(7.61)
170
18.8
2.9
4.0
Company Name
Qatar National Bank
251,044
Banking and Financial Services
Zad Holding
71.00
1.43
2.16
929
9.4
0.7
5.6
Qatar German Co. for Medical Devices
14.00
(3.45)
1.08
162
N/M
0.9
N/A
Salam International Investment
14.12
(1.74)
8.53
1,614
14.2
1.0
5.0
Medicare Group
62.00
8.77
18.10
1,745
28.4
2.3
2.9
Qatar Cinema & Film Distribution
42.80
0.71
6.73
244
32.7
1.8
4.7
329.00
5.25
15.80
21,375
17.6
3.4
3.0
51.00
6.25
(1.35)
918
15.3
3.8
7.8
154.50
1.44
15.90
3,090
21.2
2.5
5.2
Qatar Fuel
Qatar Meat and Livestock
Al Meera Consumer Goods
30,077
Consumer Goods and Services
0.00
2.77
2,059
10.2
1.5
5.8
Qatar National Cement
114.40
52.00
(2.22)
(3.87)
5,617
12.9
2.3
5.2
Industries Qatar
194.00
8.26
14.86
117,370
14.6
3.6
4.0
41.55
1.34
(4.92)
5,166
23.4
2.4
1.8
Qatar Electricity and Water
193.90
5.55
6.60
19,390
14.0
3.2
3.8
Mannai Corp.
103.60
1.57
15.24
4,726
10.3
2.0
4.6
Aamal
15.11
2.79
0.73
9,066
18.1
1.4
N/A
Gulf International Services
81.70
(3.08)
12,147
20.1
4.2
1.8
Qatar Industrial Manufacturing
Qatari Investors Group
33.93
175,541
Industrials
Qatar Insurance
66.50
Doha Insurance
25.05
Qatar General Insurance & Reinsurance
49.55
Al Khaleej Takaful Insurance
Qatar Islamic Insurance
1.37
25.00
10,676
13.1
2.1
3.0
0.20
645
9.6
1.2
8.0
4.32
3.44
2,856
1.3
0.6
1.8
38.70
0.78
6.03
661
13.8
1.1
2.2
67.00
3.08
15.72
1,005
15.8
3.6
5.2
(17.87)
15,843
Insurance
United Development
22.75
1.43
0.62
7,672
9.4
0.7
4.4
Barwa Real Estate
32.60
6.71
9.40
12,685
18.6
1.0
4.6
Ezdan Real Estate
16.80
1.82
(1.18)
44,562
N/M
1.6
0.8
Mazaya Qatar Real Estate Development
12.62
2.10
12.88
1,262
19.1
1.2
4.8
66,181
Real Estate
152.60
2.76
11.22
48,881
18.5
2.0
3.3
12.46
0.81
16.34
10,534
N/M
1.8
N/A
Qatar Navigation (Milaha)
99.80
8.95
20.24
11,430
11.7
1.0
3.8
Gulf Warehousing
42.10
0.24
1.45
2,002
19.7
2.5
3.6
Qatar Gas Transport (Nakilat)
Transportation
22.11
2.93
9.19
12,382
16.2
3.5
4.5
Qatar Telecom
Vodafone Qatar
59,415
Telecoms
25,814
Qatar Exchange
623,914
Source: Bloomberg
Contacts
Saugata Sarkar
Ahmed M. Shehada
Keith Whitney
Sahbi Kasraoui
Head of Research
Head of Trading
Head of Sales
Manager - HNWI
Tel: (+974) 4476 6534
Tel: (+974) 4476 6535
Tel: (+974) 4476 6533
Tel: (+974) 4476 6544
saugata.sarkar@qnbfs.com.qa
ahmed.shehada@qnbfs.com.qa
keith.whitney@qnbfs.com.qa
sahbi.alkasraoui@qnbfs.com.qa
QNB Financial Services SPC
Contact Center: (+974) 4476 6666
PO Box 24025, Doha, Qatar
DISCLAIMER: This publication has been prepared by QNB Financial Services SPC (“QNBFS”) a wholly-owned subsidiary of Qatar National Bank (“QNB”). QNBFS is regulated by the Qatar
Financial Markets Authority and the Qatar Exchange; QNB is regulated by the Qatar Central Bank. This publication expresses the views and opinions of QNBFS at a given time only. It is not an
offer, promotion or recommendation to buy or sell securities or other investments, nor is it intended to constitute legal, tax, accounting, or financial advice. We therefore strongly advise potential
investors to seek independent professional advice before making any investment decision. Although the information in this report has been obtained from sources that QNBFS believes to be
reliable, we have not independently verified such information and it may not be accurate or complete. While this publication has been prepared with the utmost degree of care by our analysts,
QNBFS does not make any representations warranties as to the accuracy and completeness of the information it may contain, and declines any liability in that respect. QNBFS reserves the right
to amend the views and opinions expressed in this publication at any time. It may also express viewpoints or make investment decisions that differ significantly from, or even contradict, the views
and opinions included in this report.
COPYRIGHT: No part of this document may be reproduced without the explicit written permission of QNBFS.
Page 5 of 5