1. Applied Mathematical Sciences, Vol. 3, 2009, no. 42, 2085 - 2098
A Monte Carlo Comparison between Ridge and
Principal Components Regression Methods
Yazid M. Al-Hassan
Ministry of Education, Jordan
yazid_12111980@yahoo.com
Mowafaq M. Al-Kassab
Faculty of Science, Al al-Bayt University, Mafraq, Jordan
mowafaq2002@yahoo.co.uk
Abstract. A basic assumption concerned with general linear regression model is
that there is no correlation (or no multicollinearity) between the explanatory
variables. When this assumption is not satisfied, the least squares estimators have
large variances and become unstable and may have a wrong sign. Therefore, we
resort to biased regression methods, which stabilize the parameter estimates.
Ridge regression (RR) and principal components regression (PCR) are two of the
most popular biased regression methods. In this article, we used Monte Carlo
experiments to estimate the regression coefficients by RR and PCR methods. A
comparison between RR and PCR methods was made in the sense of having
smaller mean squares error (MSE). Based on this simulation study, we found that
RR method performs better than PCR method.
Mathematics Subject Classification: 62J07; 62H25; 65C05
Keywords: Multicollinearity, ridge regression, principal component regression,
mean squares error.
1. Introduction
In multiple linear regression model, we usually assume that the explanatory
variables are independent. However, in practice, there maybe strong or near to
strong linear relationships among the explanatory variables. In that case, the
independent assumptions are no longer valid, which causes the problem of
multicollinearity.
2. 2086 Y. M. Al-Hassan and M. M. Al-Kassab
In the presence of multicollinearity, it is impossible to estimate the unique effects
of individual variables in the regression equation. Moreover, the least squares
(LS) estimates are likely to be too large in the absolute value and, possibly, of the
wrong sign. Therefore, multicollinearity becomes one of the serious problems in
the linear regression analysis.
Many attempts have been made to improve the LS estimation procedure. In
general, there are two approaches. One approach centers at finding (biased)
estimators which have smaller MSE than the LS estimators. RR, as well as many
shrinkage type of estimators (stein, 1960; Sclove, 1968), is one example. This
approach does not directly address itself to the issue of multicollinearity, even
though multicollinearity is often the situation where the aforementioned
procedures (or estimators) are used.
Among these estimators, the ridge estimator points indirectly to the issue of
multicollinearity by constraining the length of the coefficient estimator (Hocking,
1976). In contrast, the second approach deals straightforward with the dependency
nature of the explanatory variables. The PCR, as well as the latent root regression
and the factor analysis approach, is one such example. The PCR imposes linear
constraints on the estimators. These constraints reflect the nature of linear
dependency among the explanatory variables.
The ridge estimators are defined through a parameter k , the value of which must
be chosen in order to produce a particular estimate of the regression coefficients.
On the other hand, the principal component estimators are obtained by using less
than the full set of principal components to explain the variations in the dependent
variable.
The objective of this article is to make a comparison between RR and PCR
methods based on the MSE criterion.
2. Methods
Consider the standard model for multiple linear regression
y = Xβ + e , (1)
where y is an n × 1 column vector of observations on the dependent variable, X is
an n × p fixed matrix of observations on the explanatory variables and is of full
rank p ( p ≤ n) , β is a p × 1 unknown column vector of regression coefficients,
and e is an n × 1 vector of random errors; E(e) = 0, E(ee′) = σ 2 I n , where I n
denotes the n × n identity matrix. The variables are assumed to be standardized so
that X′X is in the form of correlation matrix, and the vector X ′y is the vector of
correlation coefficients of the dependent variable with each explanatory variable.
ˆ
LS estimator, β , of the parameters are given by
β = ( X′X) −1 X′y .
ˆ (2)
3. Monte Carlo comparison 2087
2.1 Ridge Regression
Hoerl and Kennard (1970a) suggested the use of X′X + kI p , (k ≥ 0) rather than
X′X , in the estimation of β (Eq. (2)). The resulting estimators of β are known in
literature as the RR estimators, given by
β(k ) = ( X′X + kI p ) −1 X′y
ˆ (3)
The constant k is known as biasing or ridge parameter. As k increases from zero
and continues up to infinity, the regression estimates tend toward zero. Though
these estimators result in bias, for certain value of k, they yield minimum MSE
compared to the LS estimator (Hoerl and Kennard, 1970a). However, the
MSE( β(k ) ) will depend on unknown parameters k, β and σ 2 , which cannot be
ˆ
calculated in practice. But k has to be estimated from the real data instead.
Several methods for estimating k have been proposed and evaluated by several
researchers. Some of these researchers are Hoerl and Kennard (1970a), Hoerl et
al. (1975), McDonald and Galarneau (1975), Lawless and Wang (1976), Hocking
et al. (1976), Wichern and Churchill (1978), Nordberg (1982), Saleh and Kibria
(1993), Singh and Tracy (1999), Wencheko (2000), Kibria (2003), Khalaf and
Shukur (2005) and Al-Hassan (2009).
In order to describe these methods, it is convenient to write the linear regression
model (1) in canonical form. Suppose, there exists an orthogonal matrix D such
that D′CD = Λ , where C = X′X and Λ = diag (λ1 , λ 2 ,..., λ p ) contains the
eigenvalues of the matrix C , then the canonical form of the model (1) is
y = X ∗α + e , (4)
where X ∗ = XD and α = D′β . Then the LS estimator is given as follows
′
α = Λ −1 X ∗ y
ˆ
(5)
and so we can write the RR estimator as
′ ′
α( k ) = (X ∗ X ∗ + K) −1 X ∗ y ,
ˆ (6)
where K = diag (k1 ,k 2 ,..., k p ) , k i > 0 . Eq. (6) is called the general form of ridge
regression (Hoerl and Kennard, 1970a). It follows from Hoerl and Kennard
(1970a) that the value of k i which minimizes the MSE( α (k ) ), where
ˆ
p
λi p
k i2α i2
MSE(α (K )) = σ 2 ∑
ˆ +∑ , (7)
i =1 (λ i + k i ) 2 i =1 (λ i + k i ) 2
is
σ2
ki = , (8)
α i2
4. 2088 Y. M. Al-Hassan and M. M. Al-Kassab
where σ 2 represents the error variance of model (1), α i is the ith element of α .
Equation (8) gives a value of k i that fully depends on the unknowns σ 2 and α i ,
and must be estimated from the observed data. Hoerl and Kennard (1970a)
suggested the replacement of σ 2 and α i by their corresponding unbiased
estimators, that is,
ˆ σ
2
ˆ
ki = 2 , (9)
αi
ˆ
where σ 2 = ∑ ei2 n − p is the residual mean square estimate, which is an
ˆ
unbiased estimator of σ 2 , and α i is the ith element of α , which is an unbiased
ˆ ˆ
estimator of α .
Below we present some methods for estimating ridge parameter k.
ˆ
1. Hoerl and Kennard Method ( k HK or HK)
Hoerl and Kennard (1970a) found that the best method for achieving a better
estimate β(k ) is to use k i = k for all i , and they suggested k is to be,
ˆ
σ2
ˆ
k HK =
ˆ (10)
max(α i2 )
ˆ
ˆ
2. Hoerl, Kennard and Baldwin Method ( k HKB or HKB)
Hoerl, Kennard and Baldwin (1975) proposed a different estimator of k by taking
ˆ
the harmonic mean of k i in Eq. (9). That is
pσ 2
ˆ
k HKB = p
ˆ (11)
∑ α i2
ˆ
i =1
ˆ
3. Lawless and Wang Method ( k LW or LW)
Lawless and Wang (1976) proposed the following estimator
pσ 2
ˆ
k LW =
ˆ
p
(12)
∑λ α
ˆ
i =1
i i
2
ˆ
4. Hocking, Speed and Lynn Method ( k HSL or HSL)
Hocking, Speed and Lynn (1976) suggested the following estimator for k
5. Monte Carlo comparison 2089
p
∑ (λ α )
ˆ i i
2
k HSL = σ 2
ˆ ˆ i =1
p
(13)
(∑ λ i α )
ˆ i
2 2
i =1
ˆ
5. Khalaf and Shukur Method ( k KS or KS )
Khalaf and Shukur (2005) suggested a new approach for choosing the ridge
parameter k by adding the amount σ 2 max(λ i ) to the denominator of the right
ˆ
hand side of Eq.(10) which is a function of the correlation between the
independent variables. The proposed estimator is
max(λi )σ 2
ˆ
kˆKS = (14)
(n − p − 1)σ + max(λi ) ⋅ max(α i ) 2
ˆ 2
ˆ
2.2 Principal Component Regression
In principal components analysis, the p original variables are transformed into
linear combinations called principal components. Principal components were first
proposed by Person (1901) and further developed by Hotelling (1933).
Comprehensive surveys of the field have been given by Jolliffe (1986), Jackson
(1991) and Basilevsky (1994). Other reviews are by Rao (1964), Jackson (1980,
1981), Wold et al. (1987), Duntman (1989) (Rencher, 1998) and Jolliffe (2005).
As we have indicated, an approach to the problem of multicollinearity is PCR, in
which y is regressed on the principal components of X's . If we use only the
larger principal components, the large variances in β ’s due to multicollinearity
ˆ
j
are reduced, but of course we introduce some bias in the new β j ’s. Often, the
ˆ
principal components with the highest variance are selected. However, the low-
variance principal components may also be important, and in some cases, they
may even more important than those with the highest variances (Jolliffe, 1982) .
PCR was first proposed by Hotelling (1957) and Kendal (1957). Hsuan (1981)
explored the relationship between PCR and RR. He proved that when the data are
severely multicollinear, the ridge estimator can be made very close to the
principal components estimators. Bay and Parker (1984) and Nomura and Ohkubo
(1985) showed that additional gains in expected squared error of the estimators
can be made by combining RR and PCR.
To write the PCR estimator, let X ∗ = XD be the matrix of the principal
components of C , where D is the matrix of p (normalized) eigenvectors of C .
Using Eq. (5) we get
α = (X*' X)−1 X* y
ˆ (15)
Thus, the reduced model can be written as
αq = ( Xq ' Xq ) −1 X* ' y
ˆ *
q
6. 2090 Y. M. Al-Hassan and M. M. Al-Kassab
−
= Λq 1Dq X' y
'
(16)
where X * = XD q , D q is the matrix of the first q eigenvectors of C , and Λ q is a
q
diagonal matrix that contains the first q eigenvalues of C .
Now to obtain regression coefficients for the original variables, we can solve for
α = D'β to obtain β = Dα , since D is orthogonal. The estimated value of β is
β = Dα . Thus, for the reduced model we have
ˆ
PC
ˆ
β PC = D q α q
ˆ ˆ (17)
Substituting (16) in (17), we obtain the principal components estimator
β PC = Dq Λq 1D′ X′ y
ˆ −
q (18)
ˆ
The MSE of β PC is given by the following (Rencher, 1998; Al-Hassan, 2007)
q p
1
MSE(β PC ) = σ 2 ∑ +
ˆ
∑ (d′ β) 2
(19)
i =1 λi i =q +1
i
where d ′ is the ith eigenvector of C , q + 1 < i < p . For the detailed derivation of
i
ˆ ˆ
β PC and MSE(β PC ) see [Al-Hassan, 2007, section 3.3.1] and [Rencher, 1998,
section 9.8].
The purpose of principal components is to generate a reduced set of variables that
account for most of the variance of the original variables. We must therefore
decide just how many components to retain; other components will be discarded.
In reality, the number of components extracted in a principal component analysis
is equal to the number of observed variables being analyzed. However, Mansfileld
et al (1977) suggested that only the first few components account for meaningful
amounts of variance, so only these first few components are retained and used in
multiple regression analyses.
Jolliffe (1982) represents the point of view of many statisticians whose decisions
depend only on the magnitude λ of the variance of the principal component and
others who give examples in which the principal components of small variance
must be selected.
A number of stopping rules have been suggested. A small sample of publications
concerning some of these rules includes Guttman (1954), Bartelett (1954), Jolliffe
(1972; 1973), Foucart (2000), Cadima and Jolliffe (2001), Hwang and Nettelton
(2003), Al-Kandari and Jolliffe (2001; 2005) and Chen (2006).
Moreover, several studies have evaluated the performance of these rules using real
and simulated data. Some of these studies are Jolliffe (1972; 1973), Yeomans and
Golder (1982), Jackson (1993), King and Jackson (1999), Peres-Neto et al (2003;
2005) and Cangelosi and Goriely (2007).
Rules include (among others): the broken stick model, the Kaiser-Guttman test,
Log-Eigenvalue (LEV) diagram, Velicer's Partial Correlation Procedure, Cattell's
SCREE test, cross-validation, bootstrapping techniques, cumulative percentage of
7. Monte Carlo comparison 2091
total of variance, and Bartlett's test for equality of eigenvalues. For a description
of these and other methods see [Jackson (1991), Section 2.8] and [Jolliffe (2002),
Section 6.1].
In this study, we will use the broken stick model to decide how many components
to retain. This rule provide a good combination of simplicity of calculation and
accurate evaluation of dimensionality relative to other stopping rules (Jackson,
1993). Jackson (1993) and King and Jackson (1999) showed that this method
performs well, at least when variables are highly correlated. Moreover, Cangelosi
and Goriely (2007) recommended the use of the broken stick model. In the
following paragraphs we introduce a brief description of the broken stick model.
The broken stick model
If one assumes that the total variance in a multivariate data set is divided at
randomly amongst all components, the expected distribution of the eigenvalues
can be assumed to follow a broken-stick distribution (Legendre and
Legendre,1998). The idea underlying the model is that if a stick is randomly
broken into p pieces, b1 would be the average size of the largest piece in each set
of broken sticks, b2 would be the average size of the second largest piece, and so
on. In the case of correlation matrices (i.e., standardized variables), p equals the
number of components and the total amount of variation across all components.
This method was proposed by Frontier (1976). Frontier (1976) and Legendre and
Legendre (1983) provide a table of eigenvalues based on the broken-stick
distribution, but the solution is easily computed as :
p
1
bk = ∑ (20)
i=k i
where p is the number of variables and bk is the size of eigenvalue for the kth
component under the broken-stick model. A modification of (20) made by
Legendre and Legendre (1998) is
1 p 1
bk = ∑
p i =k i
(21)
If the kth component has an eigenvalue that is larger than bk , then the component
should be retained.
3. The Monte Carlo Simulations
In this section, we will discuss the simulation study that compares the
performance of ridge estimators with principal components estimator under
several degrees of multicollinearity. We consider five different ridge estimators
corresponding to five different values of ridge parameter k . These values of
k are k HK , k HKB , k LW , k HSL and k KS ; which were calculated using equations (10),
(11), (12), (13) and (14), respectively. As for the principal components estimator,
we used the broken stick model to decide how many components to retain.
8. 2092 Y. M. Al-Hassan and M. M. Al-Kassab
Thirty observations are generated for each of twenty explanatory variables, i.e.
n = 30 , p = 20 . McDonald and Galarneau (1975), Wichern and Churchill (1978),
Gibbons (1981), Kibria (2003) and other researchers used the following device to
generate the explanatory variables
1
xij = (1 − γ ) z ij + γz ip , i = 1,2,...,30, j = 1,2,...,20
2 2
(22)
where z ij are independent standard normal pseudo-random numbers, z i 21 is the
ith element of the column vector of random error Z 21 , γ is specified so that the
correlation between any two explanatory variables is given by γ 2 .
To take the number of correlated variables in consideration, we modified the
previous device (Eq. (22)) to be
1
x ij = (1 − γ 2 ) 2 z ij + γ z i 21 , i = 1, 2,...,30 , j = 1, 2,..., m
x ij = z ij , j = m + 1, m + 2,..., 20 , m ≤ 20 (23)
where m is the number of correlated variables which varies from 2 to 20, that is,
we have 19 cases of correlation: ( x1 and x 2 ), ( x1 , x 2 and x3 ), . . ., ( x1 , x 2 ,. . .,
x19 and x 20 ). The variables are then standardized so that X′X and X ′y are in
correlation forms. Five different sets of correlation are considered corresponding
to γ 2 = 0.35, 0.51, 0.67, 0.84 and 0.99. These values of γ 2 will include a wide
range of low, moderate and high correlation between variables.
The n observations for the dependent variable y are determined by
y i = λ1 x i1 + λ 2 x i 2 + ... + λ p x ip + ei , i = 1,..., n (24)
where ei are independent normal (0, σ 2 ) pseudo-numbers.
As we indicated, the comparison is based on the MSE criteria, so we evaluated the
MSEs for each estimator. The MSEs of ridge estimators are evaluated by Eq. (7)
while the MSE of the principal components estimator is evaluated by Eq. (19).
4. Results
Our primary interest here lies in comparing the MSEs of the considered
estimators, so we evaluate the MSE for all estimators. Also, to identify the
efficiency of each estimator, we calculate the relative efficiency between each two
estimators.
There are 19 experiments, the results of each experiment consist of five tables;
each table displays the MSE of each estimator and the relative efficiencies
between the estimators under one level of correlation. The MSEs are arranged in
descending order, i.e., from the worst to the best. The first column of each table
contains the values of ridge parameter k of each method and the number of
principal components retained.
9. Monte Carlo comparison 2093
As a sample of these results, we introduce the results of Experiment 10 (the
correlation between variables x1 , x 2 , …, x 10 and x11 ) in Tables 1-5. Note that the
complete results are available from the corresponding author.
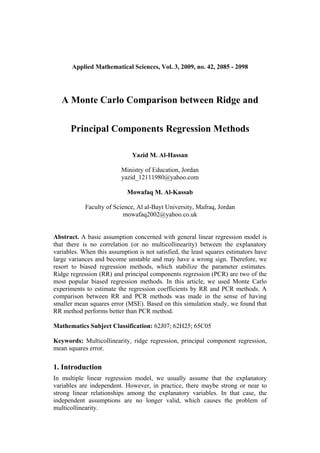
Table 1: The relative efficiency of PC with respect to ridge estimators when
correlation coefficient is γ 2 = 0.35 .
PC HSL HK KS LW HKB
K Method MSE
17 PC 0.3680060 100%
0.00291642 HSL 0.1323230 36.0% 100%
0.00561524 HK 0.1265340 34.4% 95.6% 100%
0.01369160 KS 0.1131540 30.7% 85.5% 89.4% 100%
0.03045480 LW 0.1026350 27.9% 77.6% 81.1% 90.7% 100%
0.04242070 HKB 0.0996465 27.1% 75.3% 78.8% 88.1% 97.1% 100%
Table 2: The relative efficiency of PC with respect to ridge estimators when
correlation coefficient is γ 2 = 0.51 .
PC HK HSL KS LW HKB
K Method MSE
17 PC 0.0556748 100%
0.001255200 HK 0.0276588 49.7% 100%
0.001394130 HSL 0.0275660 49.5% 99.7% 100%
0.004080540 KS 0.0259501 46.6% 93.8% 94.1% 100%
0.010158300 LW 0.0233588 42.0% 84.5% 84.7% 90.0% 100%
0.020258400 HKB 0.0208806 37.5% 75.5% 75.7% 80.5% 89.4% 100%
Table 3: The relative efficiency of PC with respect to ridge estimators when
correlation coefficient is γ 2 = 0.67 .
PC HK HSL KS LW HKB
K Method MSE
15 PC 0.0507352 100%
0.000138596 HK 0.0065473 12.9% 100%
0.000296360 HSL 0.0065030 12.8% 99.3% 100%
0.000345261 KS 0.0064895 12.8% 99.1% 99.8% 100%
0.000877755 LW 0.0063471 12.5% 96.9% 97.6% 97.8% 100%
0.004540220 HKB 0.0055699 11.0% 85.1% 85.7% 85.8% 87.8% 100%
Table 4: The relative efficiency of PC with respect to ridge estimators when
correlation coefficient is γ 2 = 0.84 .
PC HK HSL KS LW HKB
K Method MSE
10 PC 0.1515080 100%
0.000012215 HK 0.0026889 1.8% 100%
0.000025279 HSL 0.0026821 1.8% 99.8% 100%
0.000026205 KS 0.0026817 1.8% 99.7% 100.0% 100%
0.000050061 LW 0.0026695 1.8% 99.3% 99.5% 99.5% 100%
0.000447000 HKB 0.0024847 1.6% 92.4% 92.6% 92.7% 93.1% 100%
10. 2094 Y. M. Al-Hassan and M. M. Al-Kassab
Table 5: The relative efficiency of PC with respect to ridge estimators when
correlation coefficient is γ 2 = 0.99 .
PC HK HSL KS LW HKB
K Method MSE
10 PC 0.1724590 100%
0.000000030 HK 0.0022895 1.3% 100%
0.000000061 HSL 0.0022847 1.3% 99.8% 100%
0.000000063 KS 0.0022845 1.3% 99.8% 100.0% 100%
0.000000112 LW 0.0022769 1.3% 99.4% 99.7% 99.7% 100%
0.000001111 HKB 0.0021340 1.2% 93.2% 93.4% 93.4% 93.7% 100%
To compare the performance of the considered estimators, we will consider the
following criterion.
4.1 Performance as a function of γ 2
For given m , all of ridge estimators perform better than PC estimator for all sets
of correlation. Moreover, HKB, LW and KS estimators, respectively, perform
better than the other estimators for all sets of correlation. On the other hand, for
high correlations ( γ 2 = 0.84 and 0.99) the estimators KS, HSL, HK become
almost equivalent. For given m , as γ 2 increases, the MSEs of ridge estimators
decrease. As for PC estimator, there is no evident relation between γ 2 and the
MSE. But as γ 2 increases the number of retained components q decreases.
4.2 Performance as a function of m
For given γ 2 , also all of ridge estimators perform better than PC estimator, and
HKB, LW and KS estimators, respectively, perform better than the other
estimators for all sets of correlation. For γ 2 = 0.84 and 0.99 and m > 3 , there is a
direct relation between m and the MSE of PC estimator. As for the ridge
estimators, we didn't see any relation between m and the MSEs.
5. Conclusions and recommendations
In this article we have evaluated the performance of some of ridge estimators and
the principal component estimator (using broken stick model) by comparing them
based on the mean squares criteria. The evaluation has been done using Monte
Carlo simulations where levels of correlation and the number of correlated
variables have been varied. Given the results of our simulation study, certain
conclusions emerge. In general, these conclusions are restricted to the set of
experimental conditions investigated.
It is obvious from the simulation results that all of the ridge estimators perform
better than the PC estimator for all sets of correlation and for all values of m .
Besides, HKB, LW and KS estimators, respectively, perform better than the other
estimators. Based on the results, we recommend RR over PCR as a biased
estimation procedure. As we stated earlier, several ridge estimators uniformly
dominated PC estimator. Moreover, these results lead us to recommend that HKB
estimator is to be used to estimate the ridge parameter k , as one of the good
estimators.
11. Monte Carlo comparison 2095
References
[1] N. M. Al-Kandari and I. T. Jolliffe, Variable Selection and Interpretation
of Covariance Principal Components. Communications in Statistics
Simulation and Computation, 30 (2001), 339-354.
[2] N. M. Al-Kandari and I. T. Jolliffe, Variable Selection and Interpretation
of Correlation Principal Components. Environmetrics, 16 (2005), 659-672.
[3] Y. M. Al-Hassan, A Comparison Between Ridge and Principal
Components Regression Methods Using Simulation Technique. M.S.
thesis, Al al-Bayt University, Jordan, 2007.
[4] Y. M. Al-Hassan, A Monte Carlo Evaluation of Some Ridge Estimators.
Jordan Journal of Applied Science, 10 (2) (2008).
[5] M.S. Bartlett, A Note on the Multiplying Factors for Various x2
Approximations. Journal of the Royal Statistical Society - Series B, 16
(1954), 296-298.
[6] A. T. Basilevsky, Statistical Factor Analysis and Related Methods. Theory
and Applications. New York: John Wiley & Sons, 1994.
[7] M. R. Baye and D. F. Parker, Combining Ridge and Principal Component
Regression: A Money Demand Illustration. Communications in Statistics-
Theory and Methods, 13 (1984), 197-205.
[8] J. Cadima and I. T. Jolliffe, Variable Selection and the Interpretation of
Principal Subspace. Journal of Agricultural, Biological and
Environmental Statistics, 6 (2001), 62-79.
[9] R. Cangelosi and A. Goriely, Component Retention in Principal
Component Analysis with Application to cDNA Microarray Data. Biology
Direct, 2:2 (2007). http://www.biology-direct.com/content/2/1/2
[10] P. Chen, A Confidence Interval for the Number of Principal
Components. Journal of Statistical Planning and Inference, 136 (2006),
2630-2639.
[11] T. Foucart, A Decision Rule for Discarding Principal Components in
Regression. Journal of Statistical Planning and Inference, 89 (2000), 187-
195.
[12] D. G. Gibbons, A Simulation Study of Some Ridge Estimators. Journal
of the American Statistical Association, 76 (1981), 131-139.
[13] L. Guttman, Some Necessary Conditions for Common Factor Analysis.
Psychometrika, 19 (1954), 149-161.
[14] R. R. Hocking, The Analysis and Selection of Variables in Linear
Regression. Biometrics, 32 (1976), 1-49.
[15] R. R. Hocking, F. M. Speed and M. J. Lynn, A class of Biased
Estimators in Linear Regression. Technometrics, 18 (1976), 425-437.
12. 2096 Y. M. Al-Hassan and M. M. Al-Kassab
[16] E.Hoerl, and R. W. Kennard, Ridge Regression: Biased Estimation for
Nonorthogonal Problems. Technometrics, 12 (1970a), 55-67.
[17] E.Hoerl, R. W. Kennard and K. F. Baldwin, Ridge Regression: Some
Simulation. Communications in Statistic- Simulation and Computation s. 4
(1975), 105-123.
[18] F. C. Hsuan, Ridge Regression from Principal Component Point of
View. Communications in Statistics-Theory and Methods, 10 (1981),
1981-1995.
[19] J. T. Hwang and D. Nettleton, Principal Component Regression with
Data-Chosen Components and Related Methods. Technometrics, 45
(2003), 70-79.
[20] D. A. Jackson, Stopping Rules in Principal Components Analysis: A
Comparison of Heuristical and Statistical Approaches. Ecology, 74
(1993), 2204-2214.
[21] J. E. Jackson, A User’s Guide to Principal Components. Wiley, New
York, 1991.
[22] I. T. Jolliffe, Discarding Variables in a Principal Component Analysis I :
Artificial Data. Applied Statistics, 21(1972), 160-173.
[23] I. T. Jolliffe, Discarding Variables in a Principal Component Analysis II
: Real Data. Applied Statistics, 22 (1973), 21-31.
[24] I. T. Jolliffe, A Note on the Use of Principal Components in Regression.
Applied Statistics, 31 (1982), 300-303.
[25] I. T. Jolliffe, Principal Component Analysis, Springer-Verlag, New
York, 1986.
[26] I. T. Jolliffe, Principal Component Analysis. 2nd Edition, Springer, New
York, 2002.
[27] I. T. Jolliffe, Principal Component Analysis. Encyclopedia of Statistics
in Behavioral Science, 3 (2005), 1580-1584.
[28] G. Khalaf and G. Shukur, Choosing Ridge Parameter for Regression
Problems. Communications in Statistics-Theory and Methods, 34 (2005),
1177-1182.
[29] B. M. Kibria, Performance of Some New Ridge Regression Estimators.
Communications in Statistics- Simulation and Computation, 32 (2003),
419-435.
[30] J. R. King and D. A. Jackson, Variable Selection in Large
Environmental Data Sets Using Principal Components Analysis.
Environmetrics, 10 (1999), 67-77.
13. Monte Carlo comparison 2097
[31] J. F. Lawless and P. Wang, A Simulation Study of Ridge and Other
Regression Estimators. Communications in Statistics-Theory and Methods,
5 (1976), 307-323.
[32] P. Legendre and L. Legendre, Numerical Ecology. 2nd English Edition.
Elsevier Science BV, Amsterdam, 1998.
[33] E. R. Mansfield, J. T. Webster and R. F. Gunst, An Analytic Variable
Selection Technique for Principal Components Regression. Applied
Statistics, 6 (1977), 34-40.
[34] G. C. McDonald and D. I. Galarneau, A Monte Carlo Evaluation of
Some Ridge-Type Estimators. Journal of the American Statistical
Association, 70 (1975), 407-412.
[35] M. Nomura and T. Ohkubo, , A Note on Combining Ridge and Principal
Component Regression, Communications in Statistics - Theory and
Methods, A14 (1985), 2489-2493.
[36] L. Nordberg, A Procedure for Determination of a Good Ridge Parameter
in Linear Regression. Communications in Statistics - Simulation and
Computation, 11 (1982), 285-309.
[37] P. R. Peres-Neto, D. A. Jackson and K. M. Somers, Giving Meaningful
Interpretation to Ordination Axes: Assessing Loading Significance in
Principal Component Analysis. Ecology, 84 (2003), 2347–2363.
[38] P. R. Peres-Neto, D. A. Jackson and K. M. Somers, K. M. How Many
Principal Components? Stopping Rules for Determining the Number of
Non-trivial Axes Revisited. Computational Statistics and Data Analysis,
49 (2005), 974-997.
[39] A. C. Rencher, Methods of Multivariate Analysis, John Wiley & Sons,
New York, 1995.
[40] A. K. Saleh and B. M. Kibria, Performances of Some New Preliminary
Test Ridge Regression Estimators and Their Properties. Communications
in Statistics-Theory and Methods, 22 (1993), 2747–2764.
[41] S. L. Scolve, Improved Estimators for Coefficients in Linear Regression.
Journal of American Statistical Association, 63 (1968), 597-606.
[42] S. Singh and D. S. Tracy, Ridge-Regression Using Scrambled
Responses. Metrika, 41 (1999), 147–157.
[43] C. M. Stein, Multiple Regression, Contributions to Probability and
Statistics, Stanford University Press, 1960, 424-443.
[44] E. Wencheko, Estimation of the Signal-to-Noise in the Linear
Regression Model. Statistical Papers, 41 (2000), 327–343.
[45] D. Wichern and G. Churchill, A Comparison of Ridge Estimators.
Technometrics, 20 (1978), 301–311.
14. 2098 Y. M. Al-Hassan and M. M. Al-Kassab
[46] K. Yeomans and P. Golder, The Guttman-Kaiser Criterion as a Predictor
of the Number of Common Factors. The Statistician, 31 (1982), 221-229.
Received: January, 2009