IEEE P2P 2009 - Kalman Graffi - Monitoring and Management of Structured Peer-to-Peer Systems

The peer-to-peer paradigm shows the potential to provide the same functionality and quality like client/server based systems, but with much lower costs. In order to control the quality of peer-to-peer systems, monitoring and management mechanisms need to be applied. Both tasks are challenging in large-scale networks with autonomous, unreliable nodes. In this paper we present a monitoring and management framework for structured peer-to-peer systems. It captures the live status of a peer-to-peer network in an exhaustive statistical representation. Using principles of autonomic computing, a preset system state is approached through automated system re-configuration in the case that a quality deviation is detected. Evaluation shows that the monitoring is very precise and lightweight and that preset quality goals are reached and kept automatically.

Empfohlen
Empfohlen
Weitere ähnliche Inhalte
Ähnlich wie IEEE P2P 2009 - Kalman Graffi - Monitoring and Management of Structured Peer-to-Peer Systems
Ähnlich wie IEEE P2P 2009 - Kalman Graffi - Monitoring and Management of Structured Peer-to-Peer Systems (20)
Mehr von Kalman Graffi
Mehr von Kalman Graffi (20)
Kürzlich hochgeladen
Kürzlich hochgeladen (20)
IEEE P2P 2009 - Kalman Graffi - Monitoring and Management of Structured Peer-to-Peer Systems
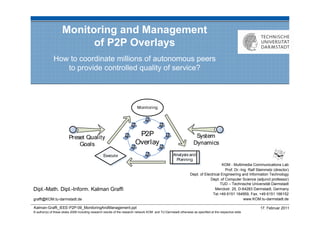
- 1. Monitoring and Management of P2P Overlays How to coordinate millions of autonomous peers to provide controlled quality of service? KOM - Multimedia Communications Lab Prof. Dr.-Ing. Ralf Steinmetz (director) Dept. of Electrical Engineering and Information Technology Dept. of Computer Science (adjunct professor) TUD – Technische Universität Darmstadt Dipl.-Math. Dipl.-Inform. Kalman Graffi Merckstr. 25, D-64283 Darmstadt, Germany Tel.+49 6151 164959, Fax. +49 6151 166152 graffi@KOM.tu-darmstadt.de www.KOM.tu-darmstadt.de Kalman-Graffi_IEEE-P2P-09_MonitoringAndManagement.ppt 17. Februar 2011 © author(s) of these slides 2008 including research results of the research network KOM and TU Darmstadt otherwise as specified at the respective slide
- 2. The Peer-to-Peer Paradigm Peer-to-peer systems Users build infrastructure Service is provided from users to users Peer-to-peer overlays Connecting all peers, providing new functionality H(„my data“) = 3107 1008 1622 2011 709 2207 E.g. Distributed Hash Tables, keyword-based search ? 611 3485 2906 12.5.7.31 peer-to-peer.info planet-lab.org berkeley.edu 61.51.166.150 95.7.6.10 86.8.10.18 7.31.10.25 Evolution of applications / QoS demands File sharing No Quality of Service (QoS) requirements Voice over IP Real-time requirements Video-on-demand Real-time and bandwidth requirements Online community platforms Potential for high user interaction See: K. Graffi, AsKo, et al. “Peer-to-Peer Forschung - Überblick und Herausforderungen” KOM – Multimedia Communications Lab 2 In: it - Information Technology (Methods and Applications of Informatics and Information Technology), vol. 46, no. 5, p. 272-279, July 2007
- 3. Dynamics in P2P System Various scenarios Distributed storage Content delivery User Discovery and contacting of users Application Manage- Dynamics over time ment Overlay Network size Churn Devices Peer heterogeneity Network Peer capacities Connectivity Create a new overlay for every case? No, automated reconfiguring of established overlays! Management of P2P overlays KOM – Multimedia Communications Lab 3
- 4. Problem Statement: Self-X and Automated Reconfiguration System goals are predefined Application and scenario specific e.g. Metric intervals Examples Goal interval for hop count: [7,10] Standard deviation of peer load: max 500% Goal Configuration should adapt to system goals Automated meeting of predefined metric intervals Step 1: Monitor current system state Step 2: Analysis state, plan new parameters Step 3: Distribute and adopt new parameters on all peers KOM – Multimedia Communications Lab 4
- 5. Self-Configuration Cycle in P2P Systems KOM – Multimedia Communications Lab 5
- 6. Monitoring: SkyEye.KOM Monitoring system state Quality requirements Applicable on all (KBR) struct. overlays Performance: precise, fresh, robust Global view on system metrics Costs: lightweight, minimal costs Statistical representation K. Graffi et al. “SkyEye.KOM: An Information Management Over-Overlay for Getting the Oracle View on Structured P2P Systems”Communications Lab KOM – Multimedia IEEE ICPADS 2008 6
- 7. SkyEye.KOM – Architecture Design Decisions Integrated vs. new layer New layer allows wider applicability Reactive vs. proactive System state information is continuously interesting for all users Monitoring topology: bus, ring, star, mesh, tree Tree structure alleviate information aggregation Support for peer heterogeneity: heterogeneous vs. equal roles Load similar for all peers in all positions, no further roles needed Position assignment: dynamic vs. deterministic Deterministic IDs used in topology, dynamically resolved with DHT K. Graffi et al. “SkyEye.KOM: An Information Management Over-Overlay for Getting the Oracle View on Structured–P2P Systems” IEEE ICPADS 2008 7 KOM Multimedia Communications Lab
- 8. Overview on SkyEye.KOM Topology Statistic updates Tree based information architecture Periodically sent to parent peer Uses p2p overlay functionality Aggregated in each node ( same size) [µ,σ,σ²,Σ, min,max] 0,09 0,2 0,3 0,4 0,51 0,6 0,75 0,9 0 1 [µ,σ,σ²,Σ, 50 1 min,max] 10 45 15 40 20 [µ,σ,σ²,Σ, 30 min,max] KOM – Multimedia Communications Lab 8
- 9. Overview on SkyEye.KOM Topology Statistic updates Tree based information architecture Periodically sent to parent peer Uses p2p overlay functionality Aggregated in each node ( same size) [µ,σ,σ²,Σ, 0,09 0,2 0,3 0,4 0,51 0,6 0,75 0,9 min, max] 0 1 [µ,σ,σ²,Σ, 50 1 min, max] 10 45 15 40 20 30 [µ,σ,σ²,Σ, min, max] KOM – Multimedia Communications Lab 9
- 10. Deriving a new Configuration Root is deciding component Metric goals Metrics Analysis Parameter P2P overlay parameterizable and Plan Parameters Monitoring reveals current system state Predefined quality goals given Metric Detects missed quality intervals goal Plans new configuration Current metric Spreads new configuration to all peers using SkyEye.KOM Parameters Peers adopt locally the new rules Prevent configuration oscillation Give time for changes to take effect Introduce execution delay Analyze slope of value history Act only if small, i.e. changes settled KOM – Multimedia Communications Lab 10
- 11. Analysis Point and Configuration Distribution SkyEye.KOM topology SkyEye.KOM aggregates system statistics up the tree Every update message is acknowledged Global view from above Policy of new actions to implement Root has global view and can reach all leafs [µ,σ,σ²,Σ, min, max] Root analyzes and [µ,σ,σ²,Σ, min, max] pushes new configuration down [µ,σ,σ²,Σ, min, max] KOM – Multimedia Communications Lab 11
- 12. Analysis Point and Configuration Distribution SkyEye.KOM topology SkyEye.KOM aggregates system statistics up the tree Every update message is acknowledged Global view from above Policy of new actions to implement Root has global view [µ,σ,σ²,Σ, and can reach all leafs min, max] + new parameter Root analyzes and configuration pushes new configuration down KOM – Multimedia Communications Lab 12
- 13. Simulation Setup Evaluated in PeerfactSim.KOM PeerfactSim.KOM User Simulation Setup Application Simulation Engine IdealDHT: Dispatches messages to responsible peer Manage- ment 5000 Nodes Overlay Delay model: global network positioning Churn model: based on KAD measurements (Steiner et al.) Transport Network Metrics Monitored and real metrics Relative monitoring error Monitoring age Traffic overhead KOM – Multimedia Communications Lab 13
- 14. Monitoring Performance Tree degree = 4 Update interval = 60sec K. Graffi, D. Stingl et al. “Monitoring and Management of Structured P2P Systems” submitted to IEEE P2P 2009 KOM – Multimedia Communications Lab 14
- 15. Monitoring Costs Tree degree = 4 Update interval = 60sec K. Graffi, D. Stingl et al. “Monitoring and Management of Structured P2P Systems” submitted to IEEE P2P 2009 KOM – Multimedia Communications Lab 15
- 16. Case: Chord, Hop Count, Routing Table Size Chord H(„mydata“) = 3107 Classic DHT, provides req. functionality 709 1008 1622 2011 2207 Adapted to consider new configuration ? 611 2906 3485 Parameter: Finger table (FT) size Metric: Hop count (HC) Analysis: Hop count interval [7,10] Plan: Hop count large FT +100% Hop count small FT -10% KOM – Multimedia Communications Lab 16
- 17. Starting with High Hop Count Quick convergence towards preset quality interval Analysis: Too large hop count is detected Finger table size: increase by 100% Initial FT size: 20, at end 80 Quality goal is reached and kept KOM – Multimedia Communications Lab 17
- 18. Starting with Low Hop Count Quick convergence towards preset quality interval Analysis: Too small hop count is detected Finger table size: decrease by 10% Initial FT size: 160, at end 116 Quality goal is reached and kept KOM – Multimedia Communications Lab 18
- 19. Summary Management of P2P overlays Reach and hold preset quality intervals Through system management cycle Coordinated resource usage Through reconfiguration Tunable optimization goals Monitoring: SkyEye.KOM Global view on statistics of running system: avg./std./min./max on all metrics Precise yet cost effective monitoring Analysis / Plan / Execute in Chord Automated rule application Preset quality intervals are reached/hold KOM – Multimedia Communications Lab 19
- 20. Outlook Future work Evaluate cycle in Kademlia Automatically detect rules Parameter-metric correlation Using machine learning and genetic algorithms Implications Allows the usage of P2P overlays “off the shelf” For various scenarios / environments Monitoring and quality control P2P as mature IT architecture Interesting for industry Self-configuration framework can include and consider other functional layers KOM – Multimedia Communications Lab 20
- 21. Questions? KOM – Multimedia Communications Lab 21