24. ghanshyam prasad jhariya
•
0 gefällt mir•57 views

Journal of Global Resources www.isdesr.org

Empfohlen
Empfohlen
Weitere ähnliche Inhalte
Was ist angesagt?
Was ist angesagt? (20)
Ähnlich wie 24. ghanshyam prasad jhariya
Ähnlich wie 24. ghanshyam prasad jhariya (20)
Mehr von Journal of Global Resources
Mehr von Journal of Global Resources (20)
Kürzlich hochgeladen
Kürzlich hochgeladen (20)
24. ghanshyam prasad jhariya
- 1. 154 Journal of Global Resources Volume 6 (01) August 2019-January 2020 Page 154-159 UGC –CARE Listed Journal in Group D ISSN: 2395-3160 (Print), 2455-2445 (Online) 24 LEVEL OF AGRICULTURAL DEVELOPMENT: A BLOCK LEVEL ANALYSIS OF MANDLA: DINDORI REGION, M.P. Ghanshyam Prasad Jhariya Guest Lecturer, Govt. College, Anjaniya, Mandla (M.P.), India Email: jhariyageosgo@gmail.com Abstract: Present research work, level of agricultural development in Mandla-Dindori Region is based on secondary sources of data which is collected from agricultural statistics Madhya Pradesh and district statistical handbook Mandla and Dindori district. The level of agricultural development is determined with the help of fourteen variables. These collected data have been analysed with the help of composite Z-Score method and on the basis of composite score, C.D blocks have been categorised into three categories i.e. high, moderate and low level of agricultural development. Other hand, Karl Pearson’s correlation coefficient techniques has been used to find out the correlation among the variables of agricultural development. Finding portray that most of the CD blocks found in moderate level of agricultural development, while only three blocks have been found high or better condition and three out of sixteen blocks have been under the low level of agricultural development. Deteriorating irrigation system, faulty water management, lack of proper choice of agricultural technology, its proper use and poor infrastructure facilities are found to be the major causes of agricultural backwardness of the region. Key words: Agricultural development, Spatial distribution, Z-Score, Introduction Agriculture is one of the dominant sectors of developing countries in terms of food security, poverty reduction and employment generation (Barik, 2017). Agriculture has a crucial role to national development through the economic and social contribution. Simultaneously agriculture operates as an important social welfare infrastructure in a remote location to creating development opportunities and producing basic necessities for isolated communities. Agriculture provides subsistence occupations for millions and permits people to supply themselves with the three fundamental human needs; food, clothing, and shelter (Stringer, 2001). Indian economy is largely dependent on agriculture and about 17.4 percent of GDP is shared by agriculture and allied sectors (Economic Survey 2015-16, Siddiqui et al, 2017). About 58 percent of rural masses are engaged in this sector serving their livelihood. Agricultural development is much more and multidimensional concept which normally understood. The term agricultural development refers to the growth and overall changes of agriculture resulting in vertical expansion. In present time, when the agriculture is one of the important sources of income, the commercialization of agriculture is an important element of agricultural development. The area under cash crop to the total cropped area may be used for the measure of commercialization of agriculture. The level of agricultural development considered the degree of agrarian structure gets strengthened leading thereby to increased production and reflects the income level of cultivators. The crop productivity is one of vital aspects of agricultural development (Jadhav, 1997). Objectives The primary objective of the present work is to analyse the spatial distribution of agricultural development and to find out the possible causes of the variation in agricultural development and suggest some suitable measures to minimise disparities in agricultural performance in the study region. The Study Area For investigating the problem of agricultural development, the Mandla-Dindori region has been selected. This region, comprising present Mandla and Dindori districts of Madhya Pradesh, extends over an area of 14899 square kilometres (4.83 percent of total geographical area of the state) between 220 12` to 230 22` North latitudes and 800 18` to 810 51` East longitudes (Fig.1). It
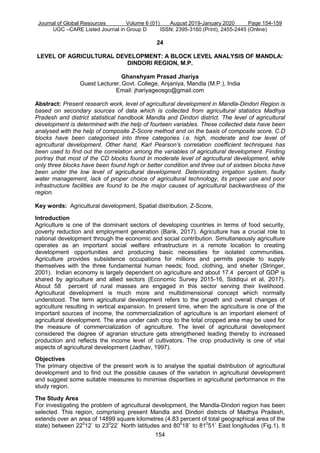
- 2. 155 is entirely highly dissected and hilly tract and lies in the catchment of the Narmada River. The region is bounded on the north by Umaria and Jabalpur, northeast by Anuppur, south by Seoni, west by Balaghat and east by Kabirdham districts of Chhattishgarh state. Administratively region is divided into 8 Tahsils and sixteen development blocks. According to the Census of India 2011, the study region have 17, 57,730 population out of 8, 76,839 was males and 8, 80,901 was females, which is 2.42 percent of total population of Madhya Pradesh. The population density of this region is 138 per Km2 . Average literacy rate was 66.9 percent, male and female literacy rate was 78.55 percent and 55.35 percent respectively. Figure 01: Mandla-Dindori Region Indicators of Agricultural Development Various scholars and Geographers have used different indicators which determine the development of agriculture. They can be grouped them into three classes as Environmental, Technological and Institutional. The environmental, which includes the amount and intensity of rainfall, soil percolation, evaporation, soil fertility and soil erosion, and flood control (Monkhouse and Wilkinson, 1989, Jadhav, 1997). The technological or adoption of new technology comprises the use of improved quality of seeds, fertilizers, irrigation and mechanization which stimulates the crop output by extending or intensifying cropping pattern and enhancing crop productivity (Bawa and Kainth, 1984, Jadhav, 1997). The institutional indicators include the proportion of literate population in agriculture, diversification and commercialization of agriculture, concentration of markets and societies. Sharma (1964, 1972) analysing the level of agricultural development on all India level to selected seventeen indicators to measurement of agricultural development. Same indicators have been employed for the study of Madhya Pradesh by the agro-economic research centre of JNKVV Jabalpur in 1977. Jain C. K. (1988) has been used his study pattern of agricultural development in Madhya Pradesh which incorporates input- output factors. However, they have not considered the social equity and ecological balance aspects, but presenting district wise spatial variation in level of agricultural development. Jadhav (1997) have been used 12 indicators to study the agricultural development of Maharashtra and classified high, medium and low level of agricultural development in Maharashtra. There are some other studies which evaluate the agricultural development, Zahra; Rifat (2007) has been used eleven indicators for the study of North Bihar Plain. Rakesh Raman and Reena Kumari (2012) for Uttar Pradesh, Sakti Mandal and Arijit Dhare (2012) for West Bengal etc. They have selected various indicators for the measure of level of agricultural development in his study. On the basis of some review of previous study, the following indicators have been selected for the measurement of level of agricultural development in the study region.
- 3. 156 Table 01: Selected Indicators for the Measurement of Agricultural Development Indicators Definition X1 X2 X3 X 4 X 5 X 6 X 7 X 8 X 9 X10 X11 X12 X13 X14 Percentage of Irrigated Area to Net Sown Area Cropping Intensity (in percent) Proportion of Cultivators with Cultivated Land Consumption of Fertilizers (Kg/ Hect.) Use of HYV Seeds (Kg/ Hect.) Number of Iron Plough Per Thousand Hectare of Cropped Area Number of Diesel Pump Per Thousand Hectare of Cropped Area Number of Electric Pump Per Thousand Hectare of Cropped Area Number of Tractors Per Thousand Hectare of Cropped Area Number of Tube wells Per Thousand Hectare of Cropped Area Per Capita Production of Cereals (Kg/ Annum) Per Capita Production of Pulses (Kg/ Annum) Per Capita Production of Oilseeds and cash crops (Kg/ Annum) Literacy Rate (Census 2011) Database and Methods For the analysis of level of agricultural development in the study region, secondary data have been used which is collected from various published and unpublished records and reports of government and non-governmental organizations. The basis area unit is community development block, for which published statistics are not available. But several publications were consulted and made use to trace the past trend on tahsil and district levels. Data related to land resources, agricultural production, irrigation and its utilization obtained from the agricultural statistics published by farmer welfare and agricultural department, Govt. of MP Bhopal, and Land records and Settlement, Gwalior, MP, District Land record office of the related districts. On the basis of input and output indicators which considered as the indictors of agricultural development, the developing block wise agricultural development have been analyzed with the help of composite Z- Score Statistical technique. This method was used by Smith in 1968 in his study then by D. Smith (1973) and many scholars. It may be expressed as follows: 𝑍𝑖𝑗 = Xij − Xi 𝜎𝑖 Where, Zij = Standard value of ith indicators in jth unit. Xij= Actual value of ith indicators in jth unit. Xi = Mean value of ith indicators and σi = Standard deviation of ith indicators. After the calculation of standard score of all indictors in all units, the composite score have been calculated by adding all standard score of all units and divided by the number of indicators that called composite score which expressed as: 𝐶𝑆 = 𝛴𝑍𝑖𝑗 𝑁 CS = Composite Score, ΣZij = Z- Score of all indicators in i units and N is the number of indicators. Karl Pearson’s correlation of coefficient technique has been used to show the casual relationship between the variables of agricultural development. Level of Agricultural Development and its Spatial Distribution The composite score of all indicators of every block, the study region have grouped into three categories of high, moderate and low level of agricultural development describes as follows. 1. High Level of Agricultural Development Figure no.02 shows the spatial pattern of level of agricultural development in the study region. There is small area covers by the high level of agricultural development. There is only three blocks showing the high level of agricultural development i. e. Mandla (0.759), Nainpur (0.517) and Bijadandi (0.294). These blocks are use adopted high level of modern tools, higher proportion of irrigated area, and use of HYV seeds for agriculture. 2. Moderate Level of Agricultural Development Maximum blocks (10 blocks) of the study region are found moderate level of agricultural development. These are Karanjiya (0.202), Bajang (0.139), Narayanganj (0.085), Niwas
- 4. 157 (0.028), Dindori (-0.019), Amarpur (-0.028), Mohgaon (-0.081), Samnapur (-0.085), Bichhiya (-0.144) and Mehandwani (-0.209). These blocks are also use moderate level of adoption of modern agricultural tools. Therefore, agricultural development is also moderate. Table 02: The Spatial Pattern of Agricultural Development in Mandla-Dindori Region Category Index Value No. of Blocks Name of the Blocks High > 0.25 3 Mandla, Nainpur, Bijadandi Moderate -0.25- 0.25 10 Karanjiya, Bajang, Narayanganj, Niwas, Dindori, Amarapur, Mohgaon, Samnapur, Bichhiya, Mehandwani Low < -0.25 3 Ghughari, Mawai, Shahpura Source: Calculated by author 3. Low Level of Agricultural Development Three blocks in the study region is found the lowest level of agricultural development i. e. Shahpura (-0.314), Mawai (-0.548) and Ghughari (-0.596). If we see the standard score of indicators in these blocks and found that the shahpura blocks have only three indicators which have positive score i. e. consumption of fertilizer (0.852), per capita production of pulses (0.931) and oilseeds and cash crops (1.090). Mawai and Ghughari blocks found only two indicators which show the positive score. The low level of agricultural development in these blocks is due to the less adoption of modern inputs of agriculture and unfavourable environmental condition. The blocks are also located at far distance from the sub-divisional towns and therefore, due to poor transport facility the farmers are inaccessible to various facilities and subsidies that the governmental bodies are offering to them. Hence, all these negative factors resulting to low level of agricultural development in these blocks. Relationship between the Variables of Agricultural Development The inter correlation matrix among the variables of agricultural development (X1 to X14) have been shown in the table number 03. From the significance test, it is evident that the variable X1 (Percentage of Net Irrigated area) is positively correlated with number of electric pump (X8), number of tractors (X9), number of tube wells (X10), per capita production of cereals (X11) and literacy rate (X14), while it is negatively correlated with only one variable i.e. per capita production of oilseeds and cash crops (X13). On the other hand, variable X2 (Cropping intensity) is significantly correlated with only one variable i.e. literacy rate (X14) and its correlated with other variables is very negligible. The next variable, proportion of cultivators (X3) is negatively correlated with per capita production of cereals (X11) with 5 percent level of significance. The consumption of fertilizers (X4) is strongly and positively correlated with per capita production of pulses (X12), while it is strongly negatively correlated with use of HYV of seeds (X5). The variable X5 (Use of HYV of seeds) is negatively correlated with consumption of fertilizers (X4), per capita production of pulses (X12) and per capita production of oilseeds and cash crops (X13) with 1 percent and 5 percent level of significance. The variable X6 (number of iron plough) is negatively correlated with number of diesel pump (X7) with 5 per cent level of significance. Other hand, it is negligible correlated with other variables. The number of diesel pump (X7) is negatively correlated with only one variable i.e. number of iron plough (X6) with 5 per cent level of significance. The variable X8 (number of electric pump) is strongly positively correlated with percentage of irrigated area (X1), number of tractors (X9), number of tube wells (X10) and literacy rate (X14). The other variable X9 (number of tractors) is positively correlated with percentage of irrigated area (X1), number of tube wells (X10) and literacy rate (X14) with 1 per cent and 5 per cent level of significance. The variable X10 (number of tube wells) is positively correlated with X1 (percentage of irrigated area), X8 (number of electric pump), X9 (number of tractors and X14 (literacy rate) with 1 percent level of significance. The per capita production of cereals (X11) is positively correlated with only one variable i.e. percentage of irrigated area (X1) with 5 percent level of significance, while it is negatively correlated with proportion of cultivators (X3) with 5 per cent of level of significance. Again the variable X12 (per capita production of pulses) is strongly and positively correlated with consumption of fertilizers. Other hand, it is negatively correlated with use of HYV of seeds (X5) with 5 per cent of level of significance.
- 5. 158 Table 03: Correlation Matrix between the Variables of Agricultural Development Source: Calculated by author * Correlation is significant at 5 percent ** Correlation is significant at 1 percent Variables X1 X2 X3 X4 X5 X6 X7 X8 X9 X10 X11 X12 X13 X14 X1 1 X2 0.263 1 X3 0.039 -0.022 1 X4 -0.369 0.058 -0.080 1 X5 0.327 -0.225 0.438 -0.652** 1 X6 0.001 -0.229 0.253 -0.149 0.032 1 X7 -0.087 0.400 0.154 0.198 0.025 -0.550* 1 X8 0.714** 0.396 -0.256 -0.348 0.222 -0.052 -0.054 1 X9 0.500* 0.391 0.255 -0.067 0.246 0.055 0.253 0.497* 1 X10 0.652** 0.416 0.079 -0.065 -0.076 0.023 -0.080 0.648** 0.720** 1 X11 0.568* 0.223 -0.619* -0.078 -0.156 -0.302 -0.160 0.371 -0.085 0.222 1 X12 -0.463 0.091 -0.374 0.732** -0.506* -0.304 0.404 -0.220 -0.293 -0.415 0.029 1 X13 -0.587* 0.025 -0.463 0.428 -0.745** -0.099 0.117 -0.309 -0.450 -0.330 -0.047 0.590* 1 X14 0.705** 0.632** 0.012 -0.103 0.078 -0.152 0.182 0.714** 0.749** 0.800** 0.297 -0.262 -0.375 1
- 6. 159 The per capita production of oilseeds and cash crops (X13) is positively correlated with per capita production of pulses (X12) and there is negatively correlated with percentage of irrigated area (X1) and use of HYV of seeds (X5) with respective significance. The most important and foremost variable literacy rate (X14) is strongly and positively correlated with percentage of irrigated area (X1), cropping intensity (X2), number of electric pump (X8), number of tractors (X9) and number of tube wells (X10), while it is negative relation with consumption of fertilizer (X4), number of iron plough (X6), per capita production of pulses (X12) and per capita production of oilseeds and cash crops (X13). Conclusion Above analysis shows that the region is not stand at better position in terms of agricultural development in the state of Madhya Pradesh. The inter block position is also varied in terms of level of agricultural. As much three out of sixteen blocks is agriculturally well developed, and three blocks is less developed. Other hand, there is maximum blocks ten blocks out of sixteen are moderate developed in terms of agricultural development. The blocks of high agricultural development are concentrated in the western part of the region. The low level of agricultural development blocks found in two areas first is located in northern part and second in located in south central part of the region. Other hand, most of the less developed blocks situated the entire region especially in the eastern part of the region. The maximum part of the study region is found moderate level of agricultural development due to deteriorating irrigation system and faulty water management, low level of agricultural implement adopted by the most small farmers, the desirable of increase agricultural production has been difficult to achieve (Jhariya and Jain, 2018) and poor technical knowledge of the farmers. References 1. Barik, P. (2017). Regional Disparity in Agriculture Development and Food availability Status- An inter-district study of West Bengal. IOSR Journal of Humanities and Social Science (IOSR-JHSS), 22(8), 36-48. doi: 10.9790/0837-2208133648 2. Jadhav, M. G. (1997). Agricultural Development in Maharashtra: A Spatial Interpretation. Transactions of IIG, 19(1), 39-45. 3. Jain, C. K. (1988). Patterns of Agricultural Development in Madhya Pradesh. New Delhi: Northern Book Centre. 4. Jhariya, G. P. & Jain, C. K. (2018). Factors Affecting the Adoption of Modern Farm Practices in the Farmers of Mandla-Dindori Region, M.P. International Journal of Scientific Research and Reviews,7(2), 297-304. 5. Mandal, S. & Dhara, A. (2012). Measurement of Agricultural Productivity and Levels of Development in South 24 Parganas District, West Bengal. International Journal of Agricultural Science and Research, 2(4), 91-98. 6. Rakesh, Raman & Kumari, Reena (2012). Regional Disparity in Agricultural Development: A District Level analysis for Uttar Pradesh. Journal of Regional Development and Planning, 1(2), 71-90. 7. Sharma, P. S. (1964). A Regional Approach to Agricultural Development in India- Some Preliminary Results. Indian Journal of Agricultural Economics, XIX (1), 176-192. 8. Siddiqui, S. H., Afzal, F. & Aktar N. (2017). Levels of Agricultural Development in Dakshin Dinajpur District, West Bengal: A Block Level Analysis. NAIR Journal of Social Science & Humanities (NAIRJSH), 3(11), 189-201. 9. Stringer, Randy (2001). How important are the 'non-traditional' economic roles agriculture in development? Discussion Paper no. 0118, Centre for International Economic Studies. Retrieved from https://pdfs.semanticscholar.org/4523/bbb437e002649fda976ee5296016f3c21532.pdf 10. Zahra, R. (2007). Agricultural Development and Food Security in North Bihar Plain (Ph. D. Thesis). Department of Geography, Aligarh Muslim University, Aligarh. Retrieved from http://shodhganga.inflibnet.ac.in/bitstream/10603/52632