SlideShare ist ein Scribd-Unternehmen logo
1 von 21
CHAPTER 3: RESEARCH DESIGN AND METHODOLOGY
3.0 Introduction
As indicated earlier in chapter two, previous research projects on the evaluation of
environmental performance of buildings have concentrated on either technical aspects or
social aspects. It is therefore important in this research to integrate both dimensions: Energy
audit and a post occupancy evaluation. The combination of both methods will allow for a
more holistic evaluation of the benefits of low energy design in high-rise office buildings.
Energy audits and studies using a mathematical model, energy performance in a certain
climate depends on three types of factor which were identified, as (1) building design, (2)
services design and performance (systems) and (3) occupant behaviour (Baker and Steemer,
2000). The assessment process can help to improve not only the building design but also the
energy consumption and management. The investigations and actions required to improve
building design will also tend to improve energy efficiency, management and occupant
satisfaction (CIBSE, 1999). The factors that influence energy consumption in building are
illustrated in Figure 3.1.
Figure 3.1: Factors that influence energy consumption (Source: CIBSE-Briefing 8, 2003:3)
Climate
 the external
factor
e.g.
automatic
controls
Human Factors
 comfort requirements
 occupancy regimes
 management and maintenance
 activity
 access to controls etc
Building Envelope
 size
 built form
 shape
 materials
 ventilation
 location
 orientation etc
Building Services
 fuels
 type of system
 size of system
 plant controls
 plant efficiency
 operating regime
etc.
e.g. user
control
e.g.
window
controls
Energy efficiency of a building based on bioclimatic principles is determined by a set of
environmental, technical and social factors (Coch, 1998). The climate and the occupants are
other key elements in shaping a building that provides comfort (Roaf et al, 2002). It is
important to consider recording and assessing environmental qualities from the individual’s
point of view and studying the interaction between the individuals and their working
environment (Jones et al., 1997). Human factors need to be carefully considered, as they
have a significant impact on future energy consumption in buildings. Furthermore, there is a
strong interaction between the building envelope, building services and the way people use
buildings. Work spaces in a high-rise commercial development have to have some degree of
humanity, some degree of interest and some use of scale. For example, large sky courts and
terraces might function as communal spaces as well as means of ventilation for the upper
parts of the building. Satisfaction and health at work reflect the interaction between the
individual, the built environment, and the organizational setting within which work is
performed.
3.1 Research Design for Evaluating High Rise Office Blocks in Malaysia
The research first reviewed all the characteristics of bioclimatic buildings in the Malaysian
Peninsula after independence (1957), particularly the traditional Malay house and
conventional buildings and the transformation through time until the dawn of the new
millennium. Secondly, the research studied some detailed planning and architecture of
several design approaches for high-rise building with the objective to consolidate
understanding on the environmental and cultural significance. In order to understand and
compare two different approaches in an appropriate technique, the selection of the case study
buildings (bioclimatic and ceonventional) have to be equal in number. The selected buildings
have to be as similar as possible in terms of size (i.e number of floor and build up area),
share the same external environment, build and completed in about the same era. This will
then shows the diverse development of both types of buildings in different eras and how they
perform in these periods.
A method has been developed to aid in the comparison of and understanding of the
interaction between architectural features and quality levels and between environmental
aspect and satisfaction levels. This technique is known as the quality index and satisfaction
index where buildings can be compared to indicate ‘best achievement’ and reasons for their
good performance or otherwise.
The first research hypothesis desdribes: “High rise office buildings in Malaysia
incorporating bioclimatic design have better environmental performance and consume
less energy than conventional ones”. The research assessed the existing bioclimatic and
conventional buildings by focusing on the design consideration of environmental element
with regard to reduced energy consumption on the following criteria;
 Environmental design – assessed through observation of several architectural features
applied as low energy strategies in both types of building (see chapter 4).
 Energy consumption – evaluated through energy audit of electrical bills for at least a
year period of time and compared the building energy index with the local and regional
standards (see section 4).
 Users’ perception (architectural features) – tested through users’ perception towards
several architectural features in building that has influnces in providing comfort
conditions (see chapter 5 and 6).
The second research hypothesis desdribes: “Bioclimatic buildings create a better working
environment for the users and provide higher level of satisfaction than conventional
ones”. The following criteria were evaluated;
 Environmental conditions – tested through measurement of several environmental
parameters using portable instruments in both typs of building and compare the
conditions in both types of building with related standards for the region (see chapter 7).
 User’s satisfaction (comfort conditions) – measured users’ satisfaction level towards
several environmental performance using several ratings through questionnaires (see
chapter 8).
3.2 Environmental Evaluation
Environmental design focuses on the relationship between people and the built environment.
It has the potential to improve the quality of life for its users. To achieve this, the design
must be sensitive to those who use it. This concept should hold true for design at every scale.
It also involves how the built environment affects the natural one. In areas such as ‘green’
buildings and new urbanism, it is important to look at environmental design both from the
viewpoint of the user and the designer. It is therefore important to measure the
environmental conditions in each case study buildings and let the respondents to evaluate the
existing conditions in their office.
3.3 Building Energy Audits
Building energy audit can be defined as measuring and recording actual energy consumption
at site, of a completed and occupied building, fundamentally for the purposes of reducing
and minimizing energy usage (Hui, 1997). Energy audits identify areas where energy is
being used efficiently or is being wasted (expressed in units of energy, not monetary value),
and highlight areas with the largest potential for energy saving. An energy audit is useful for
establishing consumption patterns, understanding how the building consumes energy, how
the system elements interrelate and how the external environment affects the building.
There are different approaches to conduct a full building energy audit such as an audit of
historical data such as previous electrical bills, survey or detailed investigation and analysis.
Metering strategies is one of the approaches that can be easily adopted to the energy
assessment method (see Figure 3.2). A proper energy audit is useful for more than energy
conservation goals. Energy audits can be employed to assist in areas such as the
establishment of a data bank for consumption records; estimating energy costs and
determining consumption patterns and utility rates, and the establishment of an operational
overview (see Figure 3.3).
Figure 3.2: Energy evaluation approach (metering strategies)
(Source: Jones, 2004:19)
In this study, the energy audit part concentrated on electricity only as there is no gas
consumption in most Malaysian office buildings. The electricity consumption is mostly used
to provide indoor comfort to the users, related to lighting and air conditioning systems in the
building. The amount used in the two different types of high rise office buildings were
Step 1
Take meter readings
Step 2
Calculate consumption
Step 3
Calculate annual totals
Step 4
Calculate performance indicators
Step 5
Compare with benchmark and design
estimates
Step 6
Take action on excessive consumption
compared to check whether there were real energy savings in the bioclimatic high rise office
blocks or not. Figure 3.3 shows the electricity and gas used in building based on the power
supply meter specified for several purposes. However similar types of data were not obtained
in the study because the power supply systems in the buildings of this case study were not
designed following the same approach.
Figure 3.3: Estimated energy usage in an example building
(Source: CIBSE, 2002:17).
3.4 Post Occupancy Evaluation (POE)
Post-occupancy evaluation (POE) is generally defined as the process of systematically
evaluating the degree to which occupied buildings meet user needs and organizational goals
(see Figure 3.4). The POE provides an appraisal of the degree to which a designed setting
satisfies and supports explicit and implicit human needs and values of those for whom a
building is designed (Friedman et al., 1978: Lasch, 2002). Post occupancy evaluation (POE)
has emerged as a formal method of analysis within the past few decades. It began with
academic and government research, but it is slowly finding its way into commercial practice
(Lasch, 2002). These studies method have often relied on surveys, interviews and other user-
oriented studies (Fuller et al., 2001).
Figure 3.4: Post occupancy evaluation techniques
(Summarised from: Jaunzens et al, 2003)
Post occupancy evaluation is based on the idea that better living space can be designed by
asking users about their needs. Information from occupants about their response to buildings
was gathered through questionnaires, interviews, site visits, and observation; sometimes the
information was linked to the physical assessment of a building. The lessons from these
studies were intended to convey what design elements work well, what works best, and what
should not be repeated in future buildings (Federal Facilities Council Staff, 2001).
Performance criteria for POEs for individual buildings are based typically on the stated
design intent and criteria contained in or inferred from a functional program. Measures
include indicators related to organizational and occupant performance, such as worker
satisfaction and productivity, and safety and security, but may also include measures of
building performance as perceived by users such as air quality, thermal comfort, spatial
comfort, ergonomics, privacy, lighting comfort, noise (from the building and offices), and
aesthetics.
Step 1
Questionnaires
Step 2
Interviews
Step 3
Physical Monitoring
Step 4
Observations
In the construction industry, interaction between the human and the built environment has a
strong relationship. Therefore the study measured, recorded and assessed environmental
qualities from the building users’ point of view (Jones et al., 1997). It will compare factual
information about indoor temperature obtained through measurements to users’ perception of
thermal comfort.
There are differences between the quantitative and qualitative aspects of building
performance and the respective performance measures. Many aspects of building
performance are in fact quantifiable, such as lighting, acoustics, temperature and humidity,
durability of materials, amount and distribution of space, and so on. Qualitative aspects of
building performance pertain to the ambiance of a space (i.e., the appeal to the sensory
modes of touching, hearing, smelling, and visual perception, including colour). Furthermore,
the evaluation of qualitative aspects of building performance, such as aesthetic beauty or
visual compatibility with a building’s surroundings, is somewhat more difficult and
subjective and less reliable. The higher the apparent architectural quality and interest of a
building, the more stars it will receive. Recent advances in the assessment methodology for
visual aesthetic quality of scenic attractiveness are encouraging. It is hoped that someday it
will be possible to treat even this elusive domain in a more objective and quantifiable
manner (Nasar, 1988).
Sanders and Collins (1995) performed a post-occupancy evaluation on the Department of
Energy Headquarters Building (the Forrestal Building) in Washington, DC. The lighting in
the building was replaced with new, more energy-efficient, components to meet energy
target guidelines. Occupant responses to the indoor environmental conditions, particularly
the lighting, were studied to determine the impact of the relighting on the building
inhabitants. In addition, physical measures of the lighting and other environmental
conditions before and after the relighting were compared.
The post-occupancy evaluation employed a questionnaire about the environmental
conditions and physical measures of the space (lighting, space, noise, temperature, etc.) A
total of 244/220 people participated (before and after the relighting, respectively). Physical
measures were taken at 100 work stations before the relighting and 75 after. Analysis of the
physical measurement data indicated generally higher lighting levels with more even
distribution of luminance in the offices. Occupant response to the changes in the lighting was
generally quite positive. The relighting was perceived to have improved the appearance of
the building substantially, as well as the lighting within individual workstations.
3.4.1 Physical monitoring
This was done through the field measurements of light levels, noise levels, air temperature,
radiant temperatures and air flow rates. A level of acceptable environment was defined for
comparative purposes and a clear strategy to determine the location of measurements points,
frequencies and duration of monitoring.
3.4.2 Questionnaires
A questionnaire has been designed to record building user’s perceptions of the architectural
qualities of their office building, and their level of satisfaction towards the indoor
environmental qualities such as thermal condition, levels of lighting and ventilation. The
rating for technical elements on architectural features such as service core position, site
building adjustment, wind scope and etc were not included in the questionnaires. It was
considered unsuitable to asked ordinary people (most of the occupants) who do not have
architectural knowledge background. The format of questions used in the questionnaire
resembles most closely the format described in survey research method third edition by
(Fowler, 2001). In this technique, related types of questions that reflect the specific finding
have been set up carefully. Most of the questions asked were adopted from several samples
of questionnaires available in Learning from Our Buildings: A State-of-the-Practice
Summary of Post-Occupancy Evaluation (Federal Facilities Council Staff, 2001). Face to
face interview was officially not allowed by most of the management but it was conducted
informally with a few office workers who had chance to communicate with the researcher in
the office areas where the environmental measurements were taken.
The rating scales used in the questionnaires are shown in table 3.1 and the questionnaires
structures are shown in figure 3.5 and 3.6. The questionnaire is shown in appendix 1.
Table 3.1: Rating scales used in the questionnaires
negative neutral positive
-2 -1 0 1 2
Poor Fair Adequate Good Excellent
negative neutral positive
-3 -2 -1 0 1 2 3
Highly
satisfied
Very satisfied Satisfied Neutral Dissatisfied
Very
dissatisfied
Highly
dissatisfied
ARCHITECTURAL
 BUILDING SPACE
AREA
 Quality
 The general layout of the building
 Adequacy of space
 Flexibility use of space
 Public corridor and accessibility
 Excess to terraces and circulation
 The parking space
 Satisfaction  Public area spaces
 BUILDING
APPEARANCE
 Quality
 Image/prestige/aesthetic value
 Pleasantness of the main entrance
 Landscaping at most of the common
areas.
 Pleasantness of lift lobby area
 Public amenities in the washroom or
restroom
 Ceiling height in your working station
 Satisfaction  Overall appearance of the building
 BUILDING
SERVICES
 Quality
 Interval time for lift service
 Housekeeping and cleaning
 Maintenance in public and private areas
 Satisfaction
 The overall lift services
 Overall housekeeping
 Overall maintenance
 BUILDING
COMPONENTS
 Quality
 The window size in work station
 The window position in work station
 The sky court
 The roof top
 View to the outside (working areas)
 View to the outside (common room)
 Difficult/easy are you in opening/closing
the window
 Satisfaction  window available
Figure 3.5: Questionnaire structure for architectural features
ENVIRONMENTAL
 LIGHTING
NATURAL
 Quality
 Availability at work station
 Availability at lift lobby
 Availability at meeting area
 Availability at rest room
 Availability at corridor/pathway
 overall level of natural lighting
 Satisfaction
 with the natural lighting available in
office
ARTIFICIAL
 Quality
 Availability at work station
 Availability at lift lobby
 Availability at meeting area
 Availability at rest room
 Availability at corridor/pathway
 overall level of artificial lighting
(electric) lighting
 Satisfaction
 with the artificial lighting available in
office
 VENTILATION
NATURAL
 Quality
 Availability at work station
 Availability at lift lobby
 Availability at meeting area
 Availability at rest room
 Availability at corridor/pathway
 Overall level air movement from natural
ventilation
 Satisfaction
 with the natural ventilation available in
office
ARTIFICIAL
 Quality
 Availability at work station
 Availability at lift lobby
 Availability at meeting area
 Availability at rest room
 Availability at corridor/pathway
 Overall level air movement from air
conditioner
 Satisfaction  with the air movement from the air
conditioner
 THERMAL COMFORT  Quality
 At working station
 At the lift lobby
 At meeting area
 At rest room
 At corridor or pathway
 Overall thermal condition
 Satisfaction  with the thermal condition in the office
 ACOUSTIC  Quality
 At working station
 At the lift lobby
 At meeting area
 At rest room
 At corridor or pathway
 Overall noise level
 Satisfaction  with the noise level in office
 OVERALL
 How happy are you working in this
building
 How satisfied are you with your work
environment
Figure 3.6: Questionnaire structure for environmental features
3.4.3 Observation
The researcher has to carry out direct observations of the various architectural qualities of
the spaces where the measurements are taken in order to relate these to the data collected.
Observation on various aspects such as space use audits, energy walkabouts and architectural
attributes was carried out on one area in detail during the field study. Observation on a
specific office room and the common areas of the building where the environmental
measurements were done has also to be observed. The summary of methodology and
required data or information for case studies can be illustrated as in Figure 3.7 - 3.8.
Figure 3.7: Adopted research methodology
Figure 3.8: Case study information and required data
3.5 Data Collection
This section describes the design of the field work carried out by the author in Malaysia.
Field work was carried out between July 2005 and September 2005, during which
questionnaires were distributed to the occupants in two different types of office buildings in
order to record their perceptions of the environmental qualities of their working space. The
collection of subjective data (recording the perception of the office space by its occupants
and their level of satisfaction) allowed for a subjective data analysis.
Direct observations were carried out by the authors on various architectural aspects of the
buildings attributes. A project checklist was developed to indicate elements related to
environmental design strategies. Indoor air temperature, relative humidity, air velocity, light
level and noise level were measured on a selected floor where the questionnaires were
distributed. All buildings were sub divided into three zones; lower, middle and higher. The
selection of the measurement floors in each zone was normally suggested by the building
manager. Measurements were taken at several points (3 or 4) on the respective floor areas on
an hourly basis for air temperature, relative humidity and air velocity whereas for light level
and noise level measurement were recorded for every two hour.
The user’s satisfaction data was gathered via questionnaires which were distributed to the
building occupiers, mainly in the open plan office spaces. In the questionnaire, respondents
were asked to give their opinion on the architectural and environmental qualities of their
building. They were also required to express their level of satisfaction with the lighting,
ventilation and thermal comfort in their particular office space. The sample consisted of a
third of the occupants. A reasonable number of questionnaires were distributed randomly to
the staff and those returned were about 35% of the total distributed.
3.5.1 Objectives of the field study
The objective of the field study was to determine user’s perceptions towards their
satisfaction working in the designed environment and to determine the amount of energy
used to create the indoor environment condition. This data was used to derive a conclusion
for the research hypothesis as mentioned in chapter 1.
3.5.2 Methodology of the field study
From the review derived from several methodologies used in office environment studies
done by previous researchers, the questionnaire is the best tool to gather information from
the building occupants. Several equipment matched most closely to the required tool for
present study was used to obtained environmental data. Some measured data by previous
researchers has also been considered as additional options to this adopted method.
3.5.3 Preparation for the fields study
In the beginning of March 2005, the building managers of all selected buildings were
contacted to obtain permission to carry out the study in their premises. A brief explanation of
the type of data required and the level of cooperation needed were also mentioned in the
corresponding letter. A month later only two managers gave a positive response after the
corresponding letters were sent off, whereas the other six remained silent. Worried that miss
communication might have happened, a second round of correspondence was sent off to the
respective building managers.
Since the buildings are both in Penang, the tentative program for field studies were then
planned to be started in Penang followed by Kuala Lumpur. In the end of June 2005 the
researcher flew to Kuala Lumpur. It was expected that the building managers would be
easier to contact while in Malaysia rather than in the United Kingdom. Several follow ups
via email and telephone conversations were made upon arrival to Malaysia, first to confirm
the visit to the permitted building in Penang before the field work started and second, to get
permission for the remaining six buildings.
In the meantime, preparation for the questionnaires and data log book was finalised. The
application for borrowing suitable portable equipment for environmental measurement from
Building Services Laboratory, University Tun Hussein Onn Malaysia (UTHM) was also
approved. About 800 copies of the questionnaire were printed before the first phase started.
Inspection of all portable equipment for environmental data measurement was done to ensure
their workability and calibration to a standard. A training session for equipment handling
was done at the same time. It was presented by the Building services technician in the
presence of the Head of Building Services Laboratory.
There were managers who did not confirm their decision whether or not to permit the field
work in their building even after the first phase of the field work was completed. The process
took several weeks to get them to agree and changes of the actual date were made several
times before a mutual confirmation could be obtained. It is probably due to the busy nature
of these professionals that the process of obtaining permission was not that easy. At the end
of the period, only six buildings were granted and the other two buildings were dropped from
the list due to several circumstances. Initially there were eight buildings selected which
included Menara Daya Bumi and Plaza Sentral in Kuala Lumpur. Despite eight buildings,
only six of them were permitted for case study namely Menara UMNO, Menara Mesiniaga,
Menara IBM, Menara KOMTAR, Menara TIMA and Menara LUTH.
3.5.4 Environmental Parameters Measurement
Five environmental parameters were to be taken in the field studies which include air
temperature, relative humidity, air velocity, light intensity level (Brightness) and sound level.
These parameters were selected to evaluate the conditions of thermal, visual and sound that
were also evaluated by the respondents.
Air Temperature, Ta (°C)
Air temperatures were measured using a Hygro-Thermo-Anemometer. It is a dual display of
air velocity and temperature or humidity and temperature with built-in RS-232 PC interface.
It is a battery operated instrument and has a combined temperature and humidity probe that
can measure air temperatures within the range of 0°C to +50°C (32o
F to 122o
F) with a
resolution and accuracy of 0.1° and ±0.8o
C (±1.5°F) respectively.
Relative Humidity, RH (%)
Relative humidity in the offices was measured using the same equipment for air temperature,
the Hygro-Thermo-Anemometer. By using the same probe (combined temperature and
humidity probe), the relative humidity could be measured within the range of 10% to 95%
with a resolution of 0.1% and accuracy of ±3%.
Air Velocity, V (m/s)
Using the same equipment for air temperature and relative humidity measurements, the
Hygro-Thermo-Anemometer was used to measure air velocity in the offices. This time a
different type of probe was used which is a combined air velocity and temperature probe
(vane probe). With this probe, the anemometer could sense air flow from any direction and at
the same time read the room temperature. The instrument acted as an instant action
anemometer with a capability to measure air velocity ranging from 0.4 m/s to 25.0 m/s with
a resolution of 1 m/s and accuracy of ±(2% + 1d).
Light Intensity Level (Brightness) Lux
The brightness level was measured using a Hand Held Light Meter (LX-102 Lux Meter). It
is a battery operated instrument and capable of detecting brightness ranges from 0 to 50,000
Lux with accuracy of ± 5% and 0-200mV recorder output (1mV/count)
Sound Level dB(A)
The sound level was obtained by Extech Integrating Sound Level Data logger. It is a battery
operated instrument capable of detecting sound ranges from 0dB to 140dB with a resolution
and accuracy of 0.1dB and ±1.5dB respectively.
Selection of equipment was limited to that available in the Building Services Laboratory,
University Tun Hussein Onn Malaysia (UTHM). The equipment used in the field work and
their specification are shown in appendix 2.
3.5.5 Data Gathered In the Field Study
Basically there are three types of data obtained which fall into the following categories,
user’s satisfaction, environmental condition and energy consumption. The user’s satisfaction
data was gathered via questionnaires which were distributed to the building occupiers who
work and stationed in the office. In the questionnaires, respondents were asked to give their
opinion on the architectural aspects of the building. They were also required to express their
satisfaction level toward thermal, ventilation, lighting and acoustic condition in the building.
Only indoor environmental data were obtained from the field study. Measured parameters for
environmental data included the air temperature (Ta), relative humidity (RH) and air velocity
(V). Despite that, sound levels as well as light level were also measured in Lux and Decibel
unit respectively. In each building, these were measured on a selected floor in each zone
(lower, middle and upper) where the questionnaires were distributed. It was done while
waiting for the questionnaires to be ready for collection. The energy consumption data were
collected from the maintenance office upon completion of the environmental measurement.
A year period of monthly electrical bills were sorted and duplicated for this purpose.
Detailed energy used for each plant was not available since the metering system used was
not supported for this type of measurement.
What Data Involved
1. Architectural data (Observation)
2. Environmental data (Measurement – portable equipments)
3. Energy data (Management record – building energy management systems record for one
year - utilities bills monthly basis)
4. Post occupancy evaluation (Questionnaires – user’s perception)
Who Involved
1. Researchers
 Observe the Architectural Design
 Measure the Environmental Condition (Indoor)
2. Building manager
 Provide Energy data from the building energy management systems record.
a. Utilities bills (i.e: electricity, gas, water & etc.)
b. Schematic drawing of the plants.
c. Building layout plan, section, elevation etc.
d. Rate the building based on the given indicators.
3. Building Users
 Fill in questionnaires for user’s satisfaction.
 Participate in interviews about user’s satisfaction.
Table 3.2: Data obtained in the fieldworks
DataBuildings UM MN IB KT TM LU
1. Building plan & drawing √ √ √ √ √ √
2. Electric bills (one year) √ √ X √ √ √
3. Questionnaires 23 29 20 46 39 18
4. Indoor environmental data
Air Temperature √ √ √ √ √ √
Air Velocity √ √ √ √ √ √
Relative humidity √ √ √ √ √ √
Light Meter √ √ √ √ √ √
Sound Meter Level √ √ √ √ √ √
UM – Menara UMNO MN – Mesiniaga Tower IB – IBM Plaza
KT – KOMTAR Tower TM – Tun Ismail Mohd Ali LU – LUTH Tower
Data Obtained
In summary, it can be said that the field work return with various types of data can be
classified into the following categories; (1) Users’ Satisfaction Data (Questionnaires), (2)
Environmental Data, (3) Energy Consumption and (4) Architectural Observation. Each
category has a specific analytical technique which is explained in the next section. All data
obtained in the fieldworks is summarised in Table 3.1.
Challenges
1. Difficult to get the right contact person
Building operator gave inappropriate information about the right person in charge to be
contacted for getting the permission. The bureaucracy system incurred further delays for
approval.
2. Communication breakdown
Most of the managers said they had not received any correspondence letter that we sent a
few months earlier requesting permission to use the building for the case study. At one
building the manager said she had already appointed one of her staff to respond to our
letter but unfortunately the person resigned before we came.
3. Difficulty in getting permission from the superior for interview session.
The reason given was that their members of staff were very busy at that time and could
not be disturbed. It will disconcert the operation of their department or the company.
Most of the occupants were not interested or available for interview and we would have
to carry out the interview indirectly without having a proper session or visual recorded.
4. Inflexibility of movement in certain building
We were accompanied by the maintenance staff and sometimes the security guard. Our
movements were quite limited at particular buildings where commitments from the
guard were unreceptive.
5. Changes of building
The manager for PNB tower disapproved our request to conduct the study in that
particular building but offered another building that meets the criteria which is Tun
Ismail Mohd Ali Tower owned by PNB.
3.6 Data Analysis Techniques
As there were several types of data obtained from the field work, coming in many forms, it is
important to organise all the data into a suitable medium for easy record, analysis and
presentation. Several computer software packages were used to record, analyse and process
the collected data depending on how complex the data was and how suitable the software
with the size and form of the data.
3.6.1 Questionnaires
All information gathered through questionnaires were analysed using a computer software
program SPSS 14 (Statistical Package for the Social Sciences) available at University of
Liverpool and can be eccessed though personal computer provided by the department of
Architecture. It is a well known established software system for data management and
analysis. SPSS may be used for many univariate and multivariate statistical analyses and has
facilities for sorting and merging files and manipulating data. The result from SPSS were
then transformed into MS excel and office for publication purposes. Not all architectural data
were published in this thesis. Only the most relevant elements were discussed in the next two
chapters and were re-organised into new categories as shown in figure 3.9.
Figure 3.9: Analysis diagram for architectural elements
In any data set collected there may be some amount of error and it is very important to
minimise this error so that the data obtained provide a more accurate reflection of the truth.
In survey research, error comprises two components: random error and measurement error.
Random error is the unpredictable error that occurs in all research. It may be caused by many
different factors but is affected primarily by sampling techniques. To lower the chance of
random error, a larger and more representative sample should be selected but this may
increases the cost of the study and is time consuming. It is often neither practical nor feasible
simply to expand the sample. Instead statistics are used to calculate the probability that a
particular result is due to random error. If that probability falls below the set limit, then reject
the null hypotheses and draw inferences about the population. Null hypothesis is a
conservative assumption in statistical analysis, is made that the two groups of interest do not
differ in the particular variable being studied. The survey research would be designed to try
and reject that null hypothesis.
3.6.1.1 Reliability Analysis
In research, the term reliability means ‘repeatability’ or ‘consistency’. A measure is
considered reliable if it would give us the same result over and over again (William and
Trochim, 2006). If measurement error refers to how well or poorly a particular instrument
performs in a given population, reliability is a statistical measure of how reproducible the
survey instrument’s data are (Litwin, 1995). There is no survey instrument or test is perfectly
reliable, but some are more reliable than others. When evaluating the value of a data set, it is
important to look at the reliability characteristics of the measurement instrument.
Reliability analysis was used to study the properties of measurement scales and the items
that make them up. The reliability analysis procedure calculates a number of commonly used
measures of scale reliability and also provides information about the relationships between
individual items in the scale. Reliability is commonly assessed in three forms: test-retest,
alternate-form and internal consistency. Test-retest reliability is the most commonly used
indicator of survey instrument reliability. It is measured by having the same set of
respondents complete a survey at two different points in time to see how stable the responses
are. Alternate-form reliability involves using differently worded items to measure the same
attribute without changing the meaning of the questions. Two different forms may be
administered at separate time points to the same population.
Internal consistency reliability is another commonly used psychometric measure in assessing
survey instruments and scales. It is applied not to a single item but to groups of items that are
thought to measure different aspects of the same concept. Internal consistency is an indicator
of how well the different items measure the same issue. The internal consistency reliability
test is the most appropriate approach for reliability test on the survey instrument used in this
study. It is measured by calculating a statistic known as Cronbach’s coefficient alpha (named
for the 20th
century psychometrician who first reported it in 1951). Coefficient alpha
measures internal consistency reliability among a group of items combined to form a single
scale. It is a statistic that reflects the homogeneity of the scale and is a reflection of how well
the different items complement each other in their measurement of different aspects of the
same variable of quality.
3.6.1.2 Chi-Square Test (χ2
)
Is observed association true (holds for population at large); or false (arises in sample only
due to random chance)? Due to sampling error we can’t be sure that an apparent relationship
between two variables is a real one. For example, is the relationship we have observed
between employment status and political allegiance real or simply a sampling artefact?
Impossible to tell – any association can arise by chance. This relates to the notion of truth
(Williamson, 2004). The rationale behind the χ2 test is that if the two variables are not
related (i.e. gender is not related to satisfaction towards number of parking spaces) then we
should have the same proportion of men and women satisfied with the number of parking
spaces. There may be a difference in the proportions due to pure chance, but (depending on
the sample size) this difference must be small. Consequently, if the difference between the
two proportions is very large, then we would be led to conclude that there is some
association between gender and satisfaction towards number of parking spaces.
3.6.1.3 The Level of Significance
The level of significance is the threshold that is used to decide if an observed difference in
the sample was unlikely to have been observed by chance and hence to reject the null
hypothesis. The level of significance is expressed as a probability and is often taken to be
0.05. This may also be described as significant at the 5% or 95% level, or displayed as
p<0.05. A significance level of 0.05 implies that a difference extreme enough to reject the
null hypothesis by chance when the null hypothesis is actually true will be observed one time
in twenty. It is possible to test the significance at the 10% (p<0.10) or 1% (p<0.01) levels.
Each statistical test has a distribution called sampling distribution. Its mean is called the
expected value and its variability is called the standard error. All statistic distributions are
divided into an area of rejection and an area of acceptance. Tabular value in a distribution
will show that the area of acceptance for the null hypothesis is the central 95% of the
distribution and that rejection area are the 2.5% of the area in each tail. The value that
defines this area is -1.96 for the lower tail and +1.96 for the upper tail. If this statistic is less
than -1.96 or greater than +1.96, it will be rejected.
3.6.2 Environmental & Energy Consumption Data
The environmental data obtained in the field work are not as complex as the questionnaires
data and were well recorded during collection in a set of data booklet. Later it was analysed
using MS Excel and transformed into MS Word. Basically the entire monthly electrical bills
for a period of one year were duplicated from the management office. The bills were later
transformed into a simplified table that was easy to understand in MS Excel before being
transferred into MS Word format for this purpose.
3.7 Summary and Conclusion
While primarily directed at finding out how to improve energy performance in tropical
buildings, the focus should have a direction towards sustainable building design and improve
the environment for their users. This research combines both technical and social factors in
the investigation of high rise office buildings in tropical climates. Focusing on the dense
urban development area where energy was used enormously especially in high rise office
building may be the best lesson. The research carried out thorough review on the design
concept of sustainable building in tropical climate and obtains descriptive data from building
occupiers as well as numerical data from the management in several numbers of bioclimatic
and conventional skyscrapers available in Malaysia.
The aim of the research is to conduct a systematic evaluation of a sample of conventional
and bioclimatic high rise office blocks in two major cities in Malaysia. The benefits (or
otherwise) of introducing bioclimatic features in the design of high-rise office blocks will be
highlighted. Upon its completion, this study will contribute to advanced knowledge on the
claimed advantages (both environmental and social) linked to bioclimatic high rise office
buildings.

Weitere ähnliche Inhalte

Was ist angesagt?

Spp 202-regular design services
Spp 202-regular design servicesSpp 202-regular design services
Spp 202-regular design services
Melvin Patawaran
 
BAUTISTA_ARIANE JOY R_ Global Practice of Architecture in the 21st Century.pdf
BAUTISTA_ARIANE JOY R_ Global Practice of Architecture in the 21st Century.pdfBAUTISTA_ARIANE JOY R_ Global Practice of Architecture in the 21st Century.pdf
BAUTISTA_ARIANE JOY R_ Global Practice of Architecture in the 21st Century.pdf
arianebautista1
 
How effective is double skin façade in preventing building heat loss
How effective is double skin façade in preventing building heat lossHow effective is double skin façade in preventing building heat loss
How effective is double skin façade in preventing building heat loss
Darwin Jayson Mariano
 
Implementing Rules and Regulations of Republic Act no. 9266
Implementing Rules and Regulations of Republic Act no. 9266Implementing Rules and Regulations of Republic Act no. 9266
Implementing Rules and Regulations of Republic Act no. 9266
Marla Mendoza
 
Spp 203-specialized archl services
Spp 203-specialized archl servicesSpp 203-specialized archl services
Spp 203-specialized archl services
Melvin Patawaran
 
How to write architectural thesis
How to write architectural thesisHow to write architectural thesis
How to write architectural thesis
Pranay Kumar Tode
 

Was ist angesagt? (20)

Site planning
Site planningSite planning
Site planning
 
Post Occupancy Evaluation (POE)
Post Occupancy Evaluation (POE)Post Occupancy Evaluation (POE)
Post Occupancy Evaluation (POE)
 
Site Planning- Principles and Considerations
Site Planning- Principles and Considerations Site Planning- Principles and Considerations
Site Planning- Principles and Considerations
 
Spp 202-regular design services
Spp 202-regular design servicesSpp 202-regular design services
Spp 202-regular design services
 
Lecture 12 Theories of Urban Spatial Design
Lecture 12 Theories of Urban Spatial DesignLecture 12 Theories of Urban Spatial Design
Lecture 12 Theories of Urban Spatial Design
 
Case Study of Tropical Design of an Architect
Case Study of Tropical Design of an ArchitectCase Study of Tropical Design of an Architect
Case Study of Tropical Design of an Architect
 
Architectural Design Concepts Approaches - كونسيبت التصميم المعمارى و الفكرة ...
Architectural Design Concepts Approaches - كونسيبت التصميم المعمارى و الفكرة ...Architectural Design Concepts Approaches - كونسيبت التصميم المعمارى و الفكرة ...
Architectural Design Concepts Approaches - كونسيبت التصميم المعمارى و الفكرة ...
 
BAUTISTA_ARIANE JOY R_ Global Practice of Architecture in the 21st Century.pdf
BAUTISTA_ARIANE JOY R_ Global Practice of Architecture in the 21st Century.pdfBAUTISTA_ARIANE JOY R_ Global Practice of Architecture in the 21st Century.pdf
BAUTISTA_ARIANE JOY R_ Global Practice of Architecture in the 21st Century.pdf
 
How effective is double skin façade in preventing building heat loss
How effective is double skin façade in preventing building heat lossHow effective is double skin façade in preventing building heat loss
How effective is double skin façade in preventing building heat loss
 
Implementing Rules and Regulations of Republic Act no. 9266
Implementing Rules and Regulations of Republic Act no. 9266Implementing Rules and Regulations of Republic Act no. 9266
Implementing Rules and Regulations of Republic Act no. 9266
 
Shell structure
Shell structureShell structure
Shell structure
 
Presentation of urban design
Presentation of urban designPresentation of urban design
Presentation of urban design
 
Community Architecture
Community ArchitectureCommunity Architecture
Community Architecture
 
Perception in architecture
Perception in architecturePerception in architecture
Perception in architecture
 
Residential Condominium
Residential CondominiumResidential Condominium
Residential Condominium
 
Variety-Urban Design
Variety-Urban DesignVariety-Urban Design
Variety-Urban Design
 
Spp 203-specialized archl services
Spp 203-specialized archl servicesSpp 203-specialized archl services
Spp 203-specialized archl services
 
Contextual Response in Architecture
Contextual Response in ArchitectureContextual Response in Architecture
Contextual Response in Architecture
 
Site Planning
Site PlanningSite Planning
Site Planning
 
How to write architectural thesis
How to write architectural thesisHow to write architectural thesis
How to write architectural thesis
 

Andere mochten auch

Chapter 3 research methodology 1
Chapter 3 research methodology 1Chapter 3 research methodology 1
Chapter 3 research methodology 1
razalibmuda
 
Sample Methodology
Sample MethodologySample Methodology
Sample Methodology
Aiden Yeh
 
98年教育部專案期末報告(2010.7.8)
98年教育部專案期末報告(2010.7.8)98年教育部專案期末報告(2010.7.8)
98年教育部專案期末報告(2010.7.8)
chungshiaolan
 
11.27 Methodology
11.27 Methodology11.27 Methodology
11.27 Methodology
lisahung
 

Andere mochten auch (20)

Chapter iii
Chapter iiiChapter iii
Chapter iii
 
Chapter 3
Chapter 3Chapter 3
Chapter 3
 
Chapter 3 research methodology 1
Chapter 3 research methodology 1Chapter 3 research methodology 1
Chapter 3 research methodology 1
 
Chapter 3
Chapter 3Chapter 3
Chapter 3
 
Chapter 3(methodology) Rough
Chapter  3(methodology) RoughChapter  3(methodology) Rough
Chapter 3(methodology) Rough
 
Writing chapter 3
Writing chapter 3Writing chapter 3
Writing chapter 3
 
Manelyn L. Mananap Thesis (Chapter 3)
Manelyn L. Mananap Thesis (Chapter 3)Manelyn L. Mananap Thesis (Chapter 3)
Manelyn L. Mananap Thesis (Chapter 3)
 
Research problem
Research problemResearch problem
Research problem
 
Sample Methodology
Sample MethodologySample Methodology
Sample Methodology
 
98年教育部專案期末報告(2010.7.8)
98年教育部專案期末報告(2010.7.8)98年教育部專案期末報告(2010.7.8)
98年教育部專案期末報告(2010.7.8)
 
11.27 Methodology
11.27 Methodology11.27 Methodology
11.27 Methodology
 
通識心理_1050302_2_心理學史簡介_楊政達
通識心理_1050302_2_心理學史簡介_楊政達通識心理_1050302_2_心理學史簡介_楊政達
通識心理_1050302_2_心理學史簡介_楊政達
 
Planning building & operating 3rd party warehousing
Planning building & operating 3rd party warehousingPlanning building & operating 3rd party warehousing
Planning building & operating 3rd party warehousing
 
statistics
 statistics statistics
statistics
 
Chapter 3
Chapter 3Chapter 3
Chapter 3
 
Framing research question and formulating hypothesis for
Framing research question and formulating hypothesis forFraming research question and formulating hypothesis for
Framing research question and formulating hypothesis for
 
field work
field workfield work
field work
 
Chapter3
Chapter3Chapter3
Chapter3
 
Local Search Marketing, Online Advertising and Social Media Marketing
Local Search Marketing, Online Advertising and Social Media MarketingLocal Search Marketing, Online Advertising and Social Media Marketing
Local Search Marketing, Online Advertising and Social Media Marketing
 
Research Design
Research DesignResearch Design
Research Design
 

Ähnlich wie Chapter 3 research design and methodology

Green Building Awareness HVAC
Green Building Awareness HVAC Green Building Awareness HVAC
Green Building Awareness HVAC
AKSHAY SHARMA
 
Comparative Study on Day Lighting & Energy Modeling For Conventional and Gree...
Comparative Study on Day Lighting & Energy Modeling For Conventional and Gree...Comparative Study on Day Lighting & Energy Modeling For Conventional and Gree...
Comparative Study on Day Lighting & Energy Modeling For Conventional and Gree...
inventionjournals
 
I3CON Newsletter #2
I3CON Newsletter #2I3CON Newsletter #2
I3CON Newsletter #2
lk314
 
Anthony Linka Green Building Design, Construction, and Safety BCN4709C
Anthony Linka Green Building Design, Construction, and Safety BCN4709CAnthony Linka Green Building Design, Construction, and Safety BCN4709C
Anthony Linka Green Building Design, Construction, and Safety BCN4709C
Anthony Linka
 
Analysis Of Solar Radiation Towards Optimization and Location Of The Urban Bl...
Analysis Of Solar Radiation Towards Optimization and Location Of The Urban Bl...Analysis Of Solar Radiation Towards Optimization and Location Of The Urban Bl...
Analysis Of Solar Radiation Towards Optimization and Location Of The Urban Bl...
IEREK Press
 

Ähnlich wie Chapter 3 research design and methodology (20)

ESTABLISHING PROCESS FOR DESIGNING OF ENERGY EFFICIENT BUILDINGS
ESTABLISHING PROCESS FOR DESIGNING OF ENERGY EFFICIENT BUILDINGS ESTABLISHING PROCESS FOR DESIGNING OF ENERGY EFFICIENT BUILDINGS
ESTABLISHING PROCESS FOR DESIGNING OF ENERGY EFFICIENT BUILDINGS
 
Institutional smart buildings energy audit
Institutional smart buildings energy auditInstitutional smart buildings energy audit
Institutional smart buildings energy audit
 
Analysis of building performance evaluation and value
Analysis of building performance evaluation and valueAnalysis of building performance evaluation and value
Analysis of building performance evaluation and value
 
Green building presentation.pptx
Green building presentation.pptxGreen building presentation.pptx
Green building presentation.pptx
 
Green Building Awareness HVAC
Green Building Awareness HVAC Green Building Awareness HVAC
Green Building Awareness HVAC
 
Comparative Study on Day Lighting & Energy Modeling For Conventional and Gree...
Comparative Study on Day Lighting & Energy Modeling For Conventional and Gree...Comparative Study on Day Lighting & Energy Modeling For Conventional and Gree...
Comparative Study on Day Lighting & Energy Modeling For Conventional and Gree...
 
I3CON Newsletter #2
I3CON Newsletter #2I3CON Newsletter #2
I3CON Newsletter #2
 
Analysis of Cost Effective and Energy Efficient Residential Building Using BI...
Analysis of Cost Effective and Energy Efficient Residential Building Using BI...Analysis of Cost Effective and Energy Efficient Residential Building Using BI...
Analysis of Cost Effective and Energy Efficient Residential Building Using BI...
 
E021201041047
E021201041047E021201041047
E021201041047
 
ENERGY ANALYSIS OF SMITHA MEMORIAL CANCER, THODUPUZHA CENTER USING BIM TECHNO...
ENERGY ANALYSIS OF SMITHA MEMORIAL CANCER, THODUPUZHA CENTER USING BIM TECHNO...ENERGY ANALYSIS OF SMITHA MEMORIAL CANCER, THODUPUZHA CENTER USING BIM TECHNO...
ENERGY ANALYSIS OF SMITHA MEMORIAL CANCER, THODUPUZHA CENTER USING BIM TECHNO...
 
ASSESSMENT OF THE GREEN AND ENERGY SAVING TECHNOLOGY IN THE CONSTRUCTION OF A...
ASSESSMENT OF THE GREEN AND ENERGY SAVING TECHNOLOGY IN THE CONSTRUCTION OF A...ASSESSMENT OF THE GREEN AND ENERGY SAVING TECHNOLOGY IN THE CONSTRUCTION OF A...
ASSESSMENT OF THE GREEN AND ENERGY SAVING TECHNOLOGY IN THE CONSTRUCTION OF A...
 
Energy efficient building
Energy efficient buildingEnergy efficient building
Energy efficient building
 
Green Ratings of Residential Buildings: Survey, Analysis and Suggestions
Green Ratings of Residential Buildings: Survey, Analysis and SuggestionsGreen Ratings of Residential Buildings: Survey, Analysis and Suggestions
Green Ratings of Residential Buildings: Survey, Analysis and Suggestions
 
Optimization of the Building Energy Performance through Dynamic Modeling, Sys...
Optimization of the Building Energy Performance through Dynamic Modeling, Sys...Optimization of the Building Energy Performance through Dynamic Modeling, Sys...
Optimization of the Building Energy Performance through Dynamic Modeling, Sys...
 
Anthony Linka Green Building Design, Construction, and Safety BCN4709C
Anthony Linka Green Building Design, Construction, and Safety BCN4709CAnthony Linka Green Building Design, Construction, and Safety BCN4709C
Anthony Linka Green Building Design, Construction, and Safety BCN4709C
 
Analysis Of Solar Radiation Towards Optimization and Location Of The Urban Bl...
Analysis Of Solar Radiation Towards Optimization and Location Of The Urban Bl...Analysis Of Solar Radiation Towards Optimization and Location Of The Urban Bl...
Analysis Of Solar Radiation Towards Optimization and Location Of The Urban Bl...
 
Energy simulation & analysis of two residential buildings
Energy simulation & analysis of two residential buildingsEnergy simulation & analysis of two residential buildings
Energy simulation & analysis of two residential buildings
 
Building Services.pptx
Building Services.pptxBuilding Services.pptx
Building Services.pptx
 
A Review Paper on Retrofitting of Institutional Building into Green Building ...
A Review Paper on Retrofitting of Institutional Building into Green Building ...A Review Paper on Retrofitting of Institutional Building into Green Building ...
A Review Paper on Retrofitting of Institutional Building into Green Building ...
 
N033065072
N033065072N033065072
N033065072
 

Mehr von Lokman Hakim Ismail

Mehr von Lokman Hakim Ismail (19)

Positive Power
Positive Power Positive Power
Positive Power
 
Student Development Center SDC@P3P 2017
Student Development Center SDC@P3P 2017Student Development Center SDC@P3P 2017
Student Development Center SDC@P3P 2017
 
Peranan Keselamatan Dalam Membangunkan Pelajar Holistik
Peranan Keselamatan Dalam Membangunkan Pelajar HolistikPeranan Keselamatan Dalam Membangunkan Pelajar Holistik
Peranan Keselamatan Dalam Membangunkan Pelajar Holistik
 
References
ReferencesReferences
References
 
Appendix1 questionaires v4
Appendix1 questionaires v4Appendix1 questionaires v4
Appendix1 questionaires v4
 
Chapter 10 discussion and conclusion
Chapter 10   discussion and conclusionChapter 10   discussion and conclusion
Chapter 10 discussion and conclusion
 
Chapter 9 user's satisfaction intepreting the results
Chapter 9   user's satisfaction intepreting the resultsChapter 9   user's satisfaction intepreting the results
Chapter 9 user's satisfaction intepreting the results
 
Chapter 8 perception on indoor environmental conditions
Chapter 8   perception on indoor environmental conditionsChapter 8   perception on indoor environmental conditions
Chapter 8 perception on indoor environmental conditions
 
Chapter 7 measurement of environmental conditions
Chapter 7   measurement of environmental conditionsChapter 7   measurement of environmental conditions
Chapter 7 measurement of environmental conditions
 
Chapter 6 perception of architectural elements in communal spaces
Chapter 6   perception of architectural elements in communal spacesChapter 6   perception of architectural elements in communal spaces
Chapter 6 perception of architectural elements in communal spaces
 
Chapter 5 perception of architectural elements in office spaces
Chapter 5   perception of architectural elements in office spacesChapter 5   perception of architectural elements in office spaces
Chapter 5 perception of architectural elements in office spaces
 
Chapter 4 case studies characteristics
Chapter 4   case studies characteristicsChapter 4   case studies characteristics
Chapter 4 case studies characteristics
 
Chapter 2 environmental strategies for building design in tropical climates
Chapter 2   environmental strategies for building design in tropical climatesChapter 2   environmental strategies for building design in tropical climates
Chapter 2 environmental strategies for building design in tropical climates
 
PhD Viva LHI
PhD Viva LHIPhD Viva LHI
PhD Viva LHI
 
Sustainable Development
Sustainable DevelopmentSustainable Development
Sustainable Development
 
Career Department UTHM
Career Department UTHMCareer Department UTHM
Career Department UTHM
 
Dynamic and Pro Active Attitude
Dynamic and Pro Active AttitudeDynamic and Pro Active Attitude
Dynamic and Pro Active Attitude
 
Renewable Energy
Renewable EnergyRenewable Energy
Renewable Energy
 
50 Positive Thinking Tips
50 Positive Thinking Tips50 Positive Thinking Tips
50 Positive Thinking Tips
 

Kürzlich hochgeladen

The Mariana Trench remarkable geological features on Earth.pptx
The Mariana Trench remarkable geological features on Earth.pptxThe Mariana Trench remarkable geological features on Earth.pptx
The Mariana Trench remarkable geological features on Earth.pptx
seri bangash
 
Porella : features, morphology, anatomy, reproduction etc.
Porella : features, morphology, anatomy, reproduction etc.Porella : features, morphology, anatomy, reproduction etc.
Porella : features, morphology, anatomy, reproduction etc.
Cherry
 
POGONATUM : morphology, anatomy, reproduction etc.
POGONATUM : morphology, anatomy, reproduction etc.POGONATUM : morphology, anatomy, reproduction etc.
POGONATUM : morphology, anatomy, reproduction etc.
Cherry
 
Cyathodium bryophyte: morphology, anatomy, reproduction etc.
Cyathodium bryophyte: morphology, anatomy, reproduction etc.Cyathodium bryophyte: morphology, anatomy, reproduction etc.
Cyathodium bryophyte: morphology, anatomy, reproduction etc.
Cherry
 
LUNULARIA -features, morphology, anatomy ,reproduction etc.
LUNULARIA -features, morphology, anatomy ,reproduction etc.LUNULARIA -features, morphology, anatomy ,reproduction etc.
LUNULARIA -features, morphology, anatomy ,reproduction etc.
Cherry
 
Biogenic Sulfur Gases as Biosignatures on Temperate Sub-Neptune Waterworlds
Biogenic Sulfur Gases as Biosignatures on Temperate Sub-Neptune WaterworldsBiogenic Sulfur Gases as Biosignatures on Temperate Sub-Neptune Waterworlds
Biogenic Sulfur Gases as Biosignatures on Temperate Sub-Neptune Waterworlds
Sérgio Sacani
 
THE ROLE OF BIOTECHNOLOGY IN THE ECONOMIC UPLIFT.pptx
THE ROLE OF BIOTECHNOLOGY IN THE ECONOMIC UPLIFT.pptxTHE ROLE OF BIOTECHNOLOGY IN THE ECONOMIC UPLIFT.pptx
THE ROLE OF BIOTECHNOLOGY IN THE ECONOMIC UPLIFT.pptx
ANSARKHAN96
 

Kürzlich hochgeladen (20)

The Mariana Trench remarkable geological features on Earth.pptx
The Mariana Trench remarkable geological features on Earth.pptxThe Mariana Trench remarkable geological features on Earth.pptx
The Mariana Trench remarkable geological features on Earth.pptx
 
module for grade 9 for distance learning
module for grade 9 for distance learningmodule for grade 9 for distance learning
module for grade 9 for distance learning
 
FAIRSpectra - Enabling the FAIRification of Analytical Science
FAIRSpectra - Enabling the FAIRification of Analytical ScienceFAIRSpectra - Enabling the FAIRification of Analytical Science
FAIRSpectra - Enabling the FAIRification of Analytical Science
 
Genome sequencing,shotgun sequencing.pptx
Genome sequencing,shotgun sequencing.pptxGenome sequencing,shotgun sequencing.pptx
Genome sequencing,shotgun sequencing.pptx
 
Role of AI in seed science Predictive modelling and Beyond.pptx
Role of AI in seed science  Predictive modelling and  Beyond.pptxRole of AI in seed science  Predictive modelling and  Beyond.pptx
Role of AI in seed science Predictive modelling and Beyond.pptx
 
Genetics and epigenetics of ADHD and comorbid conditions
Genetics and epigenetics of ADHD and comorbid conditionsGenetics and epigenetics of ADHD and comorbid conditions
Genetics and epigenetics of ADHD and comorbid conditions
 
Dr. E. Muralinath_ Blood indices_clinical aspects
Dr. E. Muralinath_ Blood indices_clinical  aspectsDr. E. Muralinath_ Blood indices_clinical  aspects
Dr. E. Muralinath_ Blood indices_clinical aspects
 
CURRENT SCENARIO OF POULTRY PRODUCTION IN INDIA
CURRENT SCENARIO OF POULTRY PRODUCTION IN INDIACURRENT SCENARIO OF POULTRY PRODUCTION IN INDIA
CURRENT SCENARIO OF POULTRY PRODUCTION IN INDIA
 
Porella : features, morphology, anatomy, reproduction etc.
Porella : features, morphology, anatomy, reproduction etc.Porella : features, morphology, anatomy, reproduction etc.
Porella : features, morphology, anatomy, reproduction etc.
 
POGONATUM : morphology, anatomy, reproduction etc.
POGONATUM : morphology, anatomy, reproduction etc.POGONATUM : morphology, anatomy, reproduction etc.
POGONATUM : morphology, anatomy, reproduction etc.
 
GBSN - Microbiology (Unit 3)Defense Mechanism of the body
GBSN - Microbiology (Unit 3)Defense Mechanism of the body GBSN - Microbiology (Unit 3)Defense Mechanism of the body
GBSN - Microbiology (Unit 3)Defense Mechanism of the body
 
TransientOffsetin14CAftertheCarringtonEventRecordedbyPolarTreeRings
TransientOffsetin14CAftertheCarringtonEventRecordedbyPolarTreeRingsTransientOffsetin14CAftertheCarringtonEventRecordedbyPolarTreeRings
TransientOffsetin14CAftertheCarringtonEventRecordedbyPolarTreeRings
 
Terpineol and it's characterization pptx
Terpineol and it's characterization pptxTerpineol and it's characterization pptx
Terpineol and it's characterization pptx
 
Call Girls Ahmedabad +917728919243 call me Independent Escort Service
Call Girls Ahmedabad +917728919243 call me Independent Escort ServiceCall Girls Ahmedabad +917728919243 call me Independent Escort Service
Call Girls Ahmedabad +917728919243 call me Independent Escort Service
 
Cyathodium bryophyte: morphology, anatomy, reproduction etc.
Cyathodium bryophyte: morphology, anatomy, reproduction etc.Cyathodium bryophyte: morphology, anatomy, reproduction etc.
Cyathodium bryophyte: morphology, anatomy, reproduction etc.
 
Early Development of Mammals (Mouse and Human).pdf
Early Development of Mammals (Mouse and Human).pdfEarly Development of Mammals (Mouse and Human).pdf
Early Development of Mammals (Mouse and Human).pdf
 
LUNULARIA -features, morphology, anatomy ,reproduction etc.
LUNULARIA -features, morphology, anatomy ,reproduction etc.LUNULARIA -features, morphology, anatomy ,reproduction etc.
LUNULARIA -features, morphology, anatomy ,reproduction etc.
 
Selaginella: features, morphology ,anatomy and reproduction.
Selaginella: features, morphology ,anatomy and reproduction.Selaginella: features, morphology ,anatomy and reproduction.
Selaginella: features, morphology ,anatomy and reproduction.
 
Biogenic Sulfur Gases as Biosignatures on Temperate Sub-Neptune Waterworlds
Biogenic Sulfur Gases as Biosignatures on Temperate Sub-Neptune WaterworldsBiogenic Sulfur Gases as Biosignatures on Temperate Sub-Neptune Waterworlds
Biogenic Sulfur Gases as Biosignatures on Temperate Sub-Neptune Waterworlds
 
THE ROLE OF BIOTECHNOLOGY IN THE ECONOMIC UPLIFT.pptx
THE ROLE OF BIOTECHNOLOGY IN THE ECONOMIC UPLIFT.pptxTHE ROLE OF BIOTECHNOLOGY IN THE ECONOMIC UPLIFT.pptx
THE ROLE OF BIOTECHNOLOGY IN THE ECONOMIC UPLIFT.pptx
 

Chapter 3 research design and methodology

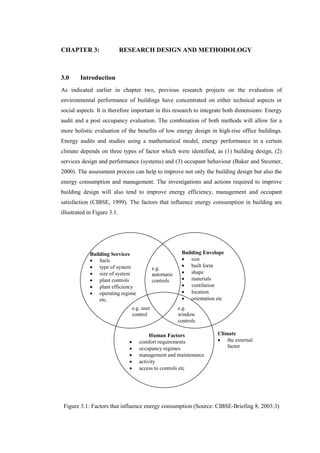
  • 1. CHAPTER 3: RESEARCH DESIGN AND METHODOLOGY 3.0 Introduction As indicated earlier in chapter two, previous research projects on the evaluation of environmental performance of buildings have concentrated on either technical aspects or social aspects. It is therefore important in this research to integrate both dimensions: Energy audit and a post occupancy evaluation. The combination of both methods will allow for a more holistic evaluation of the benefits of low energy design in high-rise office buildings. Energy audits and studies using a mathematical model, energy performance in a certain climate depends on three types of factor which were identified, as (1) building design, (2) services design and performance (systems) and (3) occupant behaviour (Baker and Steemer, 2000). The assessment process can help to improve not only the building design but also the energy consumption and management. The investigations and actions required to improve building design will also tend to improve energy efficiency, management and occupant satisfaction (CIBSE, 1999). The factors that influence energy consumption in building are illustrated in Figure 3.1. Figure 3.1: Factors that influence energy consumption (Source: CIBSE-Briefing 8, 2003:3) Climate  the external factor e.g. automatic controls Human Factors  comfort requirements  occupancy regimes  management and maintenance  activity  access to controls etc Building Envelope  size  built form  shape  materials  ventilation  location  orientation etc Building Services  fuels  type of system  size of system  plant controls  plant efficiency  operating regime etc. e.g. user control e.g. window controls
  • 2. Energy efficiency of a building based on bioclimatic principles is determined by a set of environmental, technical and social factors (Coch, 1998). The climate and the occupants are other key elements in shaping a building that provides comfort (Roaf et al, 2002). It is important to consider recording and assessing environmental qualities from the individual’s point of view and studying the interaction between the individuals and their working environment (Jones et al., 1997). Human factors need to be carefully considered, as they have a significant impact on future energy consumption in buildings. Furthermore, there is a strong interaction between the building envelope, building services and the way people use buildings. Work spaces in a high-rise commercial development have to have some degree of humanity, some degree of interest and some use of scale. For example, large sky courts and terraces might function as communal spaces as well as means of ventilation for the upper parts of the building. Satisfaction and health at work reflect the interaction between the individual, the built environment, and the organizational setting within which work is performed. 3.1 Research Design for Evaluating High Rise Office Blocks in Malaysia The research first reviewed all the characteristics of bioclimatic buildings in the Malaysian Peninsula after independence (1957), particularly the traditional Malay house and conventional buildings and the transformation through time until the dawn of the new millennium. Secondly, the research studied some detailed planning and architecture of several design approaches for high-rise building with the objective to consolidate understanding on the environmental and cultural significance. In order to understand and compare two different approaches in an appropriate technique, the selection of the case study buildings (bioclimatic and ceonventional) have to be equal in number. The selected buildings have to be as similar as possible in terms of size (i.e number of floor and build up area), share the same external environment, build and completed in about the same era. This will then shows the diverse development of both types of buildings in different eras and how they perform in these periods. A method has been developed to aid in the comparison of and understanding of the interaction between architectural features and quality levels and between environmental aspect and satisfaction levels. This technique is known as the quality index and satisfaction index where buildings can be compared to indicate ‘best achievement’ and reasons for their good performance or otherwise.
  • 3. The first research hypothesis desdribes: “High rise office buildings in Malaysia incorporating bioclimatic design have better environmental performance and consume less energy than conventional ones”. The research assessed the existing bioclimatic and conventional buildings by focusing on the design consideration of environmental element with regard to reduced energy consumption on the following criteria;  Environmental design – assessed through observation of several architectural features applied as low energy strategies in both types of building (see chapter 4).  Energy consumption – evaluated through energy audit of electrical bills for at least a year period of time and compared the building energy index with the local and regional standards (see section 4).  Users’ perception (architectural features) – tested through users’ perception towards several architectural features in building that has influnces in providing comfort conditions (see chapter 5 and 6). The second research hypothesis desdribes: “Bioclimatic buildings create a better working environment for the users and provide higher level of satisfaction than conventional ones”. The following criteria were evaluated;  Environmental conditions – tested through measurement of several environmental parameters using portable instruments in both typs of building and compare the conditions in both types of building with related standards for the region (see chapter 7).  User’s satisfaction (comfort conditions) – measured users’ satisfaction level towards several environmental performance using several ratings through questionnaires (see chapter 8). 3.2 Environmental Evaluation Environmental design focuses on the relationship between people and the built environment. It has the potential to improve the quality of life for its users. To achieve this, the design must be sensitive to those who use it. This concept should hold true for design at every scale. It also involves how the built environment affects the natural one. In areas such as ‘green’ buildings and new urbanism, it is important to look at environmental design both from the viewpoint of the user and the designer. It is therefore important to measure the environmental conditions in each case study buildings and let the respondents to evaluate the existing conditions in their office.
  • 4. 3.3 Building Energy Audits Building energy audit can be defined as measuring and recording actual energy consumption at site, of a completed and occupied building, fundamentally for the purposes of reducing and minimizing energy usage (Hui, 1997). Energy audits identify areas where energy is being used efficiently or is being wasted (expressed in units of energy, not monetary value), and highlight areas with the largest potential for energy saving. An energy audit is useful for establishing consumption patterns, understanding how the building consumes energy, how the system elements interrelate and how the external environment affects the building. There are different approaches to conduct a full building energy audit such as an audit of historical data such as previous electrical bills, survey or detailed investigation and analysis. Metering strategies is one of the approaches that can be easily adopted to the energy assessment method (see Figure 3.2). A proper energy audit is useful for more than energy conservation goals. Energy audits can be employed to assist in areas such as the establishment of a data bank for consumption records; estimating energy costs and determining consumption patterns and utility rates, and the establishment of an operational overview (see Figure 3.3). Figure 3.2: Energy evaluation approach (metering strategies) (Source: Jones, 2004:19) In this study, the energy audit part concentrated on electricity only as there is no gas consumption in most Malaysian office buildings. The electricity consumption is mostly used to provide indoor comfort to the users, related to lighting and air conditioning systems in the building. The amount used in the two different types of high rise office buildings were Step 1 Take meter readings Step 2 Calculate consumption Step 3 Calculate annual totals Step 4 Calculate performance indicators Step 5 Compare with benchmark and design estimates Step 6 Take action on excessive consumption
  • 5. compared to check whether there were real energy savings in the bioclimatic high rise office blocks or not. Figure 3.3 shows the electricity and gas used in building based on the power supply meter specified for several purposes. However similar types of data were not obtained in the study because the power supply systems in the buildings of this case study were not designed following the same approach. Figure 3.3: Estimated energy usage in an example building (Source: CIBSE, 2002:17).
  • 6. 3.4 Post Occupancy Evaluation (POE) Post-occupancy evaluation (POE) is generally defined as the process of systematically evaluating the degree to which occupied buildings meet user needs and organizational goals (see Figure 3.4). The POE provides an appraisal of the degree to which a designed setting satisfies and supports explicit and implicit human needs and values of those for whom a building is designed (Friedman et al., 1978: Lasch, 2002). Post occupancy evaluation (POE) has emerged as a formal method of analysis within the past few decades. It began with academic and government research, but it is slowly finding its way into commercial practice (Lasch, 2002). These studies method have often relied on surveys, interviews and other user- oriented studies (Fuller et al., 2001). Figure 3.4: Post occupancy evaluation techniques (Summarised from: Jaunzens et al, 2003) Post occupancy evaluation is based on the idea that better living space can be designed by asking users about their needs. Information from occupants about their response to buildings was gathered through questionnaires, interviews, site visits, and observation; sometimes the information was linked to the physical assessment of a building. The lessons from these studies were intended to convey what design elements work well, what works best, and what should not be repeated in future buildings (Federal Facilities Council Staff, 2001). Performance criteria for POEs for individual buildings are based typically on the stated design intent and criteria contained in or inferred from a functional program. Measures include indicators related to organizational and occupant performance, such as worker satisfaction and productivity, and safety and security, but may also include measures of building performance as perceived by users such as air quality, thermal comfort, spatial comfort, ergonomics, privacy, lighting comfort, noise (from the building and offices), and aesthetics. Step 1 Questionnaires Step 2 Interviews Step 3 Physical Monitoring Step 4 Observations
  • 7. In the construction industry, interaction between the human and the built environment has a strong relationship. Therefore the study measured, recorded and assessed environmental qualities from the building users’ point of view (Jones et al., 1997). It will compare factual information about indoor temperature obtained through measurements to users’ perception of thermal comfort. There are differences between the quantitative and qualitative aspects of building performance and the respective performance measures. Many aspects of building performance are in fact quantifiable, such as lighting, acoustics, temperature and humidity, durability of materials, amount and distribution of space, and so on. Qualitative aspects of building performance pertain to the ambiance of a space (i.e., the appeal to the sensory modes of touching, hearing, smelling, and visual perception, including colour). Furthermore, the evaluation of qualitative aspects of building performance, such as aesthetic beauty or visual compatibility with a building’s surroundings, is somewhat more difficult and subjective and less reliable. The higher the apparent architectural quality and interest of a building, the more stars it will receive. Recent advances in the assessment methodology for visual aesthetic quality of scenic attractiveness are encouraging. It is hoped that someday it will be possible to treat even this elusive domain in a more objective and quantifiable manner (Nasar, 1988). Sanders and Collins (1995) performed a post-occupancy evaluation on the Department of Energy Headquarters Building (the Forrestal Building) in Washington, DC. The lighting in the building was replaced with new, more energy-efficient, components to meet energy target guidelines. Occupant responses to the indoor environmental conditions, particularly the lighting, were studied to determine the impact of the relighting on the building inhabitants. In addition, physical measures of the lighting and other environmental conditions before and after the relighting were compared. The post-occupancy evaluation employed a questionnaire about the environmental conditions and physical measures of the space (lighting, space, noise, temperature, etc.) A total of 244/220 people participated (before and after the relighting, respectively). Physical measures were taken at 100 work stations before the relighting and 75 after. Analysis of the physical measurement data indicated generally higher lighting levels with more even distribution of luminance in the offices. Occupant response to the changes in the lighting was generally quite positive. The relighting was perceived to have improved the appearance of the building substantially, as well as the lighting within individual workstations.
  • 8. 3.4.1 Physical monitoring This was done through the field measurements of light levels, noise levels, air temperature, radiant temperatures and air flow rates. A level of acceptable environment was defined for comparative purposes and a clear strategy to determine the location of measurements points, frequencies and duration of monitoring. 3.4.2 Questionnaires A questionnaire has been designed to record building user’s perceptions of the architectural qualities of their office building, and their level of satisfaction towards the indoor environmental qualities such as thermal condition, levels of lighting and ventilation. The rating for technical elements on architectural features such as service core position, site building adjustment, wind scope and etc were not included in the questionnaires. It was considered unsuitable to asked ordinary people (most of the occupants) who do not have architectural knowledge background. The format of questions used in the questionnaire resembles most closely the format described in survey research method third edition by (Fowler, 2001). In this technique, related types of questions that reflect the specific finding have been set up carefully. Most of the questions asked were adopted from several samples of questionnaires available in Learning from Our Buildings: A State-of-the-Practice Summary of Post-Occupancy Evaluation (Federal Facilities Council Staff, 2001). Face to face interview was officially not allowed by most of the management but it was conducted informally with a few office workers who had chance to communicate with the researcher in the office areas where the environmental measurements were taken. The rating scales used in the questionnaires are shown in table 3.1 and the questionnaires structures are shown in figure 3.5 and 3.6. The questionnaire is shown in appendix 1. Table 3.1: Rating scales used in the questionnaires negative neutral positive -2 -1 0 1 2 Poor Fair Adequate Good Excellent negative neutral positive -3 -2 -1 0 1 2 3 Highly satisfied Very satisfied Satisfied Neutral Dissatisfied Very dissatisfied Highly dissatisfied
  • 9. ARCHITECTURAL  BUILDING SPACE AREA  Quality  The general layout of the building  Adequacy of space  Flexibility use of space  Public corridor and accessibility  Excess to terraces and circulation  The parking space  Satisfaction  Public area spaces  BUILDING APPEARANCE  Quality  Image/prestige/aesthetic value  Pleasantness of the main entrance  Landscaping at most of the common areas.  Pleasantness of lift lobby area  Public amenities in the washroom or restroom  Ceiling height in your working station  Satisfaction  Overall appearance of the building  BUILDING SERVICES  Quality  Interval time for lift service  Housekeeping and cleaning  Maintenance in public and private areas  Satisfaction  The overall lift services  Overall housekeeping  Overall maintenance  BUILDING COMPONENTS  Quality  The window size in work station  The window position in work station  The sky court  The roof top  View to the outside (working areas)  View to the outside (common room)  Difficult/easy are you in opening/closing the window  Satisfaction  window available Figure 3.5: Questionnaire structure for architectural features
  • 10. ENVIRONMENTAL  LIGHTING NATURAL  Quality  Availability at work station  Availability at lift lobby  Availability at meeting area  Availability at rest room  Availability at corridor/pathway  overall level of natural lighting  Satisfaction  with the natural lighting available in office ARTIFICIAL  Quality  Availability at work station  Availability at lift lobby  Availability at meeting area  Availability at rest room  Availability at corridor/pathway  overall level of artificial lighting (electric) lighting  Satisfaction  with the artificial lighting available in office  VENTILATION NATURAL  Quality  Availability at work station  Availability at lift lobby  Availability at meeting area  Availability at rest room  Availability at corridor/pathway  Overall level air movement from natural ventilation  Satisfaction  with the natural ventilation available in office ARTIFICIAL  Quality  Availability at work station  Availability at lift lobby  Availability at meeting area  Availability at rest room  Availability at corridor/pathway  Overall level air movement from air conditioner  Satisfaction  with the air movement from the air conditioner  THERMAL COMFORT  Quality  At working station  At the lift lobby  At meeting area  At rest room  At corridor or pathway  Overall thermal condition  Satisfaction  with the thermal condition in the office  ACOUSTIC  Quality  At working station  At the lift lobby  At meeting area  At rest room  At corridor or pathway  Overall noise level  Satisfaction  with the noise level in office  OVERALL  How happy are you working in this building  How satisfied are you with your work environment Figure 3.6: Questionnaire structure for environmental features
  • 11. 3.4.3 Observation The researcher has to carry out direct observations of the various architectural qualities of the spaces where the measurements are taken in order to relate these to the data collected. Observation on various aspects such as space use audits, energy walkabouts and architectural attributes was carried out on one area in detail during the field study. Observation on a specific office room and the common areas of the building where the environmental measurements were done has also to be observed. The summary of methodology and required data or information for case studies can be illustrated as in Figure 3.7 - 3.8. Figure 3.7: Adopted research methodology Figure 3.8: Case study information and required data
  • 12. 3.5 Data Collection This section describes the design of the field work carried out by the author in Malaysia. Field work was carried out between July 2005 and September 2005, during which questionnaires were distributed to the occupants in two different types of office buildings in order to record their perceptions of the environmental qualities of their working space. The collection of subjective data (recording the perception of the office space by its occupants and their level of satisfaction) allowed for a subjective data analysis. Direct observations were carried out by the authors on various architectural aspects of the buildings attributes. A project checklist was developed to indicate elements related to environmental design strategies. Indoor air temperature, relative humidity, air velocity, light level and noise level were measured on a selected floor where the questionnaires were distributed. All buildings were sub divided into three zones; lower, middle and higher. The selection of the measurement floors in each zone was normally suggested by the building manager. Measurements were taken at several points (3 or 4) on the respective floor areas on an hourly basis for air temperature, relative humidity and air velocity whereas for light level and noise level measurement were recorded for every two hour. The user’s satisfaction data was gathered via questionnaires which were distributed to the building occupiers, mainly in the open plan office spaces. In the questionnaire, respondents were asked to give their opinion on the architectural and environmental qualities of their building. They were also required to express their level of satisfaction with the lighting, ventilation and thermal comfort in their particular office space. The sample consisted of a third of the occupants. A reasonable number of questionnaires were distributed randomly to the staff and those returned were about 35% of the total distributed. 3.5.1 Objectives of the field study The objective of the field study was to determine user’s perceptions towards their satisfaction working in the designed environment and to determine the amount of energy used to create the indoor environment condition. This data was used to derive a conclusion for the research hypothesis as mentioned in chapter 1.
  • 13. 3.5.2 Methodology of the field study From the review derived from several methodologies used in office environment studies done by previous researchers, the questionnaire is the best tool to gather information from the building occupants. Several equipment matched most closely to the required tool for present study was used to obtained environmental data. Some measured data by previous researchers has also been considered as additional options to this adopted method. 3.5.3 Preparation for the fields study In the beginning of March 2005, the building managers of all selected buildings were contacted to obtain permission to carry out the study in their premises. A brief explanation of the type of data required and the level of cooperation needed were also mentioned in the corresponding letter. A month later only two managers gave a positive response after the corresponding letters were sent off, whereas the other six remained silent. Worried that miss communication might have happened, a second round of correspondence was sent off to the respective building managers. Since the buildings are both in Penang, the tentative program for field studies were then planned to be started in Penang followed by Kuala Lumpur. In the end of June 2005 the researcher flew to Kuala Lumpur. It was expected that the building managers would be easier to contact while in Malaysia rather than in the United Kingdom. Several follow ups via email and telephone conversations were made upon arrival to Malaysia, first to confirm the visit to the permitted building in Penang before the field work started and second, to get permission for the remaining six buildings. In the meantime, preparation for the questionnaires and data log book was finalised. The application for borrowing suitable portable equipment for environmental measurement from Building Services Laboratory, University Tun Hussein Onn Malaysia (UTHM) was also approved. About 800 copies of the questionnaire were printed before the first phase started. Inspection of all portable equipment for environmental data measurement was done to ensure their workability and calibration to a standard. A training session for equipment handling was done at the same time. It was presented by the Building services technician in the presence of the Head of Building Services Laboratory.
  • 14. There were managers who did not confirm their decision whether or not to permit the field work in their building even after the first phase of the field work was completed. The process took several weeks to get them to agree and changes of the actual date were made several times before a mutual confirmation could be obtained. It is probably due to the busy nature of these professionals that the process of obtaining permission was not that easy. At the end of the period, only six buildings were granted and the other two buildings were dropped from the list due to several circumstances. Initially there were eight buildings selected which included Menara Daya Bumi and Plaza Sentral in Kuala Lumpur. Despite eight buildings, only six of them were permitted for case study namely Menara UMNO, Menara Mesiniaga, Menara IBM, Menara KOMTAR, Menara TIMA and Menara LUTH. 3.5.4 Environmental Parameters Measurement Five environmental parameters were to be taken in the field studies which include air temperature, relative humidity, air velocity, light intensity level (Brightness) and sound level. These parameters were selected to evaluate the conditions of thermal, visual and sound that were also evaluated by the respondents. Air Temperature, Ta (°C) Air temperatures were measured using a Hygro-Thermo-Anemometer. It is a dual display of air velocity and temperature or humidity and temperature with built-in RS-232 PC interface. It is a battery operated instrument and has a combined temperature and humidity probe that can measure air temperatures within the range of 0°C to +50°C (32o F to 122o F) with a resolution and accuracy of 0.1° and ±0.8o C (±1.5°F) respectively. Relative Humidity, RH (%) Relative humidity in the offices was measured using the same equipment for air temperature, the Hygro-Thermo-Anemometer. By using the same probe (combined temperature and humidity probe), the relative humidity could be measured within the range of 10% to 95% with a resolution of 0.1% and accuracy of ±3%. Air Velocity, V (m/s) Using the same equipment for air temperature and relative humidity measurements, the Hygro-Thermo-Anemometer was used to measure air velocity in the offices. This time a different type of probe was used which is a combined air velocity and temperature probe (vane probe). With this probe, the anemometer could sense air flow from any direction and at
  • 15. the same time read the room temperature. The instrument acted as an instant action anemometer with a capability to measure air velocity ranging from 0.4 m/s to 25.0 m/s with a resolution of 1 m/s and accuracy of ±(2% + 1d). Light Intensity Level (Brightness) Lux The brightness level was measured using a Hand Held Light Meter (LX-102 Lux Meter). It is a battery operated instrument and capable of detecting brightness ranges from 0 to 50,000 Lux with accuracy of ± 5% and 0-200mV recorder output (1mV/count) Sound Level dB(A) The sound level was obtained by Extech Integrating Sound Level Data logger. It is a battery operated instrument capable of detecting sound ranges from 0dB to 140dB with a resolution and accuracy of 0.1dB and ±1.5dB respectively. Selection of equipment was limited to that available in the Building Services Laboratory, University Tun Hussein Onn Malaysia (UTHM). The equipment used in the field work and their specification are shown in appendix 2. 3.5.5 Data Gathered In the Field Study Basically there are three types of data obtained which fall into the following categories, user’s satisfaction, environmental condition and energy consumption. The user’s satisfaction data was gathered via questionnaires which were distributed to the building occupiers who work and stationed in the office. In the questionnaires, respondents were asked to give their opinion on the architectural aspects of the building. They were also required to express their satisfaction level toward thermal, ventilation, lighting and acoustic condition in the building. Only indoor environmental data were obtained from the field study. Measured parameters for environmental data included the air temperature (Ta), relative humidity (RH) and air velocity (V). Despite that, sound levels as well as light level were also measured in Lux and Decibel unit respectively. In each building, these were measured on a selected floor in each zone (lower, middle and upper) where the questionnaires were distributed. It was done while waiting for the questionnaires to be ready for collection. The energy consumption data were collected from the maintenance office upon completion of the environmental measurement. A year period of monthly electrical bills were sorted and duplicated for this purpose.
  • 16. Detailed energy used for each plant was not available since the metering system used was not supported for this type of measurement. What Data Involved 1. Architectural data (Observation) 2. Environmental data (Measurement – portable equipments) 3. Energy data (Management record – building energy management systems record for one year - utilities bills monthly basis) 4. Post occupancy evaluation (Questionnaires – user’s perception) Who Involved 1. Researchers  Observe the Architectural Design  Measure the Environmental Condition (Indoor) 2. Building manager  Provide Energy data from the building energy management systems record. a. Utilities bills (i.e: electricity, gas, water & etc.) b. Schematic drawing of the plants. c. Building layout plan, section, elevation etc. d. Rate the building based on the given indicators. 3. Building Users  Fill in questionnaires for user’s satisfaction.  Participate in interviews about user’s satisfaction. Table 3.2: Data obtained in the fieldworks DataBuildings UM MN IB KT TM LU 1. Building plan & drawing √ √ √ √ √ √ 2. Electric bills (one year) √ √ X √ √ √ 3. Questionnaires 23 29 20 46 39 18 4. Indoor environmental data Air Temperature √ √ √ √ √ √ Air Velocity √ √ √ √ √ √ Relative humidity √ √ √ √ √ √ Light Meter √ √ √ √ √ √ Sound Meter Level √ √ √ √ √ √ UM – Menara UMNO MN – Mesiniaga Tower IB – IBM Plaza KT – KOMTAR Tower TM – Tun Ismail Mohd Ali LU – LUTH Tower
  • 17. Data Obtained In summary, it can be said that the field work return with various types of data can be classified into the following categories; (1) Users’ Satisfaction Data (Questionnaires), (2) Environmental Data, (3) Energy Consumption and (4) Architectural Observation. Each category has a specific analytical technique which is explained in the next section. All data obtained in the fieldworks is summarised in Table 3.1. Challenges 1. Difficult to get the right contact person Building operator gave inappropriate information about the right person in charge to be contacted for getting the permission. The bureaucracy system incurred further delays for approval. 2. Communication breakdown Most of the managers said they had not received any correspondence letter that we sent a few months earlier requesting permission to use the building for the case study. At one building the manager said she had already appointed one of her staff to respond to our letter but unfortunately the person resigned before we came. 3. Difficulty in getting permission from the superior for interview session. The reason given was that their members of staff were very busy at that time and could not be disturbed. It will disconcert the operation of their department or the company. Most of the occupants were not interested or available for interview and we would have to carry out the interview indirectly without having a proper session or visual recorded. 4. Inflexibility of movement in certain building We were accompanied by the maintenance staff and sometimes the security guard. Our movements were quite limited at particular buildings where commitments from the guard were unreceptive. 5. Changes of building The manager for PNB tower disapproved our request to conduct the study in that particular building but offered another building that meets the criteria which is Tun Ismail Mohd Ali Tower owned by PNB.
  • 18. 3.6 Data Analysis Techniques As there were several types of data obtained from the field work, coming in many forms, it is important to organise all the data into a suitable medium for easy record, analysis and presentation. Several computer software packages were used to record, analyse and process the collected data depending on how complex the data was and how suitable the software with the size and form of the data. 3.6.1 Questionnaires All information gathered through questionnaires were analysed using a computer software program SPSS 14 (Statistical Package for the Social Sciences) available at University of Liverpool and can be eccessed though personal computer provided by the department of Architecture. It is a well known established software system for data management and analysis. SPSS may be used for many univariate and multivariate statistical analyses and has facilities for sorting and merging files and manipulating data. The result from SPSS were then transformed into MS excel and office for publication purposes. Not all architectural data were published in this thesis. Only the most relevant elements were discussed in the next two chapters and were re-organised into new categories as shown in figure 3.9. Figure 3.9: Analysis diagram for architectural elements
  • 19. In any data set collected there may be some amount of error and it is very important to minimise this error so that the data obtained provide a more accurate reflection of the truth. In survey research, error comprises two components: random error and measurement error. Random error is the unpredictable error that occurs in all research. It may be caused by many different factors but is affected primarily by sampling techniques. To lower the chance of random error, a larger and more representative sample should be selected but this may increases the cost of the study and is time consuming. It is often neither practical nor feasible simply to expand the sample. Instead statistics are used to calculate the probability that a particular result is due to random error. If that probability falls below the set limit, then reject the null hypotheses and draw inferences about the population. Null hypothesis is a conservative assumption in statistical analysis, is made that the two groups of interest do not differ in the particular variable being studied. The survey research would be designed to try and reject that null hypothesis. 3.6.1.1 Reliability Analysis In research, the term reliability means ‘repeatability’ or ‘consistency’. A measure is considered reliable if it would give us the same result over and over again (William and Trochim, 2006). If measurement error refers to how well or poorly a particular instrument performs in a given population, reliability is a statistical measure of how reproducible the survey instrument’s data are (Litwin, 1995). There is no survey instrument or test is perfectly reliable, but some are more reliable than others. When evaluating the value of a data set, it is important to look at the reliability characteristics of the measurement instrument. Reliability analysis was used to study the properties of measurement scales and the items that make them up. The reliability analysis procedure calculates a number of commonly used measures of scale reliability and also provides information about the relationships between individual items in the scale. Reliability is commonly assessed in three forms: test-retest, alternate-form and internal consistency. Test-retest reliability is the most commonly used indicator of survey instrument reliability. It is measured by having the same set of respondents complete a survey at two different points in time to see how stable the responses are. Alternate-form reliability involves using differently worded items to measure the same attribute without changing the meaning of the questions. Two different forms may be administered at separate time points to the same population.
  • 20. Internal consistency reliability is another commonly used psychometric measure in assessing survey instruments and scales. It is applied not to a single item but to groups of items that are thought to measure different aspects of the same concept. Internal consistency is an indicator of how well the different items measure the same issue. The internal consistency reliability test is the most appropriate approach for reliability test on the survey instrument used in this study. It is measured by calculating a statistic known as Cronbach’s coefficient alpha (named for the 20th century psychometrician who first reported it in 1951). Coefficient alpha measures internal consistency reliability among a group of items combined to form a single scale. It is a statistic that reflects the homogeneity of the scale and is a reflection of how well the different items complement each other in their measurement of different aspects of the same variable of quality. 3.6.1.2 Chi-Square Test (χ2 ) Is observed association true (holds for population at large); or false (arises in sample only due to random chance)? Due to sampling error we can’t be sure that an apparent relationship between two variables is a real one. For example, is the relationship we have observed between employment status and political allegiance real or simply a sampling artefact? Impossible to tell – any association can arise by chance. This relates to the notion of truth (Williamson, 2004). The rationale behind the χ2 test is that if the two variables are not related (i.e. gender is not related to satisfaction towards number of parking spaces) then we should have the same proportion of men and women satisfied with the number of parking spaces. There may be a difference in the proportions due to pure chance, but (depending on the sample size) this difference must be small. Consequently, if the difference between the two proportions is very large, then we would be led to conclude that there is some association between gender and satisfaction towards number of parking spaces. 3.6.1.3 The Level of Significance The level of significance is the threshold that is used to decide if an observed difference in the sample was unlikely to have been observed by chance and hence to reject the null hypothesis. The level of significance is expressed as a probability and is often taken to be 0.05. This may also be described as significant at the 5% or 95% level, or displayed as p<0.05. A significance level of 0.05 implies that a difference extreme enough to reject the null hypothesis by chance when the null hypothesis is actually true will be observed one time in twenty. It is possible to test the significance at the 10% (p<0.10) or 1% (p<0.01) levels.
  • 21. Each statistical test has a distribution called sampling distribution. Its mean is called the expected value and its variability is called the standard error. All statistic distributions are divided into an area of rejection and an area of acceptance. Tabular value in a distribution will show that the area of acceptance for the null hypothesis is the central 95% of the distribution and that rejection area are the 2.5% of the area in each tail. The value that defines this area is -1.96 for the lower tail and +1.96 for the upper tail. If this statistic is less than -1.96 or greater than +1.96, it will be rejected. 3.6.2 Environmental & Energy Consumption Data The environmental data obtained in the field work are not as complex as the questionnaires data and were well recorded during collection in a set of data booklet. Later it was analysed using MS Excel and transformed into MS Word. Basically the entire monthly electrical bills for a period of one year were duplicated from the management office. The bills were later transformed into a simplified table that was easy to understand in MS Excel before being transferred into MS Word format for this purpose. 3.7 Summary and Conclusion While primarily directed at finding out how to improve energy performance in tropical buildings, the focus should have a direction towards sustainable building design and improve the environment for their users. This research combines both technical and social factors in the investigation of high rise office buildings in tropical climates. Focusing on the dense urban development area where energy was used enormously especially in high rise office building may be the best lesson. The research carried out thorough review on the design concept of sustainable building in tropical climate and obtains descriptive data from building occupiers as well as numerical data from the management in several numbers of bioclimatic and conventional skyscrapers available in Malaysia. The aim of the research is to conduct a systematic evaluation of a sample of conventional and bioclimatic high rise office blocks in two major cities in Malaysia. The benefits (or otherwise) of introducing bioclimatic features in the design of high-rise office blocks will be highlighted. Upon its completion, this study will contribute to advanced knowledge on the claimed advantages (both environmental and social) linked to bioclimatic high rise office buildings.