2009 assessment effects of cage culture on nitrogen
ArestyPresentation
1. Reconstructing 20th Century Central Indonesia's Forest Fire History
Christopher Kumar and Yair Rosenthal
Department of Marine and Coastal Science, Rutgers University, New Brunswick, NJ
Abstract Background and Motivation
Future Work
Acknowledgments
Interannual climate variations in the tropics (e.g.,
El Niño Southern Oscillation – ENSO) disrupt the
lives of many people in affected regions and may
also have adverse effects on the vegetation and
ecosystems of this region, which causes a response
in the frequency of forest fires. Reconstruction of
the centennial scale climate history of forest fires
in Borneo and Sulawesi, Indonesia, during the past
can be achieved through generating records of
charcoal fragments in ocean sediments located
along the margins of these two islands. Organic
matter degradation of the oceanic sediment was
facilitated by rinsing the samples with nitric acid
and peroxide. After centrifuging the samples,
charcoal fragments were counted through the use
of a nanoplankton counting chamber and a
dissecting microscope. Counting analysis provides
insight into the fluctuations of forest fire history in
Indonesia over the past. These records can be
compared with other records of hydroclimate
variability and will allow us to assess the
vulnerability of tropical vegetation to water stress.
As shown above, the effects of ENSO (El Niño Southern Oscillations)
on Indonesia create an extremely dry and hot climate, especially
during the months of September-November. This climate anomaly
causes severe fires that burn for weeks at a time. Forest fires in
Indonesia have been a prominent issue in the country’s history.
However, historical data that records forest fire history fail to exist
for this region. This project serves to establish a micro-charcoal
counting method that can be used to reconstruct Indonesia’s forest
fire history from the past.
Materials and Methods
Results
Organic Matter
Degradation
• Collection of samples
from Indonesia undergo
treatment for organic
matter degradation and
are filtered so that
charcoal fragments can
be counted in residue.
Sample Filtration
• Sediment is filtered and
separated by particle
size. Particles between
0.47μm and 65μm are
added to 10mL of water
while particles greater
than 65μm are added to
5mL water. 0.15mL of
sample are added to
nanoplankton counting
chamber.
Counting
• Nanoplankton counting
chamber is viewed under
microscope. Each piece
of charcoal reflects one
count. Three different
counts are made per
sample and then
averaged. Once averaged,
the water content of the
samples is factored in to
get the dry weight. The
average counts are then
divided by the dry weight
to find the total count for
that sediment size.
I would like to thank Ryan Bu for all his time and guidance in
developing and facilitating the methods for this project. Thank
you to the Aresty Research Center for supporting this research.
The purpose of this project was to develop
a method that could facilitate data
collection through micro-charcoal
counting. Furthermore, if counting is
permissible, would the collection method
prove strong enough for further analysis?
Based on the data, we believe that further
investigation into charcoal counting is a
viable option. The charcoal counts
collected give some insight into how forest
fires directly impact charcoal fragment
collection in ocean sediment. Future work
would revolve around connecting charcoal
counts to ENSO-related forest fires. We
know what the history of ENSO is for the
Indonesian region and we know of its
affects for the past few hundred years. The
next few steps for this project would be
providing stronger evidence for charcoal
counting methods and also more
exploratory tests to determine whether or
not charcoal counts can explain ESNO
patterns.
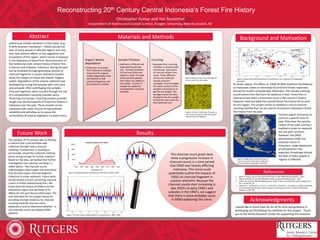
ReferencesFigure 1 The graph depicts charcoal count data from sample 37 MC
Farmers expect monsoons to
come at a specific time of
year. They clear the land by
means of the slash and burn
method in order to replenish
the soil with nutrients.
However, the ENSO
phenomenon shifts the
seasonal march of
monsoons. Large departures
of precipitation from
expected climatology disrupt
the lives of many people in
regions so affected.
Figure 2 The chart depicts ENSO patterns in Indonesia from 1880 - 2000
Figure 3 Photo of micro charcoal fragment
as seen under the microscope
Figure 4 Picture of slide view of sample as
seen under microscope. Dark black spots
indicate charcoal fragments
Figure 5 Image shows ENSO phenomenon of heat factor over Indonesia from September -
November
Figure 6 Image shows Indonesian haze as
brush continues to burn due to high heat
and dry climate during ENSO (1997-98)
1. Butler, R. (2012, July 27). The Asian Forest Fires of 1997-1998. Retrieved March 1, 2015.
2. Effects of El Nino On the World Weather. (2004, January 8). Retrieved April 1, 2015.
3. Collins, M., and The CMIP Modelling Groups, 2005: El Niño- or La Niña-like climate change? Clim.
Dyn., 24, 89-104. 19
4. Thevenon, F., Williamson, D., Bard, E., Anselmetti, F., Beaufort, L., & Cachier, H. (2010). Combining
Charcoal and elemental black carbon analysis in sedimentary archives. Global and Planetary
Change, 72, 381-389.
The charcoal count graph does
show a progressive increase in
charcoal counts in a time period
that ENSO was heavily affecting
Indonesia. This trend could
potentially outline the impacts of
ENSO on charcoal fragment in
oceanic sediment. Because the
charcoal counts start increasing in
late 1920's to early 1930's and
subsides in the 1950's, we suggest
that there is some probable cause
in ENSO explaining this trend.