Poster56: Greenhouse gas fluxes, global warming potential and emergy evaluation of Quesungual slash-and mulch agroforesty system
•
1 gefällt mir•759 views

Poster for CIAT 2009 Knowledge Sharing Week
Empfohlen

Empfohlen
Weitere ähnliche Inhalte
Was ist angesagt?
Was ist angesagt? (20)
Andere mochten auch
Andere mochten auch (8)
Ähnlich wie Poster56: Greenhouse gas fluxes, global warming potential and emergy evaluation of Quesungual slash-and mulch agroforesty system
Ähnlich wie Poster56: Greenhouse gas fluxes, global warming potential and emergy evaluation of Quesungual slash-and mulch agroforesty system (20)
Mehr von CIAT
Mehr von CIAT (20)
Kürzlich hochgeladen
Kürzlich hochgeladen (20)
Poster56: Greenhouse gas fluxes, global warming potential and emergy evaluation of Quesungual slash-and mulch agroforesty system
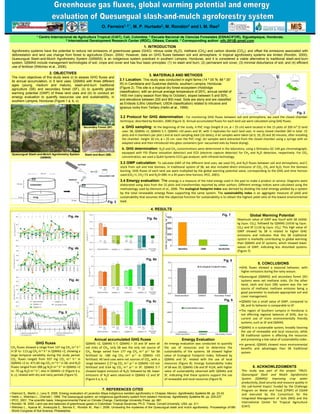
- 1. O. Ferreira1, 2 *, M. P. Hurtado2, M. Rondón3 and I. M. Rao2 1 Centro Internacional de Agricultura Tropical (CIAT), Cali, Colombia; 2 Escuela Nacional de Ciencias Forestales (ESNACIFOR), Siguatepeque, Honduras; 3 International Development Research Center (IRDC), Ottawa, Canadá. * Corresponding author: oifc.001@ gmail.com 1. INTRODUCTION Agroforestry systems have the potential to reduce net emissions of greenhouse gases (GHG): nitrous oxide (N2O), methane (CH4) and carbon dioxide (CO2); and offset the emissions associated with deforestation and land use change from forest to agriculture (Dixon, 2004). However, data on GHG fluxes between soil and atmosphere, in tropical agroforestry systems are limited (Rondón, 2000). Quesungual Slash-and-Mulch Agroforestry System (QSMAS) is an indigenous system practiced in southern Lempira, Honduras, and it is considered a viable alternative to traditional slash-and-burn system. QSMAS include management technologies of soil, crops and cover and has four basic principles: (1) no slash and burn, (2) permanent soil cover, (3) minimal disturbance of soil, and (4) efficient use of fertilizer (Wélchez et al., 2006). 2. OBJECTIVES 3. MATERIALS AND METHODS The main objectives of this study were (i) to assess GHG fluxes and its annual accumulation, in 5 land uses: QSMAS with three different 3.1 Location: This study was conducted in eight farms (14 º 05 'N, 88 º 30' ages (young, medium and mature), slash-and-burn traditional W) in Candelaria and Gualcinse districts, southern Lempira, Honduras agriculture (SB) and secondary forest (SF), (ii) to quantify global (Figure 2). This site is a tropical dry forest ecosystem (Holdridge warming potential (GWP) of these land uses and (iii) to conduct an classification), with an annual average temperature of 25oC, annual rainfall of emergy evaluation to quantify resources use and sustainability, in 1400 mm (rainy season from May to October), slopes between 5 and 50%, southern Lempira, Honduras (Figure 1 a, b, c). and elevations between 200 and 900 masl. Soils are stony and are classified as Entisols (Lithic Ustorthent, USDA classification) related to intrusive and Hon dura s igneous rocks from Tertiary (Hellin et al., 1999). Fig. 2 3.2 Protocol for GHG determination : For monitoring GHG fluxes between soil and atmosphere, we used the closed chamber technique, described by Rondón, 2000 (Figure 3). Annual accumulated fluxes for each land use were calculated using GHG fluxes. Fig. 1 b Secondary Forest (SF) a. GHG sampling: At the beginning of the study, 4 PVC rings (height 8 cm, ø = 25 cm) were located in the 15 plots of 200 m² (5 land uses: SB, QSMAS <2, QSMAS 5‐7, QSMAS >10 years and SF, with 3 replicates for each land use). In every closed chamber (60 in total ‐15 plots and 4 chambers per plot‐) and at each sampling date (16 dates), 4 air samples were taken (at 0, 10, 20 and 30 minutes, after installing the chamber ‐height 10 cm, ø = 25 cm‐ over the PVC ring). Air samples were extracted from the closed chamber using a syringe with an adapted valve and then introduced into glass containers (pre‐ vacuumed vials by freeze drying). Fig. 1 a Fig. 1 c b. GHG determination: N2O and CH4 concentrations were determined in the laboratory, using a Shimadzu GC‐14A gas chromatograph, Quesungual Slash-and-Mulch Agroforestry System equipped with FID (flame ionization detector) and ECD (electron capture detector) for CH4 and N2O detection, respectively. For CO2 Slash-and-Burn (SB) (QSMAS) concentration, we used a Qubit Systems S151 gas analyzer, with infrared technology. 3.3 GWP calculation: To calculate GWP of the different land uses, we used CH4 and N2O fluxes between soil and atmosphere, and C stock from soil and tree biomass. In traditional system of SB, we also included direct emissions of CO2, CH4 and N2O, from the biomass burning. GHG fluxes of each land use were multiplied by the global warming potential value, corresponding to the GHG and time horizon used (CO2=1, CH4=72 and N2O=289, in a 20 years time horizon, IPCC, 2001). 3.4 Emergy evaluation: The emergy is a measure of the total energy used in the past to make a product or service. Diagrams were elaborated using data from the 15 plots and transformities reported by other authors. Different emergy indices were calculated using the methodology used by Diemont et al., 2006. The ecological footprint index was derived by dividing the total emergy yielded by a system by the total renewable emergy flows supporting the same system. The sustainability index is an aggregate measure of yield and sustainability that assumes that the objective function for sustainability is to obtain the highest yield ratio at the lowest environmental Fig. 3 load. 4. RESULTS GWP (kg CO 2 Equivalents ha-1 yr-1 ) Fig. 4a Fig. 7 Global Warming Potential 5 0 00 0 Fig. 6a Maximum value of GWP was founf with SB (40940 4 0 00 0 kg Equiv. CO2), followed by QSMAS (10530 kg Equiv. 3 0 00 0 CO2) and SF (1130 kg Equiv. CO2). This high value of GWP showed by SB is related to higher GHG 2 0 00 0 emissions and indicates that this SB traditional 1 0 00 0 system is markedly contributing to global warming than QSMAS and SF systems, which showed lower 0 Fig. 4b S sh n -B rn la -a d u Q MS SA S n a F re eco d ry o st values of GWP, indicating less disturbed systems (Figure 7). Fig. 6b Fig. 8 2.0 5. CONCLUSIONS Ecological Footprint Index •GHG fluxes showed a seasonal behavior, with 1.5 higher emissions during the rainy season. 1.0 •Quesungual (QSMAS) and secondary forest (SF) Fig. 4c systems were net methane sinks. On the other 0.5 hand, slash and burn (SB) system was the net source of methane; methane emission being a 0.0 good parameter to evaluate appropriate soil and Slash-and-Burn QSMAS Secondary Forest cover management. Fig. 6c Fig. 9 •QSMAS has a small value of GWP, compared to 4500 SB, and its behavior is comparable to SF. Sustainability Index •The region of Southern Lempira in Honduras is Fig. 5 3000 not affecting regional balances of GHG, due to current use of more environmentally friendly 1500 systems, such as SF and QSMAS. •QSMAS is a sustainable system, broadly favoring 0 the use of renewable and local resources, while Slash-and-B urn QSM A S S ec ondary Forest SB traditional system is affecting the resources Annual accumulated GHG fluxes Emergy Evaluation and presenting a low value of sustainability index . GHG fluxes QSMAS <2, QSMAS 5‐7, QSMAS > 10 and SF were all An emergy evaluation was conducted to quantify •In general, QSMAS showed more environmental CH4 fluxes showed a range from 147 mg CH4 m‐2 h‐1 net sinks of CH4, only SB was the only net source of the use of resources and to determine the benefits and advantages than SB traditional in SF to ‐113 µg CH4 m‐2 h‐1 in QSMAS <2, showing a CH4. Range varied from 177 mg CH4 m‐2 yr‐1 for SB sustainability of the systems. SB showed higher system. large temporal variability during the study period. fertilized to ‐180 mg CH4 m‐2 yr‐1 in QSMAS <10 value of Ecological Footprint Index, followed by CO2 fluxes ranged from 937 mg CO2 m‐2 h‐1 in fertilized. All land uses were net sources of CO2, with a QSMAS and SF, related with the use of local QSMAS <2 to ‐471.60 mg CO2 m‐2 h‐1 in SB; and N2O range between 2.27 kg CO2 m‐2 yr‐1 in QSMAS <10 not resources (Figure 8). Emergy Sustainability Index fluxes ranged from 288 µg N2O m‐2 h‐1 in QSMAS <2 fertilized and 0.64 kg CO2 m‐2 yr‐1 in SF. QSMAS 5‐7 of SB was 35, QSMAS 136 and SF 4124, with higher 6. ACKNOWLEDGMENTS to ‐70 µg N2O m‐2 h‐1, also in QSMAS <2 (Figure 4 a, showed largest emission of N2O, followed by SB; lower value of sustainability observed with QSMAS and This study was part of the project quot;PN15: b, c), related with dry and rainy periods (Figure 5). emissions of N2O were observed in QSMAS <2 and SF SF, indicating that these systems support the use Quesungual Slash and Mulch Agroforestry (Figure 6 a, b, c). of renewable and local resources (Figure 9). System (QSMAS): Improving crop water productivity, food security and resource quality in the sub‐humid tropics' funded by the Challenge 7. REFERENCES CITED Program on Water and Food (CPWF) of CGIAR • Diemont S., Martin J., Levy S. 2006. Emergy evaluation of Lacandon Maya indigenous swidden agroforestry in Chiapas, Mexico. Agroforestry Systems 66. pp. 23-42 and executed by the Consortium for the • Hellin J., Welchez L., Cherrett I. 1999. The Quesungual system: an indigenous agroforestry system from western Honduras. Agroforestry Systems 46. pp. 229-237 Integrated Management of Soils (MIS) and the • IPCC. 2001. The scientific basis. Intergovernmental Panel on Climate Change. Cambridge University Press. pp. 881 • Rondón. M. 2000. Land use and balances of greenhouse gases in Colombian Tropical Savannas. Ph.D. Thesis. Cornell University. USA. pp. 211 International Center for Tropical Agriculture • Wélchez L., Ayarza M., Amézquita E., Barrios E., Rondón M., Rao I. 2006. Unraveling the mysteries of the Quesungual slash and mulch agroforestry. Proceedings of18th (CIAT). World Congress of Soil Science, Philadelphia