1. 1.4 PETROPHYSICS: Combined Rock and Fluid Character
Integration of geological and petrophysical data allows development of a rock-fluid model for
upper Spraberry rocks. This study identifies the different rock types that comprise the subject
reservoirs, marginal reservoirs and non-reservoir rocks. A rock type is defined as an interval of
rock with unique pore geometry, determined mineralogical composition and is related to certain
specific fluid flow characteristics.
The rock-fluid model relates fluid flow characteristics to rock types defined in the previous
section (1.3: Petrography and Diagenesis). Analytical techniques used to develop this model
include porosity-permeability analysis of core plug samples, air minipermeameter measurements
on core slabs, thin section analysis, scanning electron microscope analysis of the pore structures,
air-mercury capillary pressure, pore body and pore throat size distributions and GR log of each
well. Integration of results from these various analytical techniques reveals that the six (6) small-
scale lithofacies described using thin-section analysis are consistent with the petrophysical model
shown in this section.
1.4.1 Gamma Ray Log Resolution
A method of distinguishing between shales, clay rich siltstones and very fine sandstones units
uses gamma-ray logs (Fig.1.2-1) and is widely implemented in the field practice. This method
has shown to provide good differentiation between lithological characteristics in many
investigations (Guevara, 1988; Tyler and Gholston, 1988). Data from different analytical
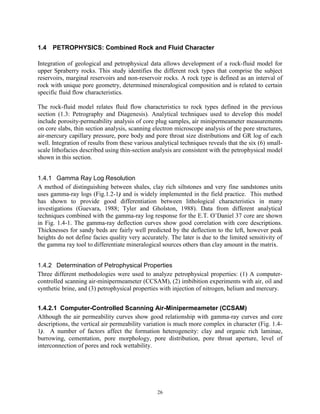
techniques combined with the gamma-ray log response for the E.T. O’Daniel 37 core are shown
in Fig. 1.4-1. The gamma-ray deflection curves show good correlation with core descriptions.
Thicknesses for sandy beds are fairly well predicted by the deflection to the left, however peak
heights do not define facies quality very accurately. The later is due to the limited sensitivity of
the gamma ray tool to differentiate mineralogical sources others than clay amount in the matrix.
1.4.2 Determination of Petrophysical Properties
Three different methodologies were used to analyze petrophysical properties: (1) A computer-
controlled scanning air-minipermeameter (CCSAM), (2) imbibition experiments with air, oil and
synthetic brine, and (3) petrophysical properties with injection of nitrogen, helium and mercury.
1.4.2.1 Computer-Controlled Scanning Air-Minipermeameter (CCSAM)
Although the air permeability curves show good relationship with gamma-ray curves and core
descriptions, the vertical air permeability variation is much more complex in character (Fig. 1.4-
1). A number of factors affect the formation heterogeneity: clay and organic rich laminae,
burrowing, cementation, pore morphology, pore distribution, pore throat aperture, level of
interconnection of pores and rock wettability.
26
2. 1.4.2.2 Methodology for Obtaining Petrophysical Properties
1.4.2.2.1 Permeability determination with Nitrogen Flow Through Rock Type:
Core plug samples of 1 in. and 1.5-in. diameters were used to measure petrophysical properties
of the different lithofacies for two cores from the Upper Spraberry Formation. Parameters
measured include porosity (φ), permeability (k), and grain density (Reservoirs Inc., 1996). A core
holder with a specific confining pressure is used. Formulas for the calculation of permeability,
porosity and water saturation are given below. The permeability resulted from injection of
nitrogen gas into the samples at a constant pressure until a constant flow rate of gas through the
sample is attained (steady-state conditions). Permeability (k) is a function of flow rate (q),
viscosity of the fluid (µ), length of the core plug (L), transversal area of core plug (A), and drop in
flow pressure (∆P):
qµL
kb = ....................................................................................................................... (1)
A∆P
1.4.2.2.2 Helium Porosity Determination
Boyle’s law was used to calculate the porosity for each core plug sample:
P × V1 = P2 × V2 ...................................................................................................................... (2)
1
Helium was used as the gas phase. Two chambers of known volumes were connected, one
containing helium at a given pressure (P1) and another (matrix cup) with a core plug. The helium
is expanded into the matrix cup and an equilibrium pressure (P2) is recorded. The initial volume
(V1) of the sole helium chamber is known, thus the volume of the new system helium chamber
and matrix cup (V2) is determined using the Boyle’s Law. By subtracting V1 from V2 the total
pore volume (PVt) for the given core plug is obtained. The porosity (φ) is simply the fraction
between the total pore volume (PVt) and the core plug bulk volume (Vb) determined from
mercury immersion (Archimedes principle) and corroborated by measuring the core plug
dimensions.
PVt
φ= ....................................................................................................................... (3)
Vb
Grain density (GD) for each core plug is a function of the grain volume and weight of the clean
and dry core material. Grain volume (GV) is the result of subtracting the total pore volume (PVt)
from the bulk volume (Vb) for each plug sample:
GV = Vb − Vt ....................................................................................................................... (4)
GD is then the amount of weight of grain or core material (Wdry) per volume of grain (GV) in
the given sample:
27
3. Wdry
GD = ....................................................................................................................... (5)
GV
These sets of data are analyzed using cross-plots correlating pairs of data to define relationships
and quality controls. For instance it is observed in Fig. 1.4-2 that porosity and permeability
increase or decrease more or less simultaneously below a depth of 7195 ft, while the relationship
of φ and K above this depth is more complex. Implications regarding variability and lithological
controls on rock-fluid behavior will be further discussed in the following sections.
1.4.2.2.3 Mercury Injection Techniques: Capillary Pressure, Pore Distribution, Pore
Throat and Connectivity
Mercury injection (Reservoirs Inc., 1996) into core plugs is used to determine capillary
pressures, pore throat sizes, connectivity, relative quality of different rocks and Leverett’s “J”
function. This procedure utilizes a vacuumed injection chamber to hold a core plug. A specific
distance between the injection of mercury and the core plug was allowed to avoid undesirable
pressure changes. Mercury starts invading the core pore system specific applied pressure or
threshold pressure. This specific threshold pressure remains constant until mercury intrusion
ceases. At this point the pressure and the amount of mercury injected is recorded. The pressure is
then increased incrementally and the same procedure is repeated. In this case the range of
pressures selected was 0-2000 psia and 0-60,000 psia for high-pressure measurements. The test
results were used to calculate pore throat radii and Leverett’s “J” function.
1.4.2.3 Rock Types and Rock-Fluid Properties
The Rock Types previously described (see section 1.3) were defined based on their petrophysical
properties. For each of these we found a rock-fluid model with unique pore geometry, a
determined mineralogical composition and certain specific fluid flow characteristics. Each of
these six rock-fluid models is directly related to their analogous previously described
petrographic categories.
1.4.2.3.1 Discussion of Petrophysical Properties
Accurate representation of rock-fluid properties is necessary when obtaining petrophysical data.
Laboratory techniques that implement injection of nitrogen, helium and mercury into core plug
samples are very accurate in obtaining reservoir properties. This section presents permeability
and porosity data from nitrogen and helium injection respectively (Reservoir Inc., 1996).
Helium is capable of filling up all connected space inside a rock sample thus giving accurate
porosity values. Mercury, a non-compressible fluid, is a non-wetting fluid that does not react
with the rock and also possesses the ability to completely occupy pore space. Thus,
measurements using mercury injection are very accurate in determining pore throat values.
The goal of this work was to define reservoir rock character and to distinguish it from all other
types of rocks encountered within the Spraberry strata sequence. The different data sets were
analyzed to determine correlations between porosity and permeability behavior and lithologic
28
4. controls on reservoir quality. Capillary pressure analysis is presented to define pore throat
systems for each rock type.
1.4.2.3.2 Permeability, Porosity and Water Saturation Relationships:
Core plug samples selected for detailed analysis in this study have a wide dynamic range of
porosity (0.4 to 13.7%) and permeabilities (0.01 to 1.97 md). The dispersion of porosity–
permeability data is such that permeabilities range over an order of magnitude for any given
value of porosity (Fig. 1.4-3 and 1.4-4). This dispersion of porosity–permeability data reflects
changes in the volumetric distribution of pore types within the reservoir.
The first striking point that can be drawn from the depth profile of porosity and permeability
(Fig. 1.4-2) for E.T. O’Daniel is the difference in correlation match approximately below and
above the depth of 7175 ft. Above this depth there is a poor match between porosity and
permeability due to great variation in lithology. A number of heterogeneities at various scales
tend to deteriorate fluid conductivity. These include dispersed and laminated clay matrix,
abundant organic matter, bioturbation, soft sediment deformation within shaly laminae, and silica
cement within sandy laminae. In this way pore interconnection is considerably reduced for many
samples while its total porosity remains relatively high. However, the sandy areas that comprise
the reservoir interval 5U unit (below 7175 ft) exhibit a better correlation between porosity and
permeability. Better fluid conductivity is related to bigger pore spaces and pore throat radius
present in Rock Types “A” and “B” within this area.
A set of six cross plots are presented in Figs. 1.4-3 and 1.4-4 relating porosity and permeability
data (Reservoir Inc. 1996) to observable lithofacies (see section 1.2) as defined from core plug
samples of Shackelford 138-A (Fig. 1.4-3) and E.T. O’Daniel 37 (Fig. 1.4-4). Strong evidence is
presented for depositional controls on porosity and permeability. For instance, Lithofacies 6
(massive sandstone and siltstone), a product of high-energy deposition, shows the best reservoir
properties in the porosity-permeability cross plot. Massive dolostone (Lithofacies 1) and shale
(Lithofacies 2), from low energy environments, show very low reservoir quality. However the
clusters of points for each lithofacies type are not totally distinct from each other. The
overlapping of depositional lithofacies in these graphs is probably caused by a number of factors
including diagenesis, similarity in pore-structure produced by different depositional
environments and the somewhat subjective nature of specifying lithofacies based on hand
specimens.
Presented in Fig. 1.4-5 and 1.4-6 are contiguous intervals of fluorescing pay zone and non-pay
shaly zones with permeability, porosity and water saturation relationships that suggest strong
mineralogical control. Areas of non-fluorescence ordinarily contain higher amounts of clays
although they may appear quite similar to fluorescent rocks when viewed in normal light.
Although some porous areas exist, non-fluorescent intervals exhibit much less permeability than
fluorescent zones. The low permeability in these relatively porous intervals is probably related to
higher amounts of clay minerals that affect pore throat connectivity. Relatively similar sandy
units do not show obvious evidence of major heterogeneity in core samples. Petrophysical
properties measured in the lab show important variations between fluorescing pay zones and
29
5. non-pay zones richer in clay content, as in the core analysis of the Shackelford 1-38A (see Fig
1.4-5).
Data from the, Shackelford 138A and E.T. O’Daniel 37 cores shown in Fig. 1.4-7 correlate
porosity with Sw measurements. The linear relation with a negative slope clearly indicates the
trend of decreasing water saturation with porosity increase. The variation of both variables along
the depth profile is presented in Fig 1.4-1. This depth profile shows a strong increase of water
saturation within the non-pay, low porous muddy zone. This depth profile of Sw and porosity
further indicates that lithological control is strongly related to fluid-rock behavior.
Previous reports have analyzed wettability data from Spraberry core plug samples using brine
and oil injection and spontaneous imbibition of brine. From these measurements, initial water
saturation, core permeability, and core wettability have been determined. These are very
important factors because of their effect on final oil recovery.
When some mineral facie are water-wet, it means that they posses a hydrophilic character; thus
water will preferentially be attached to the surface of this mineral. If it were the case of a
hydrophobic mineral facie, this would probably be preferentially and electrochemically related to
the oil phase.
Pore walls in the Spraberry sands are formed by a variety of different minerals including quartz,
different types of feldspar, micas, accessory minerals, carbonate cements, clays, organic matter,
pyrite and other less abundant minerals. These different mineralogical species present distinct
wetting behaviors at the microscopic level. The clay rich zones tend to be water-wet in the
Spraberry formation, which contrast with the mixed oil-water-wettability behavior of clean
siltstones and sandstones. Due to this characteristic, the argillaceous and less porous rocks within
the studied intervals exhibit much higher water saturation than the cleaner siltstones and
sandstones.
Due to variations in composition from one core plug to another, the behavior of the capillary
pressure-Sw curve presents considerable differences (Fig. 1.4-9). The Amott wettability index to
water (Iw) was determined to be between 0.22 and 0.35. As a result of this mineralogical
heterogeneous character, the Spraberry reservoirs are considered weakly or moderately water-
wet.
The microscopic displacement efficiency during spontaneous water imbibition varies from 10%
to 15% depending upon core permeability. In turn permeability depends on rock properties such
as pore throat size, pore size distribution, pore connectivity, tortuosity, and rock-fluid properties
such as capillary pressure and wettability.
Spraberry sandstones have been found to imbibe oil spontaneously without requiring any
pressure input, due to the partially oil wet character of the rocks. This behavior does not favor oil
recovery by conventional water flood techniques. At a certain point, water injection would not be
able to move any more of the oil that is trapped in hydrophobic intergranular pore cavities.
30
6. 1.4.2.3.3 Grain Density and Porosity Relationships:
Presented in Fig.1.4-8 are additional analyses of lithological controls on reservoir quality. Grain
density is strongly related to lithological character. There is a hyperbolic relation with a positive
slope for porosity and grain density data from the core. A cluster of points in the top left corner
can be discriminated as carbonate muddy rocks with their typical high grain density, very low
porosity and petrographic characteristics. Table 1.4-1 summarizes the general trends found in the
petrophysical data for three major subdivisions of rock types: 1) Clean sandy rocks, 2) Shaly and
silty non-fluorescent rocks, and 3) Dolostones.
Notice that these three subdivisions represent the major trends that occur in the Spraberry
Formation (i.e. Rock Types “A,” “B,” “C,” “E,” and “F”). Patchy dolomitic siltstone “Rock
Type D” falls between “B” and “F” (see Fig.1.4-8). This category shows slightly higher grain
density range and lower porosity than “B” due to the higher amounts of dolomite cement present.
1.4.2.3.4 Capillary Pressure and Pore Throat Relationships:
Mercury injection data from core plug samples from the Shackelford 138A and E.T. O’Daniel 37
is presented in this section. A set of cross plots that correlate porosity, permeability and pore
throat data is shown in Fig. 1.4-10. The results show consistency between rock-fluid parameters
and those obtained in the petrographic study. Summarized in Table 1.4-2 are the results (average
values) for each rock type from helium, nitrogen and mercury injection.
The analysis of petrophysical data emphasizes the heterogeneous nature of the Midland basin
deposits. From this data, one can see distinct differences among Rock Types occurring in the
upper Spraberry Formation. As expected from thin section analysis, Rock Types “A” and “B”
present the best potential reservoir rocks. These consist of very fine sandstones and siltstones
with variable pore structures. Rock Types “C,” “D” and “F” required higher pressures to pass
fluid through tight pore systems with very small pores and pore throat radii. No measurements of
Rock Type “E” (shale) samples were made due to its obvious poor reservoir quality. Rock Types
“C,” “D,” “E” and “F” are considered to be marginal reservoirs to poor or non-reservoir rocks.
They are dolostones and patchy dolomitic siltstones, and shales and shaly siltstones with variable
organic content. The following detailed enumeration of results for each Rock Type includes
description of the different petrographical and petrophysical parameters affecting their pore
system.
1.4.2.4 Description of Rock Types
Rock Type A – The average values of porosity and permeability are 11.07% and 0.445 md
respectively. This rock type is dominated by intergranular macropores of Pore Type 1 (30-
40µm), Pore Type 2 (15-30µm) and secondary dissolution Pore Type 5 (50µm). Intergranular
macropores (PT1) are relatively large and are well interconnected through large pore throats of
relatively uniform size. The rock is very fine to fine grained, well-sorted sandstone to coarse
siltstone, with massive sedimentary fabric. Thin section analysis reveals that the hydrocarbon-
31
7. bearing samples classified as Rock Type “A” have relatively well preserved intergranular pore
systems. Quartz overgrowths, patchy dolomite cement, and dispersed pore-filling clays produce
some reduction of total pore volume. Illite, chlorite and smectite have also reduced pore volume.
These minerals have formed pore linings and caused pore throat bridging, which in turn has
resulted in the partitioning of pore space near pore walls into micropores (Pore Type 4 <5 µm in
diameter). Type 2 pores are much less abundant than Type 1 pores. Type 3 pores are not
significant components of the pore system. Capillary pressure data shows a relatively high
average value of 156.7 psia necessary to intrude the larger system of pore throat radii (0.53 µm)
reflecting moderate obstruction of the intergranular pore system. Relatively high displacement
pressures for sandstones with moderate porosity are the product of small pore throats and
significant amount of pore lining and pore bridging illite clay and carbonate cements.
Rock Type B – These are lesser quality reservoir rocks with average values of 9.49% for porosity and
0.041md for permeability. They are very fine to fine grained, moderately to well sorted siltstones
dominated by Type 2 pores (intergranular macropores 15-30 µm diameter). Type 3 (intergranular
mesopores 5-15 µm diameter) are less abundant, but common within these rocks. Silica cement
is present filling pore spaces. Carbonate and clay cementation has partitioned pore space near
pore walls into micropores (Type 4 pores). Pore Types 1 and 5 are not significantly developed.
The larger pore throat radii averages 0.15 µm and has displacement pressure of 629.9 psia.
Rock Type C – These are carbonate muds (dolostones) equivalent to the carbonate debris flow
deposits of Lithofacies 1. These carbonates have very low porosity (0.70% avg.) and permeability
(0.013 md avg.) and are not reservoir rocks. For this reason the pore structures of these rocks
have not been studied in any detail (two samples studied). Very small pore throat apertures of
0.0035 µm need extremely high displacement pressures (10,464 psia) to intrude them. These are
essentially moderate quality seal rocks rather than potential reservoirs.
Rock Type D – Porosity for these patchy dolomitic siltstones is 4.70% and very low
permeability averages 0.01 md (one sample). Rocks of Type “D” are moderately well to well
sorted siltstones and sandstones dominated by Type 3 pores (intergranular mesopores 15 µm
diameter). They display poorly preserved pore systems and have massive, laminated, or
disturbed sedimentary fabrics. Type 2 pores (intergranular macropores 15-30 µm diameter) are
less abundant. Microporosity (Type 4 pores) is developed within clay cement rims on grains. The
microporous clays tend to severely obstruct intergranular pores. Type 1 macropores scarcely
occur within these rocks. Type 5 (dissolution) pores are also very rare. Pore throat radii (0.045
µm) are considerably obstructed; thus, moderately high displacement pressure (1,196 psia) is
required to intrude them.
Rock Type E – Porosity found for these samples averages 3.14%, while average permeability is
0.025md. These are very tight rocks with very high amounts of clay, organic matter, and
carbonate mud mixed within an argillaceous matrix. Type 5 rocks are shales characterized by
micropores (Pore Type 4) and very small modal pore throat radii. Data from capillary pressure
mercury injection was not recorded for these samples due to their extremely low reservoir
quality. These rocks commonly form permeability seals, not reservoir rocks.
32
8. Rock Type F – Average porosity and permeability for five samples are 6.36% and 0.022 md
respectively. Rock Type “F” are moderately to poorly sorted clay rich siltstones. Samples display
massive, laminated, or disturbed sedimentary fabrics, and are characterized by the virtual
absence of visible porosity. Intergranular pore space is severely occluded by abundant detrital
clays or dolomite cement. Estimated microporosity is high for clay–rich samples, but low for the
dolomite-cemented samples. Main pore types present are mesopores of 5 to 15 µm. Though
porosities and permeabilities are slightly higher than Rock Type D (patchy dolomitic siltstones),
the average value for modal pore throat radii is considerably smaller (0.039 µm). Displacement
pressure necessary to intrude the larger set of pore throats in Rock Type “F” is 2,637.8 psia,
more than double that used in Rock Type “D.”
1.4.3 Summary
Rock Types “A” and “B” are potential reservoir rocks. These are distinguished from one another by
different pore structures. Rock Type “A” has the best reservoir quality and is characterized by
the largest intergranular and dissolution macropores and largest interconnecting pore throats.
Rock Types “B,” “D,” and “F” are characterized by progressively poorer reservoir quality, the
result of reduced pore and pore throat sizes. Rock Types “C” and “E” are carbonate muds and
shales that completely lack reservoir properties and form moderate quality seal rocks.
The occurrence of the largest pores and pore throats in Rock Type “A” is a function of several
factors including:
1. Rock Type “A” is the coarsest grained sandstones and siltstones.
2. Rock Type “A” very fine sandstones and siltstones are better sorted than other Spraberry
rocks and contain smaller amounts of depositional micritic mud, carbonate cements, clay
matrix, clay cements, and organics.
3. Rock Type “A” very fine sandstones and siltstones are characterized by relatively open grain
packing (compactional effects are not pronounced).
The reservoir quality of Rock Type “A” and “B” is strongly tied to mineralogical and textural
properties such as grain size, grain sorting, clay type and content, and carbonate cement. These
are parameters that strongly control pore and pore throat size, permeability, capillary pressure,
and wettability. Individual pores and pore throats in Spraberry sandstones are of relatively small
sizes and this, in turn, is related to the very fine sand and siltstone grain size of these rocks (J.
Neasham, 1977).
Rock Type “B” has a more complex pore structure than Rock Type “A.” This complexity is a
function of finer grain size, increased occurrence of depositional shale laminae (as well as some
organics), carbonate and silica cements, and increased effects of compaction. Owing to the
presence of shale laminations in some samples, substantially reduced vertical permeability is
noted when compared with Rock Type “A.” These factors contribute to produce small pore size
(these rocks are generally characterized by pores of less than 30 µm diameter) and pore throat
size as well as a large standard deviation of pore and pore throat sizes. While varying little in
total porosity from Rock Type “A” sandstones, reduced permeability in Rock Type “B”
33
9. sandstones is a function of this smaller pore and pore throat size and slightly higher amounts of
clays and carbonates.
Rock Type “D” and “F” siltstones present varying degrees of heterogeneities, as a result binary,
skewed, and uniform pore size distributions are all noted. Lithologies are a mixture of: 1)
Micropore-dominated, shale/organic layers (distorted in the case of bioturbated rocks) and; 2)
Primary intergranular pore-dominated sand layers with dolomite patches, and dispersed clays.
The pore systems of Rock Type “D” differ from good reservoir rocks “A” and “B,” in that most
of the porosity in these rocks is poorly interconnected and consists of intergranular mesopores
(generally 5-15 µm diameter).
Rock Types “C” and “E” are essentially nonporous and impermeable seal rocks. High pressure
mercury injection capillary pressure data indicate that displacement pressures are very high,
ranging from 1000 to 15,000 psia. These tightly cemented samples have very small modal pore
throat radii, ranging from 0.004 to 0.05 microns.
1.4.4 References
1. Guevara, E. H., 1988, Geological characterization of Permian submarine fan reservoirs of the
Driver waterflood Unit, Spraberry Trend, Midland Basin, Texas; BEG, UT Austin; Report of
Investigation No. 172.
2. Neasham, John W., The morphology of dispersed clay in sandstones reservoirs and its effect
on sandstones shaliness, pore space and fluid flow properties, Society of Petroleum
Engineers, paper SPE 6858, Annual Technical Conference and Exhibition held in Denver,
CO, October 9-12, 1977. Shell Development Company.
3. Reservoirs Inc., 1996, Internal report: Core analysis, Parker & Parsley Development, L. P.
Midland County, Texas.
4. Tyler, N. and Gholston, J. C., 1988, Heterogeneous deep-sea fan reservoirs, Shackelford and
Preston waterflood units, Spraberry Trend, West Texas; BEG, UT at Austin, Report of
Investigation No. 171.
34
10. Phi vs. K
Gamma Ray Porosity vs Grain Density Porosity vs Sw
Mineral Composition% Permeability (md)
API units Air Permeability (md) Porosity (%) Porosity (fraction)
40 90 140 0 50 100 0 1 2 3 0.01 0.1 1 10 0 5 10 0 0.04 0.08 0.12 0.16
7170
7180
Qtz
7190
Porosity
7200
7210
35
Porosity
7220
Feldspa
Porosity
7230
Porosity
7240
Matrix
Cement
7250
0 5 10 15 2.5 2.6 2.7 0 0.3 0.6 0.9 1.2
Porosity% Grain Density G/CC Water Saturation
(fraction)
Fig. 1.4-1 Core E.T O'Daniel 37 - Integration of Petrographic and Petrophysics Data
11. Porosity vs. Permeability
E.T. O'Daniel 37 Core
(only samples from depths range 7195-7245 ft)
10
y = 0.0463e 0.1706x
Permeability-Max (md)
R2 = 0.2751
1
0.1
0.01
0 2 4 6 8 10 12 14
Porosity (%)
Porosity vs. Permeability
E.T. O'Daniel 37 Core
(only samples from depths range 7080-7195 ft)
10
Permeability-Max (md)
1
0.1
0.01
0 2 4 6 8 10 12 14
Porosity (%)
Fig. 1.4-2 Cross plots illustrate the differences in porosity-permeability correlation for
samples above and below 7195 ft depth for E.T. O’Daniel 37 core
36
14. Core Data Analysis
Shakelford 1-38 A (Upper Spraberry, 1U)
0.2 1
0.19
Porosity
0.18 0.9
0.17 Sw
0.16 0.8
0.15
0.14 0.7
Water Saturation (core)
0.13
Porosity (core)
0.12 0.6
0.11
0.1 0.5
0.09
0.08 0.4
0.07
0.06 0.3
0.05
0.04 0.2
0.03
0.02 0.1
0.01 Fluorescing pay zone Non-pay muddy zones
0 0
7082 7083 7084 7085 7086 7087 7088 7089 7090 7091 7092 7093 7094 7095 7096
Depth, ft.
Fig. 1.4-5 Comparison of fluorescing pay zone and non-pay zones richer in clay content.
For Shackelford 1-38A
Core Data Analysis
Shakelford 1-38 A (Upper Spraberry, 1U)
0.15 10
0.14
0.13
0.12
0.11
Permeability (Kmax), mD (core)
0.1 1
Porosity (core)
0.09
0.08
0.07
0.06
0.05 0.1
Porosity
0.04
Kmax
0.03
0.02
0.01
Fluorescing pay zone Non-pay muddy zones
0 0.01
7082 7083 7084 7085 7086 7087 7088 7089 7090 7091 7092 7093 7094 7095 7096
Depth, ft.
Fig. 1.4-6 Non-fluorescent zones are commonly lower quality reservoirs and non-reservoir
rocks strongly affected by pore lining and pore bridging clays.
39
15. Porosity vs. Water Saturation
Cores E.T. O'Daniel 37 and Shackelford 138A
1.2
y = -0.0476x + 0.9497
2
R = 0.6307
1
Water Saturation, fraction
0.8
0.6
0.4
0.2
0
0 2 4 6 8 10 12 14 16
Porosity (%)
Fig. 1.4-7 Porosity vs. water saturation form the E.T. O’Daniel 37 and Shackelford 1-38A.
40
16. Porosity vs Grain Density (core)
Shackelford 138A and E.T. O'Daniel 37
2.8
y = 0.006x + 2.5997
2
R = 0.1666
2.75
C
Grain Density, G/CC (core)
2.7
Dolostones Patchy Dolomitic
D
Non-Fluorescent Siltstones
2.65
A
B
Clean Sandy Rocks
Fluorescent
2.6
F
E
2.55
Shaly and Silty
Non-Fluorescent Rocks
2.5
2.45
0 2 4 6 8 10 12 14
Porosity (%)
Fig. 1.4-8 Grain density vs. porosity cross-plot suggests strong lithological controls on
reservoir quality.
41
17. Table 1.4-1 Summary of grain density data correlated with the major Rock Types.
Major lithologic types - small scale categories - upper Spraberry formation
Main Group Clean Sandy Rocks Shaly and Silty Dolostones
Non-Fluorescent Rocks
Mostly massive structure, Laminated, bioturbated, or Mostly massive carbonate
low clay amounts, good convoluted, very low rich mudstones, poor
porosity and pore throat porosity, main mineral porosity to total absence of
Description radius, main mineral component are clays and pore space, main mineral
component is quartz. quartz. Include Rock Types components are dolomite
Include Rock Types “A” “E” and “F” mud, and quartz. Include
and “B” Rock Type“C”
Fluorescent
Fluorescent Non-Fluorescent Non-Fluorescent
Capacity
Grain Density 2.70 to 2.64 g/cc 2.60 to 2.51 g/cc 2.75 to 2.73 g/cc
12% (“A”) 3.8% (“E”)
Porosity (helium) 1.0%
9.95% (“B”) 7.3% (“F”)
Permeability 0.64 md (“A”) 0.056 md (“E”)
0.12 md (“B”) 0.048 md (“C”)
(nitrogen, avg.) 0.034 md (“F”)
Sw (from J- 35% (“A”) 75% (“E”)
79%
function) 44% (“B”) 61% (“F”)
Table 1.4-2 Summary of helium, nitrogen and mercury injection data for plugs of different
Rock Types that form the Spraberry Formation.
MODAL
PORE DISPLACEMENT AMOUNT
ROCK POROSITY PERMEABILITY
THROAT PRESSURE RANGE OF
TYPE (%) (md)
RADIUS (psia) SAMPLES
(µm)
A 12 0.64 0.53 74.8-161 7
B 9.95 0.12 0.15 300-602 7
C 1.0 0.05 0.0035 11,943-4,980 2
D 8.0 0.18 0.045 987 1
E 3.8 0.06 0.0075 3,491 2
F 7.2 0.03 0.06 1,434 3
42
18. Water-Oil Capillary Pressure in Spraberry Sands
70
Estimated from Mecury Injection, Porosity = 0.10, Permeability = 0.5
md, IFT = 32 mN/m, Contact Angle = 60 degrees
Core #H7, Chloroform-Cleaned Core
60
Core #SPv, As-It-Was Core
Capillary Pressure (psig)
50 Core #R4, Chloroform-Cleaned Core
Core #R8, Chloroform-Cleaned Core, First Cycle
40 Core #R8, Chloroform-Cleaned Core, Second Cycle
Core #R7, Chloroform-Cleaned Core
30 Pc determined by numerical simulation at reservoir temperature
20
10
0
0 0.1 0.2 0.3 0.4 0.5 0.6 0.7 0.8 0.9 1
Water Saturation (PV)
Fig. 1.4-9 Graph showing several curves for Sw and capillary pressure from imbibition
experiments done with core plugs from various depths.
43
19. Porosity vs. Permeability
(helium and nitrogen injection - cores Shackelford 138A and E.T. O'Daniel 37)
1.2
RT-A RT-B
1 RT-C RT-D
RT-E RT-F
Permeabiltiy (md)
0.8
0.6
0.4
0.2
0
0.0 2.0 4.0 6.0 8.0 10.0 12.0 14.0
Porosity (%)
Pore Throat Radius vs. Porosity
(mercury and helium injection - cores Shackelford 138A and E.T. O'Daniel 37)
Pore Throat Modal Radius vs. Permeability
(mercury and nitrogen injection - cores Shackelford 138A and E.T. O'Daniel 37)
0.7
0.7
RT-A RT-B RT-A
0.6
RT-B
RT-C RT-D 0.6
Pore Throat Radius (mm)
RT-C
Pore Throat Radius (mm)
0.5 RT-E RT-F RT-D
0.5 RT-E
RT-F
0.4
0.4
0.3
0.3
0.2
0.2
0.1
0.1
0
0.0 2.0 4.0 6.0 8.0 10.0 12.0 14.0 0
0.001 0.01 0.1 1 10
Porosity (%)
Permeability (md)
Fig. 1.4-10 Three cross-plots presenting mercury injection data correlated with
porosity-permeability and pore throat radius. Cross-plots suggest that rock-fluid
behavior is linked to lithological variability for the six Rock Types under study.
44