SlideShare ist ein Scribd-Unternehmen logo
1 von 9
Downloaden Sie, um offline zu lesen
International Journal of Mathematics and Statistics Invention (IJMSI)
E-ISSN: 2321 – 4767 P-ISSN: 2321 - 4759
www.ijmsi.org Volume 2 Issue 5 || May. 2014 || PP-01-09
www.ijmsi.org 1 | P a g e
On The Use Of Exponentially Weighted Moving Average (Ewma)
Contrl Chart In Monitoring Road Traffic Crashes.
1
O.J. Braimah, 2
P.A. Osanaiye.3
P.E. Omaku 4
Y.K. Saheed 5
S.A. Eshimokhai
1
Department of Statistics, Abdur-Raheem college of Advanced Studies Igbaja, Ilorin, Kwara State, Nigeria.
2
Department of Statistics, University of Ilorin, P.M.B 1515 Ilorin, Ilorin, Kwara State, Nigeria. 3
Department of
Mathematics and Statics, Federal Polytechnic Nasarawa, Nasarawa State, Nigeria.
4
Department of Computer Science, Abdur-Raheem college of Advanced Studies Igbaja, Ilorin, Kwara State,
Nigeria.
5
Department of Safety and Environmental Management, Edinburgh Napier University, Scotland.
ABSTRACT: This study is aimed at designing Exponentially Weighted Moving average (EWMA) control
chart in monitoring road crashes. The data used in this study is a secondary data from the accident record
office of the Federal Road Safety Commission (FRSC), Zone RS8 Command Headquarter, Offa Road, GRA,
Ilorin, Kwara State, Nigeria for the period of January, 2000 to December, 2010. Cumulative Exponentially
Weighted Moving Average (EWMA) control char scheme was designed and used to study the rate of road
crashes. Finally, the performance of the control chart schemes was compared by varying the weighted
parameter (w=0.15, 0.20 and 0.30). It was observed that EWMA control chart scheme is sensitive in detecting
small shift in the process but more sensitive in detecting shift in the process mean with higher weighted
parameter (W). Therefore, the higher the weighted parameter, the faster it detects an out of control signal. Thus
providing validation of the methodology employed to set up Minitab using Neubauer table in determining the
weighted parameter, limit q of the EWMA chart and the nominal ARL.
I. INTRODUCTION
The mandate of Federal Road Safety Commission (FRSC) which is reducing road accidents on our
roads can be viewed as rendering services to the citizens of Nigeria and the more the road accidents are
curtailed, the better the costumers (citizens) are satisfied. Shewhart chart has been widely used in determining
shift in a process, however the main disadvantage of any of Shewhart charts is that they use only the last
information of the combined process and ignore any other process given by the sequence of all points. This
characteristic makes Shewhart control charts relatively insensitive to a small change in a process, because the
cumulative or weight of the previous observation are disregarded. Small changes could be detected through
CUSUM, EWMA and Moving Average control charts. These charts could be used as a complementary tool for
X-bar, through which, small and large changes could be detected. Some authors, such as Dugans (1974), Lucas
(1976), stated that the cumulative sum control chart is much more efficient than the usual control chart
for detecting small variations in the average. Other authors including Crowders (1987) presented the
exponentially weighted moving average control chart, as good choice to detect small change in process average.
Various modification and supplemental criteria have also suggested that control charts based on moving average
is also an effective chart in detecting small process change.In this study, road crashes from the Accidents Record
Office of Federal Road Safety Commission (FRSC) which comprises of Kwara, Kogi and Ekiti state is studied
using cumulative-sum (CUSUM), exponentially weighted moving average (EWMA) and moving average
control charts.
II. MATERIALS AND METHODS
THE EXPONENTIAL WEIGHTED MOVING AVERAGE (EWMA)
The Exponential Weighted Moving Average (EWMA) chart is used for monitoring process by
averaging the data in a way that give less weight to old data as samples are taken and give a high weight to most
recent data. It is also effective in detecting small shifts.The EWMA chart methodology was developed by
Roberts (1959) who purposed it for use by some organizations, particularly in the process industries, financial
and management control as the basis of new control/performance charts system. The EWMA charting procedure
is sometime used to monitor the rate of occurrence of rare events where the time between two successive
occurrences is exponentially distributed. This procedure can also be used extensively in time series modeling
and forecasting. The EWMA for individual value may be defined as:
On The Use Of Exponentially Weighted…
www.ijmsi.org 2 | P a g e
where …………………………1
The above equation is due to Roberts (1959).
The use of this control chart was first published in the article “Control chart tests based on geometric moving
averages” (Roberts, 1959). While Shewhart charts only consider the most recent data point in testing to
determine if statistical limits have been exceeded, EWMA charts consider all previous points using a weighing
factor that makes the outcome more influenced by recent points. In statistical quality control, the EWMA chart
(or exponentially-weighted moving average chart) is a type of control chart used to monitor either variables or
attributes-type data. While other control charts treat rational subgroups of samples individually, the EWMA
chart tracks the exponentially-weighted moving average of all prior samples. EWMA weights samples in
geometrically decreasing order so that the most recent samples are weighted most highly while the most distant
samples contribute very little. Although EWMA chart assumes normal distribution, it is relatively robust in the
face of non-normality. The chart monitors only the process mean. EWMA Charts are generally used for
detecting small shifts in the process mean and they detect shifts of 0.5sigma to 2sigma much faster than
Shewhart charts with the same sample size. In brief, after multiplication by a weighting factor w, the current
measurement is added to the sum of all former measurements, which is weighted with (1 - w). Thus, at each time
t (t = 1, 2,... ), the test statistic .
Basically, the method is to form a new moving average at each sample point by calculating a weighted average
of new value and previous moving-average. Therefore, in exponentially weighted moving average chart, all of
the past data has some effect on the current value, but it rapidly loses influence.
Consider the following notations:
= Exponentially Weighted Moving Average
= EWMA weighted parameter ( )
µ0 = Process mean
= jth
measure of ith
subgroup, with
= Process standard deviation
= Sample size of ith
group
q=sigma limit
= Mean of measurement in ith
subgroup. If , then subgroup mean reduce to the observation in the group
Each point on the chart indicates the value of exponentially weighted moving average (EWMA) for the
subgroup. The EWMA for the ith
subgroup is defined recursively as:
, where w is the weighted parameter ( ).
III. COMPUTATION OF CONTROL LIMIT
By default, the central line on an EWMA chart indicates an estimate for µ, which is computed as:
……………………………………………………………………………2
The default limits are computed as (referred to as 2.30 limits).
The upper and lower control limits are
……………………………………………………………………………3
…………..……………………………………………………………….4
where „n‟ is the subgroup size (1).
CHOOSING THE VALUE OF WEIGHTED PARAMETER (w)
The following shows how we might set up an EWMA chart by the five-step procedure:
 Select an in-control Run Length (RL) of 45. This is
also the average run length (ARL) of the Westgard algorithm.
 Define the optimum shift to be detected as 1.0 as
used in this paper.
 Using this shift sizes and the above ARL, gives a
weighting factor w of 0.15 (Fig. 2).
 With these selected values derived from Fig. 2,
EWMA chart limit q of 2.30 is selected (Fig. 3). For one control sample per month (n = 1), upper control
limit (UCL) and lower control limit (LCL) are calculated as equation 3 and 4 above.
On The Use Of Exponentially Weighted…
www.ijmsi.org 3 | P a g e
 Enter the weight parameter (w), historical mean,
sigma (standard deviation) and the sigma limit (S limit) to the MINITAB 14 EWMA chart dialog box as
displayed in Fig. 1 below.
EWMA CHART DIALOG BOX
Figure 1
In order to accurately compare EWMA control chart techniques, the same ARL value must be used for the
design.
A graphical method for determining the ARL for an EWMA control chart is seen in Fig. 2 and 3 below,
Neubauer (1997). One can obtain the weighting factor “w” as a function of the desired shift sensitivity of the
chart. For a shift of 1.0standard deviation,for example, a weighting factor of 0.15 can be obtained from the
chart as shown in figure 2 and we set ARL at 45, using Fig. 3, the sigma limit (q) was obtained to be 2.30.
Fig.2: Optimal w for EWMA charts according to the shift d from Neubauer (1997)
On The Use Of Exponentially Weighted…
www.ijmsi.org 4 | P a g e
FIG. 3: Determining the limit q of the EWMA chart after selection of w and the nominal ARL from
Neubauer 1997.
ASSESSMENT OF PERFORMANCE OF EWMA CHART
A number of authors have studied the design of EWMA control scheme based on Average Run Length
(ARL) computation. Ideally, the ARL should be short when a shift occurs and should be long when there is no
shift. The effect of “w” (weight parameter) on the ARL was described by Robert (1959), who used simulation
method. The ARL function was approximated by Robinson and Ho (1978).
IV. DATA ANALYSIS
The analysis of the data (number of road crashes) obtained from the Federal Road Safety Commission
(FRSC) were considered using EWMA control chart scheme
The overall mean per month is approximately , the standard deviation from the historical data is
and the subgroup size (n) is 1.
EWMA CHART METHOD
The EWMA statistic was calculated using three different values of w (weighted parameters), 0.15, 0.20
and 0.30 so as to come out with the most appropriate one.
The following shows how we set up an EWMA-chart by the three-step procedure:
 Select an in-control Run Length (RL) of 45. This is also the average run length (ARL) of the Westgard
algorithm.
 Define the optimum shift to be detected as 1.0, 1.2 and 1.5. Using this and the above ARL, gives a
weighting factor w of 0.15, 0.20 and 0.30 (Fig. 2).
 With these selected values derived from Fig. 2, EWMA chart limit (q) were obtained to be2.30, 2.35 and
2.42 from Fig. 3. For one control sample per month (n = 1), the central line, upper control limit (UCL) and
lower control limit (LCL) are calculated as follows.
CENTRAL LINE = = s
CONTROL LIMITS
=36.51+2.30(23.01) = 36.51+15.07= 51.58
=36.51-2.30(23.01) = 36.51-15.07= 21.44
Using the same procedure, the control limits calculation for w = 0.1, 0.2 and 0.3 is shown in table 1 below.
TABLE OF EWMA CONTROL LIMITS
WEIGHTED/SIGMA
LIMIT VALUE
CONTROL LIMITS
LCL CL UCL
w = 0.15
q = 2.30
21.44 35.51 51.58
w = 0.20
q = 2.35
18.49 36.51 54.53
w = 0.30
q = 2.42
13.12 36.51 59.90
Table 1.
COMPUTATION OF EWMA STATISTIC
The EWMA statistic is calculated using three (3) different values of w (weighted parameter) so as to
come out of the appropriate value.
The statistic is
Zi =wxi + (1-w) , 0 < w ≤ 1
For w =0.15,
Z1 = 0.15(15) + (1 -0.15)36.51=33.28
Z2 = 0.15(31) + (1 – 0.15)33.28=32.948
Using the same procedure, the EWMA statistic for w =0.15, 0.20 and 0.30 is shown in table 2.
On The Use Of Exponentially Weighted…
www.ijmsi.org 5 | P a g e
Fig. 4,5 and 6 below represents the EWMA charts for w = 0.15, 0.20 and 0.30 respectively when the values of Zi
where plotted against sample number.
EWMA CHARTS ON ROAD CRASHES IN ZONE RS8
The figures below display the EWMA charts with different weight parameters (w).
Fig. 4.
Fig. 5.
On The Use Of Exponentially Weighted…
www.ijmsi.org 6 | P a g e
Fig. 6.
From the EWMA charts above, the process is out of control for the three values of weighted parameter (w) and
they indicate out of control signals at different points. For w =0.15 and 0.20, both charts detected the first out of
control signal at point 119 which correspond to November, 2009 while for w= 0.30, the first out of control
signal was at sample point 118 which corresponds to October, 2009. Therefore, the higher the weighted
parameter, the faster it detects an out of control signal. Thus providing validation of the methodology employed
to set up Minitab using Neubauer table in determining the weighted parameter, limit q of the EWMA chart and
the nominal ARL.Therefore, the higher the weighted parameter, the faster it detects an out of control signal.
COMPUTATION OF EWMA STATISTIC ON ROAD TRAFFIC CRASHES IN ZONE RS8 FOR THE
YEAR 2001 to 2010
Sample No.
(i)
No of Road Crashes
(Xt)
zt = [wXi + (1 - w)zt-1]
w=0.15
w=0.20
w=0.3
1 15 33.28 32.21 30.06
2 31 32.94 31.97 30.34
3 46 34.90 34.77 35.04
4 55 37.92 38.82 41.03
5 44 38.83 42.06 41.93
6 23 36.46 38.25 36.24
7 15 33.24 33.60 29.87
8 11 29.90 29.08 24.21
9 23 28.87 27.86 23.85
10 28 28.74 27.89 25.09
11 44 31.03 31.11 30.76
12 44 32.98 33.69 34.74
13 12 29.83 29.35 27.91
14 30 29.86 29.48 28.54
15 41 31.53 31.79 32.28
16 39 32.65 33.23 34.29
17 45 34.50 35.58 37.51
18 33 34.28 35.07 36.15
19 21 32.29 32.25 31.61
20 17 30.00 29.20 27.23
21 28 29.70 28.96 27.46
22 37 30.80 29.97 30.32
23 22 29.50 28.38 27.83
24 50 32.58 32.70 20.98
25 15 29.94 29.16 19.18
26 12 27.25 25.73 17.03
27 31 27.81 26.78 21.22
On The Use Of Exponentially Weighted…
www.ijmsi.org 7 | P a g e
28 27 27.69 26.83 22.95
29 35 28.79 28.46 26.57
30 22 27.77 27.17 25.20
31 20 26.60 25.73 23.64
32 18 25.31 24.19 21.95
33 23 24.96 23.95 22.26
34 6 22.12 20.36 17.38
35 20 21.80 20.29 18.17
36 28 22.73 21.83 21.12
37 24 22.92 22.26 21.98
38 17 22.03 21.21 20.47
39 38 24.43 24.57 25.74
40 57 29.32 31.06 35.12
41 38 30.62 32.44 35.98
42 16 28.43 29.16 29.99
43 26 28.07 28.52 28.79
44 14 25.96 25.62 24.36
45 26 25.97 25.70 24.85
46 48 29.27 30.17 31.79
47 37 30.43 31.53 33.36
48 50 33.37 35.22 38.35
49 22 31.66 32.58 33.44
50 21 30.06 30.26 29.71
51 35 30.80 31.21 31.30
52 52 33.98 35.37 37.51
53 53 36.83 38.90 42.16
54 27 35.36 36.52 37.61
55 22 33.36 33.61 32.93
56 21 31.51 31.09 29.35
57 23 30.23 29.47 27.44
58 48 32.90 33.18 33.61
59 33 32.92 33.14 33.43
60 64 37.58 39.31 42.60
61 21 35.09 35.65 36.12
62 30 34.33 34.52 34.28
63 22 32.48 32.02 30.60
64 38 33.31 33.21 32.83
65 36 33.71 33.77 33.77
66 38 34.35 36.62 35.04
67 31 33.85 33.89 33.83
68 28 32.97 32.71 32.08
69 22 31.32 30.57 29.06
70 46 33.52 33.65 34.14
71 51 36.12 37.13 39.20
72 61 39.85 41.90 45.75
73 24 37.47 38.32 39.22
74 39 37.70 38.45 39.15
75 20 35.05 34.77 33.41
76 33 34.74 34.41 33.28
77 40 35.53 35.53 35.30
78 30 34.70 34.42 33.71
79 29 33.85 33.34 32.30
80 31 33.42 32.87 31.91
81 18 31.12 29.90 27.73
82 28 30.65 29.52 27.81
83 39 31.90 31.41 31.17
84 46 34.02 34.33 35.62
85 19 31.77 31.26 30.63
86 35 32.25 32.01 31.94
87 35 32.66 32.61 32.86
88 37 33.31 33.49 34.10
89 41 34.46 34.99 36.17
90 39 35.14 35.79 37.02
91 25 33.62 33.63 33.41
92 21 31.73 31.11 29.69
93 19 29.82 28.69 26.48
94 29 29.70 28.75 27.24
95 36 30.65 30.20 29.87
96 51 33.70 34.36 36.21
97 32 33.45 33.89 34.94
On The Use Of Exponentially Weighted…
www.ijmsi.org 8 | P a g e
98 23 31.88 31.71 31.36
99 34 32.20 32.17 32.15
100 42 33.67 34.13 35.11
101 24 32.22 32.11 31.77
102 52 35.19 36.09 37.84
103 26 33.81 34.07 34.29
104 23 32.19 31.85 30.90
105 36 32.76 32.68 32.42
106 33 32.80 32.75 32.60
107 32 32.68 32.60 32.42
108 133 47.73 52.68 62.60
109 32 45.37 48.54 53.42
110 17 41.11 42.23 42.49
111 23 38.39 38.39 36.64
112 25 36.38 35.71 33.15
113 21 34.07 32.77 29.50
114 37 34.51 33.61 31.75
115 32 34.13 33.29 31.83
116 48 36.21 27.43 36.68
117 31 35.43 28.14 34.98
118 131 49.77 48.72 63.54
119 139 63.15 66.77 86.35
120 116 71.08 76.62 95.24
121 44 67.02 70.09 79.87
122 35 62.22 63.08 66.41
123 31 57.54 56.66 55.79
124 20 51.91 49.33 45.05
125 32 48.92 45.86 41.14
126 35 46.83 43.69 39.29
127 53 47.76 45.55 43.41
128 46 47.50 45.65 44.19
129 59 49.23 48.31 48.63
130 89 55.20 45.64 60.74
131 109 63.27 60.65 75.22
132 113 70.73 50.56 86.55
Table 2
V. RESULT
EWMA was designed and applied using three (3) different values of weighted parameters/smoothing
constant (w) which are 0.15, 0.20 and 0.30. Table 2 shows the EWMA statistic tabulation. The values of control
limit for the three values of w are show in table 1. The values of Zi (EWMA) were then plotted against the
sample number for the three values of w and the corresponding EWMA control charts are shown in Fig. 4 to 6
respectively. It can be seen from the charts that the process is out of control for the three values of w. For w
=0.15 and 0.20, both charts detected the first out of control signal at point 119 which correspond to November,
2009 while for w= 0.30, the first out of control signal was at sample point 118 which corresponds to October,
2009. Therefore, the higher the weighted parameter, the faster it detects an out of control signal.
VI. CONCLUSION
The effectiveness of EWMA chart relative to determining shifts in underlying pattern and the
efficiency of the charts relative to the time and expertise required to generate the chart was taken into
consideration. EWMA chart was very capable at detecting changes in the Road Traffic Crashes recurrent
(persistent) pattern when properly configured within Minitab. That is, it is very effective at detecting small
change like mean shift of 1.0 sigma as used in this paper work. In view of our findings, we strongly observed
that EWMA generally provided a slightly faster alarm Since the EWMA methodology detects shift quickly for
this type of dataset, it may be an efficient choice for monitoring it. Conclusively, for such applications within
this organization EWMA can be an efficient tool.
VII. RECOMMENDATION
From Fig. 4 and 5, the first out of control signal at point 119 corresponding to November, 2009 and
continues to February while from Fig. 6 first out of control signal was at sample point 118 which corresponds to
October, 2009 and also continues to February. These months correspond to the Christmas and New-year
celebration periods in Nigeria when most people use the highways to travel to their home towns. It is then
suggested that the Federal Road Safety Commission (FRSC) and other Agencies who are engaged in road safety
On The Use Of Exponentially Weighted…
www.ijmsi.org 9 | P a g e
activities should increase their earnest effort by deploying more Road Safety officers to strategic locations on
the high ways and making sure that road users adhere to traffic rules so as to ensure that Nigeria roads are under
proper check and safe for all traffic roads users in order to reduce the high rate of road traffic crashes probably
leading to loss of lives.
REFERENCES
[1] Crowder, S.V (1987, 1989). Design of exponentially weighted moving average schemes. J. of Qual Technology 21, pp. 155-162.
[2] Crowder, S. V. (1987). A simple method for studyingrun length distributions of exponentially weighted moving average charts.
Technometrics, 29, pp. 401–407.
[3] Dugans, A.J. (1974). Quality control and industrial statistics, 5th
edition.
[4] Hawkins, D. M., Qiu, P., and Kang, C.-W. The Changepoint Model for Statistical Process Control, Journal of Quality
Technology, 35, pp. 355-365
[5] Lucas JM, Saccucci MS (1990). Exponentially Weighted Moving Average Control Schemes: Properties and Enhancements.
Technometrics, 32, pp. 1-12.
[6] Montgomery, D.C. (1996). Introduction to statistical quality control, 3rd
edition, Johnson Wiley & Sons.
[7] Neubauer (1997). Optimal weighted parameter for EWMA chart according to the shift, Technometrics, Vol.22.S
[8] Osanaiye, P.A. (2010). Quality control analysis and management, STA 658.
[9] Pages, E.S (1954). Continous inspection Scheme, Biometrica, 41, pp.100
[10] Roberts, S. W. (1959). Control Chart Tests Based on Geometric Moving Averages, Technomearics, 1, pp. 239-250.
[11] Robinson, P.B. and HO, T.Y. (1978) - Average run lengths of geometric moving average charts by numerical
methods,Technometrics, 20, pp 85–93.
[12] www.jmu.edu
[13] www.uc.edu
[14] www.minitab.com
[15] www.anygeth.com
[16] www.engineerlive.com
[17] www.google.com
[18] www.itl.nist.gov

Weitere ähnliche Inhalte

Was ist angesagt?

Inertial Sensor Array Calibration Made Easy !
Inertial Sensor Array Calibration Made Easy !Inertial Sensor Array Calibration Made Easy !
Inertial Sensor Array Calibration Made Easy !oblu.io
 
Overview of State Estimation Technique for Power System Control
Overview of State Estimation Technique for Power System ControlOverview of State Estimation Technique for Power System Control
Overview of State Estimation Technique for Power System ControlIOSR Journals
 
State Estimation of Power System with Interline Power Flow Controller
State Estimation of Power System with Interline Power Flow ControllerState Estimation of Power System with Interline Power Flow Controller
State Estimation of Power System with Interline Power Flow ControllerIDES Editor
 
Neural Network Approach to Railway Stand Lateral SKEW Control
Neural Network Approach to Railway Stand Lateral SKEW ControlNeural Network Approach to Railway Stand Lateral SKEW Control
Neural Network Approach to Railway Stand Lateral SKEW Controlcsandit
 
ADAPTIVE TREADMILL CONTROL BY HUMAN WILL
ADAPTIVE TREADMILL CONTROL BY HUMAN WILLADAPTIVE TREADMILL CONTROL BY HUMAN WILL
ADAPTIVE TREADMILL CONTROL BY HUMAN WILLtoukaigi
 
MODELLING ANALYSIS & DESIGN OF DSP BASED NOVEL SPEED SENSORLESS VECTOR CONTRO...
MODELLING ANALYSIS & DESIGN OF DSP BASED NOVEL SPEED SENSORLESS VECTOR CONTRO...MODELLING ANALYSIS & DESIGN OF DSP BASED NOVEL SPEED SENSORLESS VECTOR CONTRO...
MODELLING ANALYSIS & DESIGN OF DSP BASED NOVEL SPEED SENSORLESS VECTOR CONTRO...IAEME Publication
 
Evolution of a shoe-mounted multi-IMU pedestrian dead reckoning PDR sensor
Evolution of a shoe-mounted multi-IMU pedestrian dead reckoning PDR sensorEvolution of a shoe-mounted multi-IMU pedestrian dead reckoning PDR sensor
Evolution of a shoe-mounted multi-IMU pedestrian dead reckoning PDR sensoroblu.io
 
EWSHM2020PRE-PRINTDamageDetectiononanOperatingWindTurbineBladeviaaSingleVibra...
EWSHM2020PRE-PRINTDamageDetectiononanOperatingWindTurbineBladeviaaSingleVibra...EWSHM2020PRE-PRINTDamageDetectiononanOperatingWindTurbineBladeviaaSingleVibra...
EWSHM2020PRE-PRINTDamageDetectiononanOperatingWindTurbineBladeviaaSingleVibra...Tomas Nuñez
 
Torque estimator using MPPT method for wind turbines
Torque estimator using MPPT method for wind turbines Torque estimator using MPPT method for wind turbines
Torque estimator using MPPT method for wind turbines IJECEIAES
 
Attitude Control of Quadrotor Using PD Plus Feedforward Controller on SO(3)
Attitude Control of Quadrotor Using PD Plus Feedforward Controller on SO(3)Attitude Control of Quadrotor Using PD Plus Feedforward Controller on SO(3)
Attitude Control of Quadrotor Using PD Plus Feedforward Controller on SO(3)IJECEIAES
 
MSc_Thesis_ORR
MSc_Thesis_ORRMSc_Thesis_ORR
MSc_Thesis_ORROscar Ram
 
An Unmanned Rotorcraft System with Embedded Design
An Unmanned Rotorcraft System with Embedded DesignAn Unmanned Rotorcraft System with Embedded Design
An Unmanned Rotorcraft System with Embedded DesignIOSR Journals
 
Foot Mounted Pedestrian Navigation Systems
Foot Mounted Pedestrian Navigation SystemsFoot Mounted Pedestrian Navigation Systems
Foot Mounted Pedestrian Navigation Systemsoblu.io
 
SLAM of Multi-Robot System Considering Its Network Topology
SLAM of Multi-Robot System Considering Its Network TopologySLAM of Multi-Robot System Considering Its Network Topology
SLAM of Multi-Robot System Considering Its Network Topologytoukaigi
 
IOMAC_paper_proofed.pdf
IOMAC_paper_proofed.pdfIOMAC_paper_proofed.pdf
IOMAC_paper_proofed.pdfTomas Nuñez
 
Inertial Navigation System
Inertial Navigation SystemInertial Navigation System
Inertial Navigation Systemaerobuddy
 
Ballingham_Levine_FinalProject
Ballingham_Levine_FinalProjectBallingham_Levine_FinalProject
Ballingham_Levine_FinalProjectRyland Ballingham
 

Was ist angesagt? (19)

Inertial Sensor Array Calibration Made Easy !
Inertial Sensor Array Calibration Made Easy !Inertial Sensor Array Calibration Made Easy !
Inertial Sensor Array Calibration Made Easy !
 
Overview of State Estimation Technique for Power System Control
Overview of State Estimation Technique for Power System ControlOverview of State Estimation Technique for Power System Control
Overview of State Estimation Technique for Power System Control
 
State Estimation of Power System with Interline Power Flow Controller
State Estimation of Power System with Interline Power Flow ControllerState Estimation of Power System with Interline Power Flow Controller
State Estimation of Power System with Interline Power Flow Controller
 
Neural Network Approach to Railway Stand Lateral SKEW Control
Neural Network Approach to Railway Stand Lateral SKEW ControlNeural Network Approach to Railway Stand Lateral SKEW Control
Neural Network Approach to Railway Stand Lateral SKEW Control
 
ADAPTIVE TREADMILL CONTROL BY HUMAN WILL
ADAPTIVE TREADMILL CONTROL BY HUMAN WILLADAPTIVE TREADMILL CONTROL BY HUMAN WILL
ADAPTIVE TREADMILL CONTROL BY HUMAN WILL
 
A1102030105
A1102030105A1102030105
A1102030105
 
MODELLING ANALYSIS & DESIGN OF DSP BASED NOVEL SPEED SENSORLESS VECTOR CONTRO...
MODELLING ANALYSIS & DESIGN OF DSP BASED NOVEL SPEED SENSORLESS VECTOR CONTRO...MODELLING ANALYSIS & DESIGN OF DSP BASED NOVEL SPEED SENSORLESS VECTOR CONTRO...
MODELLING ANALYSIS & DESIGN OF DSP BASED NOVEL SPEED SENSORLESS VECTOR CONTRO...
 
Evolution of a shoe-mounted multi-IMU pedestrian dead reckoning PDR sensor
Evolution of a shoe-mounted multi-IMU pedestrian dead reckoning PDR sensorEvolution of a shoe-mounted multi-IMU pedestrian dead reckoning PDR sensor
Evolution of a shoe-mounted multi-IMU pedestrian dead reckoning PDR sensor
 
EWSHM2020PRE-PRINTDamageDetectiononanOperatingWindTurbineBladeviaaSingleVibra...
EWSHM2020PRE-PRINTDamageDetectiononanOperatingWindTurbineBladeviaaSingleVibra...EWSHM2020PRE-PRINTDamageDetectiononanOperatingWindTurbineBladeviaaSingleVibra...
EWSHM2020PRE-PRINTDamageDetectiononanOperatingWindTurbineBladeviaaSingleVibra...
 
Torque estimator using MPPT method for wind turbines
Torque estimator using MPPT method for wind turbines Torque estimator using MPPT method for wind turbines
Torque estimator using MPPT method for wind turbines
 
Attitude Control of Quadrotor Using PD Plus Feedforward Controller on SO(3)
Attitude Control of Quadrotor Using PD Plus Feedforward Controller on SO(3)Attitude Control of Quadrotor Using PD Plus Feedforward Controller on SO(3)
Attitude Control of Quadrotor Using PD Plus Feedforward Controller on SO(3)
 
MSc_Thesis_ORR
MSc_Thesis_ORRMSc_Thesis_ORR
MSc_Thesis_ORR
 
An Unmanned Rotorcraft System with Embedded Design
An Unmanned Rotorcraft System with Embedded DesignAn Unmanned Rotorcraft System with Embedded Design
An Unmanned Rotorcraft System with Embedded Design
 
Foot Mounted Pedestrian Navigation Systems
Foot Mounted Pedestrian Navigation SystemsFoot Mounted Pedestrian Navigation Systems
Foot Mounted Pedestrian Navigation Systems
 
SLAM of Multi-Robot System Considering Its Network Topology
SLAM of Multi-Robot System Considering Its Network TopologySLAM of Multi-Robot System Considering Its Network Topology
SLAM of Multi-Robot System Considering Its Network Topology
 
IOMAC_paper_proofed.pdf
IOMAC_paper_proofed.pdfIOMAC_paper_proofed.pdf
IOMAC_paper_proofed.pdf
 
Inertial Navigation System
Inertial Navigation SystemInertial Navigation System
Inertial Navigation System
 
Monitoring Open Pit
Monitoring Open PitMonitoring Open Pit
Monitoring Open Pit
 
Ballingham_Levine_FinalProject
Ballingham_Levine_FinalProjectBallingham_Levine_FinalProject
Ballingham_Levine_FinalProject
 

Andere mochten auch

Marketing Xa Arq
Marketing Xa ArqMarketing Xa Arq
Marketing Xa Arqticupt2008
 
Iluminación.
Iluminación.Iluminación.
Iluminación.Ciro1405
 
Inventtaradarcapitalderiscoguiapraticoparaempresasnascentes 111107080523-phpa...
Inventtaradarcapitalderiscoguiapraticoparaempresasnascentes 111107080523-phpa...Inventtaradarcapitalderiscoguiapraticoparaempresasnascentes 111107080523-phpa...
Inventtaradarcapitalderiscoguiapraticoparaempresasnascentes 111107080523-phpa...Manuel Fernandes
 
Reunion servicios v_correcion_ccs_(2)
Reunion servicios v_correcion_ccs_(2)Reunion servicios v_correcion_ccs_(2)
Reunion servicios v_correcion_ccs_(2)aprofex
 
Revista Espirito Livre 011 Fevereiro10
Revista Espirito Livre 011 Fevereiro10Revista Espirito Livre 011 Fevereiro10
Revista Espirito Livre 011 Fevereiro10Anderson Ramos
 
Principios da excelencia_pessoal_fran_christy
Principios da excelencia_pessoal_fran_christyPrincipios da excelencia_pessoal_fran_christy
Principios da excelencia_pessoal_fran_christyAnderson Lima da Silva
 
ESTRATEGIA DE LAS ADQUISICIONES Y DE LA REESTRUCTURACIÓN
ESTRATEGIA DE LAS ADQUISICIONES Y DE  LA REESTRUCTURACIÓNESTRATEGIA DE LAS ADQUISICIONES Y DE  LA REESTRUCTURACIÓN
ESTRATEGIA DE LAS ADQUISICIONES Y DE LA REESTRUCTURACIÓNPUCE SD
 
Como abrir uma loja virtual sem gastar quase nada
Como abrir uma loja virtual sem gastar quase nadaComo abrir uma loja virtual sem gastar quase nada
Como abrir uma loja virtual sem gastar quase nadaJoseph Romacoj
 
Banca multiple
Banca multipleBanca multiple
Banca multipleJHAN MARCO
 
Cómo es mi día activo
Cómo es mi día activoCómo es mi día activo
Cómo es mi día activoerquimicoloco
 

Andere mochten auch (20)

Inventarios
InventariosInventarios
Inventarios
 
Inventarios
InventariosInventarios
Inventarios
 
Marketing Xa Arq
Marketing Xa ArqMarketing Xa Arq
Marketing Xa Arq
 
Iluminación.
Iluminación.Iluminación.
Iluminación.
 
Inventtaradarcapitalderiscoguiapraticoparaempresasnascentes 111107080523-phpa...
Inventtaradarcapitalderiscoguiapraticoparaempresasnascentes 111107080523-phpa...Inventtaradarcapitalderiscoguiapraticoparaempresasnascentes 111107080523-phpa...
Inventtaradarcapitalderiscoguiapraticoparaempresasnascentes 111107080523-phpa...
 
Reunion servicios v_correcion_ccs_(2)
Reunion servicios v_correcion_ccs_(2)Reunion servicios v_correcion_ccs_(2)
Reunion servicios v_correcion_ccs_(2)
 
Uma janela do.... Mundo
Uma janela do.... MundoUma janela do.... Mundo
Uma janela do.... Mundo
 
Cyb ecu delitos_inform
Cyb ecu delitos_informCyb ecu delitos_inform
Cyb ecu delitos_inform
 
Mexico volcanes
Mexico   volcanesMexico   volcanes
Mexico volcanes
 
Cálculo de riscos aplicado a atividades industriais
Cálculo de riscos aplicado a atividades industriaisCálculo de riscos aplicado a atividades industriais
Cálculo de riscos aplicado a atividades industriais
 
Revista Espirito Livre 011 Fevereiro10
Revista Espirito Livre 011 Fevereiro10Revista Espirito Livre 011 Fevereiro10
Revista Espirito Livre 011 Fevereiro10
 
Aula 03 matemática financeira
Aula 03 matemática financeiraAula 03 matemática financeira
Aula 03 matemática financeira
 
Principios da excelencia_pessoal_fran_christy
Principios da excelencia_pessoal_fran_christyPrincipios da excelencia_pessoal_fran_christy
Principios da excelencia_pessoal_fran_christy
 
ESTRATEGIA DE LAS ADQUISICIONES Y DE LA REESTRUCTURACIÓN
ESTRATEGIA DE LAS ADQUISICIONES Y DE  LA REESTRUCTURACIÓNESTRATEGIA DE LAS ADQUISICIONES Y DE  LA REESTRUCTURACIÓN
ESTRATEGIA DE LAS ADQUISICIONES Y DE LA REESTRUCTURACIÓN
 
Como abrir uma loja virtual sem gastar quase nada
Como abrir uma loja virtual sem gastar quase nadaComo abrir uma loja virtual sem gastar quase nada
Como abrir uma loja virtual sem gastar quase nada
 
Regimento Escolar NPS
Regimento Escolar   NPSRegimento Escolar   NPS
Regimento Escolar NPS
 
Hackers
HackersHackers
Hackers
 
Banca multiple
Banca multipleBanca multiple
Banca multiple
 
Trabajo
TrabajoTrabajo
Trabajo
 
Cómo es mi día activo
Cómo es mi día activoCómo es mi día activo
Cómo es mi día activo
 

Ähnlich wie Monitoring Road Traffic Crashes Using EWMA Control Charts

Isen 614 project report
Isen 614 project reportIsen 614 project report
Isen 614 project reportVanshaj Handoo
 
Detecting Assignable Signals Via Decomposition Of Newma Statistic
Detecting Assignable Signals Via Decomposition Of Newma StatisticDetecting Assignable Signals Via Decomposition Of Newma Statistic
Detecting Assignable Signals Via Decomposition Of Newma Statisticjournal ijrtem
 
Detecting Assignable Signals via Decomposition of MEWMA Statistic
Detecting Assignable Signals via Decomposition of MEWMA StatisticDetecting Assignable Signals via Decomposition of MEWMA Statistic
Detecting Assignable Signals via Decomposition of MEWMA Statisticinventionjournals
 
The Effect of Sample Size On (Cusum and ARIMA) Control Charts
The Effect of Sample Size On (Cusum and ARIMA) Control ChartsThe Effect of Sample Size On (Cusum and ARIMA) Control Charts
The Effect of Sample Size On (Cusum and ARIMA) Control ChartsINFOGAIN PUBLICATION
 
MFBLP Method Forecast for Regional Load Demand System
MFBLP Method Forecast for Regional Load Demand SystemMFBLP Method Forecast for Regional Load Demand System
MFBLP Method Forecast for Regional Load Demand SystemCSCJournals
 
A Survey On Real Time State Estimation For Optimal Placement Of Phasor Measur...
A Survey On Real Time State Estimation For Optimal Placement Of Phasor Measur...A Survey On Real Time State Estimation For Optimal Placement Of Phasor Measur...
A Survey On Real Time State Estimation For Optimal Placement Of Phasor Measur...IJSRD
 
Reliability analysis of pmu using hidden markov model
Reliability analysis of pmu using hidden markov modelReliability analysis of pmu using hidden markov model
Reliability analysis of pmu using hidden markov modelamaresh1234
 
Performance Of A Combined Shewhart-Cusum Control Chart With Binomial Data For...
Performance Of A Combined Shewhart-Cusum Control Chart With Binomial Data For...Performance Of A Combined Shewhart-Cusum Control Chart With Binomial Data For...
Performance Of A Combined Shewhart-Cusum Control Chart With Binomial Data For...IJERA Editor
 
Power system static state estimation using Kalman filter algorithm
Power system static state estimation using Kalman filter algorithmPower system static state estimation using Kalman filter algorithm
Power system static state estimation using Kalman filter algorithmPower System Operation
 
Multiple Constraints Consideration in Power System State Estimation
Multiple Constraints Consideration in Power System State EstimationMultiple Constraints Consideration in Power System State Estimation
Multiple Constraints Consideration in Power System State EstimationIOSR Journals
 
Assimilation of spa and pmt for random shocks in manufacturing process 2
Assimilation of spa and pmt for random shocks in manufacturing process 2Assimilation of spa and pmt for random shocks in manufacturing process 2
Assimilation of spa and pmt for random shocks in manufacturing process 2IAEME Publication
 
Joint State and Parameter Estimation by Extended Kalman Filter (EKF) technique
Joint State and Parameter Estimation by Extended Kalman Filter (EKF) techniqueJoint State and Parameter Estimation by Extended Kalman Filter (EKF) technique
Joint State and Parameter Estimation by Extended Kalman Filter (EKF) techniqueIJERD Editor
 
“Neural Networks with Self-Organizing Maps applied to Process Control”
“Neural Networks with Self-Organizing Maps applied to Process Control”“Neural Networks with Self-Organizing Maps applied to Process Control”
“Neural Networks with Self-Organizing Maps applied to Process Control”UNIV OF PERU
 
CAD -- CUSUM Anomaly Detection
CAD -- CUSUM Anomaly DetectionCAD -- CUSUM Anomaly Detection
CAD -- CUSUM Anomaly DetectionFarkas Kinga
 
International Journal of Engineering Research and Development
International Journal of Engineering Research and DevelopmentInternational Journal of Engineering Research and Development
International Journal of Engineering Research and DevelopmentIJERD Editor
 

Ähnlich wie Monitoring Road Traffic Crashes Using EWMA Control Charts (20)

Isen 614 project report
Isen 614 project reportIsen 614 project report
Isen 614 project report
 
Detecting Assignable Signals Via Decomposition Of Newma Statistic
Detecting Assignable Signals Via Decomposition Of Newma StatisticDetecting Assignable Signals Via Decomposition Of Newma Statistic
Detecting Assignable Signals Via Decomposition Of Newma Statistic
 
Detecting Assignable Signals via Decomposition of MEWMA Statistic
Detecting Assignable Signals via Decomposition of MEWMA StatisticDetecting Assignable Signals via Decomposition of MEWMA Statistic
Detecting Assignable Signals via Decomposition of MEWMA Statistic
 
The Effect of Sample Size On (Cusum and ARIMA) Control Charts
The Effect of Sample Size On (Cusum and ARIMA) Control ChartsThe Effect of Sample Size On (Cusum and ARIMA) Control Charts
The Effect of Sample Size On (Cusum and ARIMA) Control Charts
 
MFBLP Method Forecast for Regional Load Demand System
MFBLP Method Forecast for Regional Load Demand SystemMFBLP Method Forecast for Regional Load Demand System
MFBLP Method Forecast for Regional Load Demand System
 
A Survey On Real Time State Estimation For Optimal Placement Of Phasor Measur...
A Survey On Real Time State Estimation For Optimal Placement Of Phasor Measur...A Survey On Real Time State Estimation For Optimal Placement Of Phasor Measur...
A Survey On Real Time State Estimation For Optimal Placement Of Phasor Measur...
 
Reliability analysis of pmu using hidden markov model
Reliability analysis of pmu using hidden markov modelReliability analysis of pmu using hidden markov model
Reliability analysis of pmu using hidden markov model
 
Performance Of A Combined Shewhart-Cusum Control Chart With Binomial Data For...
Performance Of A Combined Shewhart-Cusum Control Chart With Binomial Data For...Performance Of A Combined Shewhart-Cusum Control Chart With Binomial Data For...
Performance Of A Combined Shewhart-Cusum Control Chart With Binomial Data For...
 
I02095257
I02095257I02095257
I02095257
 
Power system static state estimation using Kalman filter algorithm
Power system static state estimation using Kalman filter algorithmPower system static state estimation using Kalman filter algorithm
Power system static state estimation using Kalman filter algorithm
 
B025010019
B025010019B025010019
B025010019
 
Multiple Constraints Consideration in Power System State Estimation
Multiple Constraints Consideration in Power System State EstimationMultiple Constraints Consideration in Power System State Estimation
Multiple Constraints Consideration in Power System State Estimation
 
Assimilation of spa and pmt for random shocks in manufacturing process 2
Assimilation of spa and pmt for random shocks in manufacturing process 2Assimilation of spa and pmt for random shocks in manufacturing process 2
Assimilation of spa and pmt for random shocks in manufacturing process 2
 
Joint State and Parameter Estimation by Extended Kalman Filter (EKF) technique
Joint State and Parameter Estimation by Extended Kalman Filter (EKF) techniqueJoint State and Parameter Estimation by Extended Kalman Filter (EKF) technique
Joint State and Parameter Estimation by Extended Kalman Filter (EKF) technique
 
2016ESWA
2016ESWA2016ESWA
2016ESWA
 
2016ESWA
2016ESWA2016ESWA
2016ESWA
 
2016ESWA
2016ESWA2016ESWA
2016ESWA
 
“Neural Networks with Self-Organizing Maps applied to Process Control”
“Neural Networks with Self-Organizing Maps applied to Process Control”“Neural Networks with Self-Organizing Maps applied to Process Control”
“Neural Networks with Self-Organizing Maps applied to Process Control”
 
CAD -- CUSUM Anomaly Detection
CAD -- CUSUM Anomaly DetectionCAD -- CUSUM Anomaly Detection
CAD -- CUSUM Anomaly Detection
 
International Journal of Engineering Research and Development
International Journal of Engineering Research and DevelopmentInternational Journal of Engineering Research and Development
International Journal of Engineering Research and Development
 

Kürzlich hochgeladen

🐬 The future of MySQL is Postgres 🐘
🐬  The future of MySQL is Postgres   🐘🐬  The future of MySQL is Postgres   🐘
🐬 The future of MySQL is Postgres 🐘RTylerCroy
 
Scaling API-first – The story of a global engineering organization
Scaling API-first – The story of a global engineering organizationScaling API-first – The story of a global engineering organization
Scaling API-first – The story of a global engineering organizationRadu Cotescu
 
Histor y of HAM Radio presentation slide
Histor y of HAM Radio presentation slideHistor y of HAM Radio presentation slide
Histor y of HAM Radio presentation slidevu2urc
 
Partners Life - Insurer Innovation Award 2024
Partners Life - Insurer Innovation Award 2024Partners Life - Insurer Innovation Award 2024
Partners Life - Insurer Innovation Award 2024The Digital Insurer
 
Factors to Consider When Choosing Accounts Payable Services Providers.pptx
Factors to Consider When Choosing Accounts Payable Services Providers.pptxFactors to Consider When Choosing Accounts Payable Services Providers.pptx
Factors to Consider When Choosing Accounts Payable Services Providers.pptxKatpro Technologies
 
08448380779 Call Girls In Diplomatic Enclave Women Seeking Men
08448380779 Call Girls In Diplomatic Enclave Women Seeking Men08448380779 Call Girls In Diplomatic Enclave Women Seeking Men
08448380779 Call Girls In Diplomatic Enclave Women Seeking MenDelhi Call girls
 
08448380779 Call Girls In Greater Kailash - I Women Seeking Men
08448380779 Call Girls In Greater Kailash - I Women Seeking Men08448380779 Call Girls In Greater Kailash - I Women Seeking Men
08448380779 Call Girls In Greater Kailash - I Women Seeking MenDelhi Call girls
 
Driving Behavioral Change for Information Management through Data-Driven Gree...
Driving Behavioral Change for Information Management through Data-Driven Gree...Driving Behavioral Change for Information Management through Data-Driven Gree...
Driving Behavioral Change for Information Management through Data-Driven Gree...Enterprise Knowledge
 
GenCyber Cyber Security Day Presentation
GenCyber Cyber Security Day PresentationGenCyber Cyber Security Day Presentation
GenCyber Cyber Security Day PresentationMichael W. Hawkins
 
How to Troubleshoot Apps for the Modern Connected Worker
How to Troubleshoot Apps for the Modern Connected WorkerHow to Troubleshoot Apps for the Modern Connected Worker
How to Troubleshoot Apps for the Modern Connected WorkerThousandEyes
 
Neo4j - How KGs are shaping the future of Generative AI at AWS Summit London ...
Neo4j - How KGs are shaping the future of Generative AI at AWS Summit London ...Neo4j - How KGs are shaping the future of Generative AI at AWS Summit London ...
Neo4j - How KGs are shaping the future of Generative AI at AWS Summit London ...Neo4j
 
Raspberry Pi 5: Challenges and Solutions in Bringing up an OpenGL/Vulkan Driv...
Raspberry Pi 5: Challenges and Solutions in Bringing up an OpenGL/Vulkan Driv...Raspberry Pi 5: Challenges and Solutions in Bringing up an OpenGL/Vulkan Driv...
Raspberry Pi 5: Challenges and Solutions in Bringing up an OpenGL/Vulkan Driv...Igalia
 
Mastering MySQL Database Architecture: Deep Dive into MySQL Shell and MySQL R...
Mastering MySQL Database Architecture: Deep Dive into MySQL Shell and MySQL R...Mastering MySQL Database Architecture: Deep Dive into MySQL Shell and MySQL R...
Mastering MySQL Database Architecture: Deep Dive into MySQL Shell and MySQL R...Miguel Araújo
 
Axa Assurance Maroc - Insurer Innovation Award 2024
Axa Assurance Maroc - Insurer Innovation Award 2024Axa Assurance Maroc - Insurer Innovation Award 2024
Axa Assurance Maroc - Insurer Innovation Award 2024The Digital Insurer
 
From Event to Action: Accelerate Your Decision Making with Real-Time Automation
From Event to Action: Accelerate Your Decision Making with Real-Time AutomationFrom Event to Action: Accelerate Your Decision Making with Real-Time Automation
From Event to Action: Accelerate Your Decision Making with Real-Time AutomationSafe Software
 
Boost PC performance: How more available memory can improve productivity
Boost PC performance: How more available memory can improve productivityBoost PC performance: How more available memory can improve productivity
Boost PC performance: How more available memory can improve productivityPrincipled Technologies
 
Slack Application Development 101 Slides
Slack Application Development 101 SlidesSlack Application Development 101 Slides
Slack Application Development 101 Slidespraypatel2
 
Unblocking The Main Thread Solving ANRs and Frozen Frames
Unblocking The Main Thread Solving ANRs and Frozen FramesUnblocking The Main Thread Solving ANRs and Frozen Frames
Unblocking The Main Thread Solving ANRs and Frozen FramesSinan KOZAK
 
EIS-Webinar-Prompt-Knowledge-Eng-2024-04-08.pptx
EIS-Webinar-Prompt-Knowledge-Eng-2024-04-08.pptxEIS-Webinar-Prompt-Knowledge-Eng-2024-04-08.pptx
EIS-Webinar-Prompt-Knowledge-Eng-2024-04-08.pptxEarley Information Science
 
How to convert PDF to text with Nanonets
How to convert PDF to text with NanonetsHow to convert PDF to text with Nanonets
How to convert PDF to text with Nanonetsnaman860154
 

Kürzlich hochgeladen (20)

🐬 The future of MySQL is Postgres 🐘
🐬  The future of MySQL is Postgres   🐘🐬  The future of MySQL is Postgres   🐘
🐬 The future of MySQL is Postgres 🐘
 
Scaling API-first – The story of a global engineering organization
Scaling API-first – The story of a global engineering organizationScaling API-first – The story of a global engineering organization
Scaling API-first – The story of a global engineering organization
 
Histor y of HAM Radio presentation slide
Histor y of HAM Radio presentation slideHistor y of HAM Radio presentation slide
Histor y of HAM Radio presentation slide
 
Partners Life - Insurer Innovation Award 2024
Partners Life - Insurer Innovation Award 2024Partners Life - Insurer Innovation Award 2024
Partners Life - Insurer Innovation Award 2024
 
Factors to Consider When Choosing Accounts Payable Services Providers.pptx
Factors to Consider When Choosing Accounts Payable Services Providers.pptxFactors to Consider When Choosing Accounts Payable Services Providers.pptx
Factors to Consider When Choosing Accounts Payable Services Providers.pptx
 
08448380779 Call Girls In Diplomatic Enclave Women Seeking Men
08448380779 Call Girls In Diplomatic Enclave Women Seeking Men08448380779 Call Girls In Diplomatic Enclave Women Seeking Men
08448380779 Call Girls In Diplomatic Enclave Women Seeking Men
 
08448380779 Call Girls In Greater Kailash - I Women Seeking Men
08448380779 Call Girls In Greater Kailash - I Women Seeking Men08448380779 Call Girls In Greater Kailash - I Women Seeking Men
08448380779 Call Girls In Greater Kailash - I Women Seeking Men
 
Driving Behavioral Change for Information Management through Data-Driven Gree...
Driving Behavioral Change for Information Management through Data-Driven Gree...Driving Behavioral Change for Information Management through Data-Driven Gree...
Driving Behavioral Change for Information Management through Data-Driven Gree...
 
GenCyber Cyber Security Day Presentation
GenCyber Cyber Security Day PresentationGenCyber Cyber Security Day Presentation
GenCyber Cyber Security Day Presentation
 
How to Troubleshoot Apps for the Modern Connected Worker
How to Troubleshoot Apps for the Modern Connected WorkerHow to Troubleshoot Apps for the Modern Connected Worker
How to Troubleshoot Apps for the Modern Connected Worker
 
Neo4j - How KGs are shaping the future of Generative AI at AWS Summit London ...
Neo4j - How KGs are shaping the future of Generative AI at AWS Summit London ...Neo4j - How KGs are shaping the future of Generative AI at AWS Summit London ...
Neo4j - How KGs are shaping the future of Generative AI at AWS Summit London ...
 
Raspberry Pi 5: Challenges and Solutions in Bringing up an OpenGL/Vulkan Driv...
Raspberry Pi 5: Challenges and Solutions in Bringing up an OpenGL/Vulkan Driv...Raspberry Pi 5: Challenges and Solutions in Bringing up an OpenGL/Vulkan Driv...
Raspberry Pi 5: Challenges and Solutions in Bringing up an OpenGL/Vulkan Driv...
 
Mastering MySQL Database Architecture: Deep Dive into MySQL Shell and MySQL R...
Mastering MySQL Database Architecture: Deep Dive into MySQL Shell and MySQL R...Mastering MySQL Database Architecture: Deep Dive into MySQL Shell and MySQL R...
Mastering MySQL Database Architecture: Deep Dive into MySQL Shell and MySQL R...
 
Axa Assurance Maroc - Insurer Innovation Award 2024
Axa Assurance Maroc - Insurer Innovation Award 2024Axa Assurance Maroc - Insurer Innovation Award 2024
Axa Assurance Maroc - Insurer Innovation Award 2024
 
From Event to Action: Accelerate Your Decision Making with Real-Time Automation
From Event to Action: Accelerate Your Decision Making with Real-Time AutomationFrom Event to Action: Accelerate Your Decision Making with Real-Time Automation
From Event to Action: Accelerate Your Decision Making with Real-Time Automation
 
Boost PC performance: How more available memory can improve productivity
Boost PC performance: How more available memory can improve productivityBoost PC performance: How more available memory can improve productivity
Boost PC performance: How more available memory can improve productivity
 
Slack Application Development 101 Slides
Slack Application Development 101 SlidesSlack Application Development 101 Slides
Slack Application Development 101 Slides
 
Unblocking The Main Thread Solving ANRs and Frozen Frames
Unblocking The Main Thread Solving ANRs and Frozen FramesUnblocking The Main Thread Solving ANRs and Frozen Frames
Unblocking The Main Thread Solving ANRs and Frozen Frames
 
EIS-Webinar-Prompt-Knowledge-Eng-2024-04-08.pptx
EIS-Webinar-Prompt-Knowledge-Eng-2024-04-08.pptxEIS-Webinar-Prompt-Knowledge-Eng-2024-04-08.pptx
EIS-Webinar-Prompt-Knowledge-Eng-2024-04-08.pptx
 
How to convert PDF to text with Nanonets
How to convert PDF to text with NanonetsHow to convert PDF to text with Nanonets
How to convert PDF to text with Nanonets
 

Monitoring Road Traffic Crashes Using EWMA Control Charts

  • 1. International Journal of Mathematics and Statistics Invention (IJMSI) E-ISSN: 2321 – 4767 P-ISSN: 2321 - 4759 www.ijmsi.org Volume 2 Issue 5 || May. 2014 || PP-01-09 www.ijmsi.org 1 | P a g e On The Use Of Exponentially Weighted Moving Average (Ewma) Contrl Chart In Monitoring Road Traffic Crashes. 1 O.J. Braimah, 2 P.A. Osanaiye.3 P.E. Omaku 4 Y.K. Saheed 5 S.A. Eshimokhai 1 Department of Statistics, Abdur-Raheem college of Advanced Studies Igbaja, Ilorin, Kwara State, Nigeria. 2 Department of Statistics, University of Ilorin, P.M.B 1515 Ilorin, Ilorin, Kwara State, Nigeria. 3 Department of Mathematics and Statics, Federal Polytechnic Nasarawa, Nasarawa State, Nigeria. 4 Department of Computer Science, Abdur-Raheem college of Advanced Studies Igbaja, Ilorin, Kwara State, Nigeria. 5 Department of Safety and Environmental Management, Edinburgh Napier University, Scotland. ABSTRACT: This study is aimed at designing Exponentially Weighted Moving average (EWMA) control chart in monitoring road crashes. The data used in this study is a secondary data from the accident record office of the Federal Road Safety Commission (FRSC), Zone RS8 Command Headquarter, Offa Road, GRA, Ilorin, Kwara State, Nigeria for the period of January, 2000 to December, 2010. Cumulative Exponentially Weighted Moving Average (EWMA) control char scheme was designed and used to study the rate of road crashes. Finally, the performance of the control chart schemes was compared by varying the weighted parameter (w=0.15, 0.20 and 0.30). It was observed that EWMA control chart scheme is sensitive in detecting small shift in the process but more sensitive in detecting shift in the process mean with higher weighted parameter (W). Therefore, the higher the weighted parameter, the faster it detects an out of control signal. Thus providing validation of the methodology employed to set up Minitab using Neubauer table in determining the weighted parameter, limit q of the EWMA chart and the nominal ARL. I. INTRODUCTION The mandate of Federal Road Safety Commission (FRSC) which is reducing road accidents on our roads can be viewed as rendering services to the citizens of Nigeria and the more the road accidents are curtailed, the better the costumers (citizens) are satisfied. Shewhart chart has been widely used in determining shift in a process, however the main disadvantage of any of Shewhart charts is that they use only the last information of the combined process and ignore any other process given by the sequence of all points. This characteristic makes Shewhart control charts relatively insensitive to a small change in a process, because the cumulative or weight of the previous observation are disregarded. Small changes could be detected through CUSUM, EWMA and Moving Average control charts. These charts could be used as a complementary tool for X-bar, through which, small and large changes could be detected. Some authors, such as Dugans (1974), Lucas (1976), stated that the cumulative sum control chart is much more efficient than the usual control chart for detecting small variations in the average. Other authors including Crowders (1987) presented the exponentially weighted moving average control chart, as good choice to detect small change in process average. Various modification and supplemental criteria have also suggested that control charts based on moving average is also an effective chart in detecting small process change.In this study, road crashes from the Accidents Record Office of Federal Road Safety Commission (FRSC) which comprises of Kwara, Kogi and Ekiti state is studied using cumulative-sum (CUSUM), exponentially weighted moving average (EWMA) and moving average control charts. II. MATERIALS AND METHODS THE EXPONENTIAL WEIGHTED MOVING AVERAGE (EWMA) The Exponential Weighted Moving Average (EWMA) chart is used for monitoring process by averaging the data in a way that give less weight to old data as samples are taken and give a high weight to most recent data. It is also effective in detecting small shifts.The EWMA chart methodology was developed by Roberts (1959) who purposed it for use by some organizations, particularly in the process industries, financial and management control as the basis of new control/performance charts system. The EWMA charting procedure is sometime used to monitor the rate of occurrence of rare events where the time between two successive occurrences is exponentially distributed. This procedure can also be used extensively in time series modeling and forecasting. The EWMA for individual value may be defined as:
  • 2. On The Use Of Exponentially Weighted… www.ijmsi.org 2 | P a g e where …………………………1 The above equation is due to Roberts (1959). The use of this control chart was first published in the article “Control chart tests based on geometric moving averages” (Roberts, 1959). While Shewhart charts only consider the most recent data point in testing to determine if statistical limits have been exceeded, EWMA charts consider all previous points using a weighing factor that makes the outcome more influenced by recent points. In statistical quality control, the EWMA chart (or exponentially-weighted moving average chart) is a type of control chart used to monitor either variables or attributes-type data. While other control charts treat rational subgroups of samples individually, the EWMA chart tracks the exponentially-weighted moving average of all prior samples. EWMA weights samples in geometrically decreasing order so that the most recent samples are weighted most highly while the most distant samples contribute very little. Although EWMA chart assumes normal distribution, it is relatively robust in the face of non-normality. The chart monitors only the process mean. EWMA Charts are generally used for detecting small shifts in the process mean and they detect shifts of 0.5sigma to 2sigma much faster than Shewhart charts with the same sample size. In brief, after multiplication by a weighting factor w, the current measurement is added to the sum of all former measurements, which is weighted with (1 - w). Thus, at each time t (t = 1, 2,... ), the test statistic . Basically, the method is to form a new moving average at each sample point by calculating a weighted average of new value and previous moving-average. Therefore, in exponentially weighted moving average chart, all of the past data has some effect on the current value, but it rapidly loses influence. Consider the following notations: = Exponentially Weighted Moving Average = EWMA weighted parameter ( ) µ0 = Process mean = jth measure of ith subgroup, with = Process standard deviation = Sample size of ith group q=sigma limit = Mean of measurement in ith subgroup. If , then subgroup mean reduce to the observation in the group Each point on the chart indicates the value of exponentially weighted moving average (EWMA) for the subgroup. The EWMA for the ith subgroup is defined recursively as: , where w is the weighted parameter ( ). III. COMPUTATION OF CONTROL LIMIT By default, the central line on an EWMA chart indicates an estimate for µ, which is computed as: ……………………………………………………………………………2 The default limits are computed as (referred to as 2.30 limits). The upper and lower control limits are ……………………………………………………………………………3 …………..……………………………………………………………….4 where „n‟ is the subgroup size (1). CHOOSING THE VALUE OF WEIGHTED PARAMETER (w) The following shows how we might set up an EWMA chart by the five-step procedure:  Select an in-control Run Length (RL) of 45. This is also the average run length (ARL) of the Westgard algorithm.  Define the optimum shift to be detected as 1.0 as used in this paper.  Using this shift sizes and the above ARL, gives a weighting factor w of 0.15 (Fig. 2).  With these selected values derived from Fig. 2, EWMA chart limit q of 2.30 is selected (Fig. 3). For one control sample per month (n = 1), upper control limit (UCL) and lower control limit (LCL) are calculated as equation 3 and 4 above.
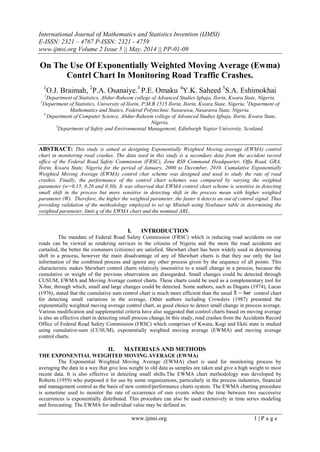
  • 3. On The Use Of Exponentially Weighted… www.ijmsi.org 3 | P a g e  Enter the weight parameter (w), historical mean, sigma (standard deviation) and the sigma limit (S limit) to the MINITAB 14 EWMA chart dialog box as displayed in Fig. 1 below. EWMA CHART DIALOG BOX Figure 1 In order to accurately compare EWMA control chart techniques, the same ARL value must be used for the design. A graphical method for determining the ARL for an EWMA control chart is seen in Fig. 2 and 3 below, Neubauer (1997). One can obtain the weighting factor “w” as a function of the desired shift sensitivity of the chart. For a shift of 1.0standard deviation,for example, a weighting factor of 0.15 can be obtained from the chart as shown in figure 2 and we set ARL at 45, using Fig. 3, the sigma limit (q) was obtained to be 2.30. Fig.2: Optimal w for EWMA charts according to the shift d from Neubauer (1997)
  • 4. On The Use Of Exponentially Weighted… www.ijmsi.org 4 | P a g e FIG. 3: Determining the limit q of the EWMA chart after selection of w and the nominal ARL from Neubauer 1997. ASSESSMENT OF PERFORMANCE OF EWMA CHART A number of authors have studied the design of EWMA control scheme based on Average Run Length (ARL) computation. Ideally, the ARL should be short when a shift occurs and should be long when there is no shift. The effect of “w” (weight parameter) on the ARL was described by Robert (1959), who used simulation method. The ARL function was approximated by Robinson and Ho (1978). IV. DATA ANALYSIS The analysis of the data (number of road crashes) obtained from the Federal Road Safety Commission (FRSC) were considered using EWMA control chart scheme The overall mean per month is approximately , the standard deviation from the historical data is and the subgroup size (n) is 1. EWMA CHART METHOD The EWMA statistic was calculated using three different values of w (weighted parameters), 0.15, 0.20 and 0.30 so as to come out with the most appropriate one. The following shows how we set up an EWMA-chart by the three-step procedure:  Select an in-control Run Length (RL) of 45. This is also the average run length (ARL) of the Westgard algorithm.  Define the optimum shift to be detected as 1.0, 1.2 and 1.5. Using this and the above ARL, gives a weighting factor w of 0.15, 0.20 and 0.30 (Fig. 2).  With these selected values derived from Fig. 2, EWMA chart limit (q) were obtained to be2.30, 2.35 and 2.42 from Fig. 3. For one control sample per month (n = 1), the central line, upper control limit (UCL) and lower control limit (LCL) are calculated as follows. CENTRAL LINE = = s CONTROL LIMITS =36.51+2.30(23.01) = 36.51+15.07= 51.58 =36.51-2.30(23.01) = 36.51-15.07= 21.44 Using the same procedure, the control limits calculation for w = 0.1, 0.2 and 0.3 is shown in table 1 below. TABLE OF EWMA CONTROL LIMITS WEIGHTED/SIGMA LIMIT VALUE CONTROL LIMITS LCL CL UCL w = 0.15 q = 2.30 21.44 35.51 51.58 w = 0.20 q = 2.35 18.49 36.51 54.53 w = 0.30 q = 2.42 13.12 36.51 59.90 Table 1. COMPUTATION OF EWMA STATISTIC The EWMA statistic is calculated using three (3) different values of w (weighted parameter) so as to come out of the appropriate value. The statistic is Zi =wxi + (1-w) , 0 < w ≤ 1 For w =0.15, Z1 = 0.15(15) + (1 -0.15)36.51=33.28 Z2 = 0.15(31) + (1 – 0.15)33.28=32.948 Using the same procedure, the EWMA statistic for w =0.15, 0.20 and 0.30 is shown in table 2.
  • 5. On The Use Of Exponentially Weighted… www.ijmsi.org 5 | P a g e Fig. 4,5 and 6 below represents the EWMA charts for w = 0.15, 0.20 and 0.30 respectively when the values of Zi where plotted against sample number. EWMA CHARTS ON ROAD CRASHES IN ZONE RS8 The figures below display the EWMA charts with different weight parameters (w). Fig. 4. Fig. 5.
  • 6. On The Use Of Exponentially Weighted… www.ijmsi.org 6 | P a g e Fig. 6. From the EWMA charts above, the process is out of control for the three values of weighted parameter (w) and they indicate out of control signals at different points. For w =0.15 and 0.20, both charts detected the first out of control signal at point 119 which correspond to November, 2009 while for w= 0.30, the first out of control signal was at sample point 118 which corresponds to October, 2009. Therefore, the higher the weighted parameter, the faster it detects an out of control signal. Thus providing validation of the methodology employed to set up Minitab using Neubauer table in determining the weighted parameter, limit q of the EWMA chart and the nominal ARL.Therefore, the higher the weighted parameter, the faster it detects an out of control signal. COMPUTATION OF EWMA STATISTIC ON ROAD TRAFFIC CRASHES IN ZONE RS8 FOR THE YEAR 2001 to 2010 Sample No. (i) No of Road Crashes (Xt) zt = [wXi + (1 - w)zt-1] w=0.15 w=0.20 w=0.3 1 15 33.28 32.21 30.06 2 31 32.94 31.97 30.34 3 46 34.90 34.77 35.04 4 55 37.92 38.82 41.03 5 44 38.83 42.06 41.93 6 23 36.46 38.25 36.24 7 15 33.24 33.60 29.87 8 11 29.90 29.08 24.21 9 23 28.87 27.86 23.85 10 28 28.74 27.89 25.09 11 44 31.03 31.11 30.76 12 44 32.98 33.69 34.74 13 12 29.83 29.35 27.91 14 30 29.86 29.48 28.54 15 41 31.53 31.79 32.28 16 39 32.65 33.23 34.29 17 45 34.50 35.58 37.51 18 33 34.28 35.07 36.15 19 21 32.29 32.25 31.61 20 17 30.00 29.20 27.23 21 28 29.70 28.96 27.46 22 37 30.80 29.97 30.32 23 22 29.50 28.38 27.83 24 50 32.58 32.70 20.98 25 15 29.94 29.16 19.18 26 12 27.25 25.73 17.03 27 31 27.81 26.78 21.22
  • 7. On The Use Of Exponentially Weighted… www.ijmsi.org 7 | P a g e 28 27 27.69 26.83 22.95 29 35 28.79 28.46 26.57 30 22 27.77 27.17 25.20 31 20 26.60 25.73 23.64 32 18 25.31 24.19 21.95 33 23 24.96 23.95 22.26 34 6 22.12 20.36 17.38 35 20 21.80 20.29 18.17 36 28 22.73 21.83 21.12 37 24 22.92 22.26 21.98 38 17 22.03 21.21 20.47 39 38 24.43 24.57 25.74 40 57 29.32 31.06 35.12 41 38 30.62 32.44 35.98 42 16 28.43 29.16 29.99 43 26 28.07 28.52 28.79 44 14 25.96 25.62 24.36 45 26 25.97 25.70 24.85 46 48 29.27 30.17 31.79 47 37 30.43 31.53 33.36 48 50 33.37 35.22 38.35 49 22 31.66 32.58 33.44 50 21 30.06 30.26 29.71 51 35 30.80 31.21 31.30 52 52 33.98 35.37 37.51 53 53 36.83 38.90 42.16 54 27 35.36 36.52 37.61 55 22 33.36 33.61 32.93 56 21 31.51 31.09 29.35 57 23 30.23 29.47 27.44 58 48 32.90 33.18 33.61 59 33 32.92 33.14 33.43 60 64 37.58 39.31 42.60 61 21 35.09 35.65 36.12 62 30 34.33 34.52 34.28 63 22 32.48 32.02 30.60 64 38 33.31 33.21 32.83 65 36 33.71 33.77 33.77 66 38 34.35 36.62 35.04 67 31 33.85 33.89 33.83 68 28 32.97 32.71 32.08 69 22 31.32 30.57 29.06 70 46 33.52 33.65 34.14 71 51 36.12 37.13 39.20 72 61 39.85 41.90 45.75 73 24 37.47 38.32 39.22 74 39 37.70 38.45 39.15 75 20 35.05 34.77 33.41 76 33 34.74 34.41 33.28 77 40 35.53 35.53 35.30 78 30 34.70 34.42 33.71 79 29 33.85 33.34 32.30 80 31 33.42 32.87 31.91 81 18 31.12 29.90 27.73 82 28 30.65 29.52 27.81 83 39 31.90 31.41 31.17 84 46 34.02 34.33 35.62 85 19 31.77 31.26 30.63 86 35 32.25 32.01 31.94 87 35 32.66 32.61 32.86 88 37 33.31 33.49 34.10 89 41 34.46 34.99 36.17 90 39 35.14 35.79 37.02 91 25 33.62 33.63 33.41 92 21 31.73 31.11 29.69 93 19 29.82 28.69 26.48 94 29 29.70 28.75 27.24 95 36 30.65 30.20 29.87 96 51 33.70 34.36 36.21 97 32 33.45 33.89 34.94
  • 8. On The Use Of Exponentially Weighted… www.ijmsi.org 8 | P a g e 98 23 31.88 31.71 31.36 99 34 32.20 32.17 32.15 100 42 33.67 34.13 35.11 101 24 32.22 32.11 31.77 102 52 35.19 36.09 37.84 103 26 33.81 34.07 34.29 104 23 32.19 31.85 30.90 105 36 32.76 32.68 32.42 106 33 32.80 32.75 32.60 107 32 32.68 32.60 32.42 108 133 47.73 52.68 62.60 109 32 45.37 48.54 53.42 110 17 41.11 42.23 42.49 111 23 38.39 38.39 36.64 112 25 36.38 35.71 33.15 113 21 34.07 32.77 29.50 114 37 34.51 33.61 31.75 115 32 34.13 33.29 31.83 116 48 36.21 27.43 36.68 117 31 35.43 28.14 34.98 118 131 49.77 48.72 63.54 119 139 63.15 66.77 86.35 120 116 71.08 76.62 95.24 121 44 67.02 70.09 79.87 122 35 62.22 63.08 66.41 123 31 57.54 56.66 55.79 124 20 51.91 49.33 45.05 125 32 48.92 45.86 41.14 126 35 46.83 43.69 39.29 127 53 47.76 45.55 43.41 128 46 47.50 45.65 44.19 129 59 49.23 48.31 48.63 130 89 55.20 45.64 60.74 131 109 63.27 60.65 75.22 132 113 70.73 50.56 86.55 Table 2 V. RESULT EWMA was designed and applied using three (3) different values of weighted parameters/smoothing constant (w) which are 0.15, 0.20 and 0.30. Table 2 shows the EWMA statistic tabulation. The values of control limit for the three values of w are show in table 1. The values of Zi (EWMA) were then plotted against the sample number for the three values of w and the corresponding EWMA control charts are shown in Fig. 4 to 6 respectively. It can be seen from the charts that the process is out of control for the three values of w. For w =0.15 and 0.20, both charts detected the first out of control signal at point 119 which correspond to November, 2009 while for w= 0.30, the first out of control signal was at sample point 118 which corresponds to October, 2009. Therefore, the higher the weighted parameter, the faster it detects an out of control signal. VI. CONCLUSION The effectiveness of EWMA chart relative to determining shifts in underlying pattern and the efficiency of the charts relative to the time and expertise required to generate the chart was taken into consideration. EWMA chart was very capable at detecting changes in the Road Traffic Crashes recurrent (persistent) pattern when properly configured within Minitab. That is, it is very effective at detecting small change like mean shift of 1.0 sigma as used in this paper work. In view of our findings, we strongly observed that EWMA generally provided a slightly faster alarm Since the EWMA methodology detects shift quickly for this type of dataset, it may be an efficient choice for monitoring it. Conclusively, for such applications within this organization EWMA can be an efficient tool. VII. RECOMMENDATION From Fig. 4 and 5, the first out of control signal at point 119 corresponding to November, 2009 and continues to February while from Fig. 6 first out of control signal was at sample point 118 which corresponds to October, 2009 and also continues to February. These months correspond to the Christmas and New-year celebration periods in Nigeria when most people use the highways to travel to their home towns. It is then suggested that the Federal Road Safety Commission (FRSC) and other Agencies who are engaged in road safety
  • 9. On The Use Of Exponentially Weighted… www.ijmsi.org 9 | P a g e activities should increase their earnest effort by deploying more Road Safety officers to strategic locations on the high ways and making sure that road users adhere to traffic rules so as to ensure that Nigeria roads are under proper check and safe for all traffic roads users in order to reduce the high rate of road traffic crashes probably leading to loss of lives. REFERENCES [1] Crowder, S.V (1987, 1989). Design of exponentially weighted moving average schemes. J. of Qual Technology 21, pp. 155-162. [2] Crowder, S. V. (1987). A simple method for studyingrun length distributions of exponentially weighted moving average charts. Technometrics, 29, pp. 401–407. [3] Dugans, A.J. (1974). Quality control and industrial statistics, 5th edition. [4] Hawkins, D. M., Qiu, P., and Kang, C.-W. The Changepoint Model for Statistical Process Control, Journal of Quality Technology, 35, pp. 355-365 [5] Lucas JM, Saccucci MS (1990). Exponentially Weighted Moving Average Control Schemes: Properties and Enhancements. Technometrics, 32, pp. 1-12. [6] Montgomery, D.C. (1996). Introduction to statistical quality control, 3rd edition, Johnson Wiley & Sons. [7] Neubauer (1997). Optimal weighted parameter for EWMA chart according to the shift, Technometrics, Vol.22.S [8] Osanaiye, P.A. (2010). Quality control analysis and management, STA 658. [9] Pages, E.S (1954). Continous inspection Scheme, Biometrica, 41, pp.100 [10] Roberts, S. W. (1959). Control Chart Tests Based on Geometric Moving Averages, Technomearics, 1, pp. 239-250. [11] Robinson, P.B. and HO, T.Y. (1978) - Average run lengths of geometric moving average charts by numerical methods,Technometrics, 20, pp 85–93. [12] www.jmu.edu [13] www.uc.edu [14] www.minitab.com [15] www.anygeth.com [16] www.engineerlive.com [17] www.google.com [18] www.itl.nist.gov