SlideShare ist ein Scribd-Unternehmen logo
1 von 89
Introduction-Retail in India
Retailing is the largest private sector in India and second to agriculture in
term of providing employment to people. India today has perhaps the highest
retail outlet density with approximately 12 million retail outlets. The retail
industry in the country is broadly divided into the organized and
unorganized sectors. The total market in 2005 stood at $225 billion,
accounting for about 11% of the country's gross domestic product (GDP). Of
this total market, the organized sector accounted for $ 8 billion of the total
revenues. That represents only 3.5% share of this market. According to AT
Kearney, the organized retailing industry is expected to cross $23 billion
revenue mark by 2010.its share as represented in urban scenario is projected
to be 12 to 20%. Growing at more than 30%, the organized sector is driving
the retail growth in India and contributes significantly to the growth of the
economy. This economic growth comes primarily from increased consumer
spending. Retail is currently the biggest industry in the world with sales of
$7.2 trillion. Every 10th billionaire in the world is a retailer. 25 of the top 50
Fortune 500 companies are in retail.

The retail market in India is the second largest untapped market after China.
According to a survey by A T Kearney, the size of the retail industry in India
is pegged at Rs 400,000 crore, and is expected to double to Rs 800,000 crore
by 2006. The biggest challenge for Indian retailing lies in the nature of the
sector, which is highly fragmented and unstructured. A T Kearney estimates
that the organized retail market is Rs 20,000 crore, while K S A Technopak,
values it at Rs 5,000 crore. By 2005, A T Kearney predicts an eight-fold
increase in organized retail while KSA Technopak estimates a six-fold


                                        1
growth. The difference in these projections is attributed to their divergent
definitions of ‘organized retailing’. While India’s retailing format has
hitherto been basic at best, change is in the air. Over the past few years,
there has been a proliferation of organized sector players entering or
expanding their presence in the retail market. A number of large business
groups such as Tata, RPG, Rahejas and Piramal have set up malls and built
businesses within retail.
This includes the Rs 190 crore (McKinsey estimate) FoodWorld, India’s
leading supermarket chain. Other supermarket chains like Trinetra, Nilgiris,
Apna Bazar and Subhiksha are rapidly establishing themselves.


                                     2
Dia. 3.1 Organized Retail In India


The apparel sector has seen the emergence of stores like Pantaloons apart
from company owned exclusive stores. Names like Shopper’s Stop,
Lifestyle, Westside etc., have gained prominence in the lifestyle and fashion
segments, and chains like Archies, Musicworld and Crossword cater to the
books and music market. Even sectors like consumer durables have seen the
emergence    of organized retailers like Viveks (in Chennai)                and
JainsonsUrban markets are more attractive given the higher disposable
incomes of the urban population. The increasing attractiveness of the sector
is raising interest from a number of global retailers. McKinsey predicts that
global companies such as Tesco, Kingfisher, Metro, Carrefour, and Ahold
are exploring entry options, even as names like Benetton and Lifestyle have
already built a presence in India. Even though the retail sector in India has
been growing rapidly, there is still a long way to go. Firstly, organized
retailers face steep regulatory and infrastructural barriers. Real estate access
is complicated and complex, as is the tax system. In addition, the
competition from the unorganized sector is formidable. As in any other
industry, unorganized retailers enjoy higher margins due to lower
operational costs. Organized retailers must counter the convenience of a
hop-skip-and jump access of the small, neighborhood stores. These Indian
versions of the mom and-pop store have some traditional advantages that
make them formidable opponents for modern trade – established
relationships with local consumers, easy credit terms, quick and easy
acquisition of products in line with customer preferences and home delivery.

                                       3
The past few years have seen the spending power of the middle class
increasing exponentially. Shopping for anything – from cars to cutlery,
groceries to personal accessories is now a fun thing for the family to do
together. Malls have become the alternative hangout and are growing in their
popularity as the preferred venue for holiday and evening outings. The new
brand of consumer has arrived – ‘the recreational shopper’. The Retail
Industry in India is at the crossroads. India is ushering in a revolution in the
retailing industry. This is attributed to the huge sum of money being poured
in real estate, modern logistic and the creation of new brands. While the
opportunity is large the rate and quantum of growth is uncertain. As retailers
hope that shopping becomes the sport of choice (perhaps even displacing the
old favorite – cricket), some might well say that the retail boom is only just
beginning.
Historical Evolution for retail in India
                                                                             Modern Formats/
 Historic/Rural         Traditional/Pervasive       Government                International
 Reach                         Reach                 Supported

                                                                              Exclusive Brand Outlets
                                                                              Hyper/Super Markets
                                                                              Department Stores
                                                                              Shopping Malls

                                                     PDS Outlets
                                                     Khaki Stores
                                                     Cooperatives

                          Convenience Stores
                          Mom and Pop/ Kiranas

      W eekly Markets
      Village Fairs
      Melas

                                 Neighborhood                                       Shopping
          Source of                                    Availability/ Low
                              Stores/Convenience                               Experience/Efficiency
        Entertainment                                 Costs / Distribution


                                                4
Dia. 3.6 Historical Evolutions for Retail in India
                           Sources: - ICICI presentation
                Different Retail Format Used in India
Hypermarkets
The hypermarket format is most suitable and appealing to the Indian
consumer. Very large - over 40,000 sq. ft. The largest retailers operating in
this format are Pantaloon Retail with Big Bazaar, RPG Enterprises with
Giant (now Spencer’s) and Tata Trent’s Star India Bazaar hypermarkets.

Most retailers are likely to continue expanding in the larger Indian cities and
select tier-two cities with potential for growth. Some of the trends in the
hypermarket format are a rapid growth in revenue led by volumes, and
expansion in both large and medium cities.

Supermarket
Self-service stores - Approx. 4,000 to 20,000 sq. ft. in size, with a strong
focus on food and personal care. Supermarkets take the form of a one-stop-
shop, catering to the consumer's need for choice and variety. Clientele of
supermarkets consist mostly of affluent Indians who are not too price-
sensitive, prefer convenience, hygiene and the attractive atmosphere. Large
players operating through these formats include Food Bazaars from
Pantaloon Retail, RPG’s Food world supermarkets, Trinethra supermarket
and Nilgiris.

Discount stores


                                         5
If we stripped down supermarkets, offering basic range of grocery products
typically at great discounts. They run extremely cost-efficient operations by
reducing the complexity of inventory, and offering a basic ambience. The
most prominent discount grocery chains are Subiksha (leader) and Margin
Free Markets.


Cash And Carry
Usually - 70,000 to 100,000 sq. ft. stores that sell products to members,
comprising retailers and institutions. The key added value is a wide range of
products        under     one       roof,      at      wholesale       prices


Neighborhood Store
Traditional stores that provide basic offerings, fixed prices, zero usage of
technology, and little or no ambience. These are either dying out, or
repositioning themselves, on the basis of convenience and quality.


                                      6
Table 3.1 Different Retail Format and value position


     Current Trends in Indian Retailing Industry


•   Rising income levels, education and a global exposure have
    contributed to the evolution of the Indian middle class purchasing and
    shopping habits are maturing as a result.
•   Current organized retail is small and fragmented with players not
    being able to reap economies of scale.
• Retailing through formats such as supermarkets, hypermarkets,
    department stores and other specialty chains are increasing. Leading
    industrial houses in the country are investing in the sector. This


                                    7
includes Food world, Shopper’s Stop, Crossroads, Globus, Pyramid
    and other such outlets.


Dia. 3.7 Four Axis for Retail Scale up                     Sources: FICCI


• Retailing through non-traditional channels such as Fuel Stations,
    Direct Selling and Home Shopping Television is on the rise.
• FDI in retail trading is not encouraged in any form. However, a few
    foreign retail names appearing in the market are in the nature of
    franchisee.
•   Foreign retail chains like Marks & Spencer have already established
    their operations in the growing Indian market. Several companies
    including Metro, Tesco, and Carrefour are exploring entry options.
    Benetton and Lifestyle are already in the business in India.


                                    8
Opportunities


  •   Organized retail is a lucrative proposition for a player who can bring
      in best practices from around the world, leverage economies of scale
      and reap these benefits through retail operations in India.
  •   India has a large middle class of 350 million and an educated
      workforce to handle various critical functions like merchandising,
      sales promotion, inventory management, purchasing and marketing.
  •   India also possesses IT skills in the area of supply chain management,
      database management and inventory management
  •   A number of drivers are aiding the growth of the industry such as
      enhanced levels of income and increasing purchasing power, entry of
      foreign retailers and reforms in real estate markets. Given these
      developments the organised retailing sector is poised for significant
      growth in the country.
Customer Is a King OR Queen


                   Dia.3.8 Customer is a king or queen


Future of Retail Industry in India


                                      9
Over 70% of the urban population is estimated to reside in Class I
cities (population of over one million) and rest of them mostly stays in class
II cities. This is largely as a result of increased employment opportunities in
cities as well as a preference among the younger generation to move away
from agriculture. Population by age group one of the important demographic
trends in recent times is the changing age profile. India is increasingly being
acknowledged as a “young” nation, with about 35% of its population less
than 14 years of age. The median age of India’s population is 24 years.


                Dia. 3.9 Organized Retailing –Market Size
Source: FICCI
Youth are generally early adopters of most modern products and concepts.
Given the higher aspirations and “willingness to change” of the younger age


                                      10
group, India’s age profile offers high market potential for consumer goods.
However, in the long term, this factor represents a challenge as rapidly
growing numbers of ageing consumers will have more discretionary income
but will spend less on goods and more on healthcare and other services as
well as saving for retirement. Set out below is the forecast of the age profile
over the next 12 years.


                      Table. 3.2 Population Projection


POPULATION
Population estimated at 1,055 million (2003) is growing by 1.7% this year.
Growing is a key trend in the country, with rural growth averaging to 17.9%
and urban 30.7% for the period 1991 to 2001.
Statistics with regard to population growth and the rural split are setout
below.


                                      11
Source: - KSA Technopack
                Dia. 1.10 Indian Consumer Market

      Wholesale Part of Retailing in India


                               12
Dia: 15.1 Traditional   and Mostly followed Supply chain model


India followed by retailer and manufacturer
     • Supplier-driven product development process.
     • Push / pipeline model.
     • One-way info flow of information from supplier to retailer


                                      13
Dia: 15.2 New Form of supply chain in place to be in Future


                    Manufacturer                                                        Telephony
                                                                                      Infrastructure

                                                               Direct
                                                              Marketing


                                                                                              Web Infrastructure

                                                        Transportation


    Overnight Delivery

                                         Distributors
                                                                          Retailers


                     Infomediary and
                    Outsourced Service
                         Providers


In new globalize world this is going to happen in retail and manufacturer
relationships. So there will be a backward integration also in supply chain
in coming future with help of internet and technology.
• 2-way real-time information flow
•    Networking model provides immediate sales feedback up and down
     the supply chain.
•     Fully informed supply through all phases of product life cycle


                                                   14
Visual Merchandising (VM) is the art of presentation, which puts the


merchandise in focus. It educates the customers, creates desire and


finally augments the selling process. This is an area where the Indian


textile and clothing industry, particularly, the SMEs lack adequate


knowledge and expertise. This inadequacy is best reflected in poor


presentation/display and communication in various national and


international exhibitions. Therefore this Programme has been


conceived to fill this gap. VM helps in: educating the customers about


the product/service in an effective and creative way. establishing a


creative medium to present merchandise in 3D environment, thereby


enabling long lasting impact and recall value. setting the company


apart in an exclusive position. establishing linkage between fashion,

                                      15
product design and marketing by keeping the product in prime focus.


combining the creative, technical and operational aspects of a product


and the business. drawing the attention of the customer to enable him


to take purchase decision within shortest possible time, and thus


augmenting the selling process.


STATUS OF VISUAL MERCHANDISING IN INDIA: Unlike the
western countries, where
VM receives highest priority in commercial planning of a product, the
Indian industry’s understanding and practice of the concept of VM
is inadequate. With phasing out of quantitative restrictions after the
year 2004, the textile industry will have to compete purely on the
competitive edge of the products and VM will be a helpful tool in
projecting the uniqueness of the products and thereby increasing the
market access and sales. It is high time that the Indian textile and
clothing industry, therefore, understands and adopts the scientific and
professional system of VM rather than the traditional practices of
display of products and communication.


                                       16
17
About Vishal Mega Mart
Ram Agarwal started Vishal Mega Mart in Kolkata in 1986, in a 100
sq ft shop in Lal Bazaar. It was a struggle in the beginning, but within
two years his store had taken off, and today Vishal Mega Mart has
branches all over the country.

With a turnover of Rs 89 crore (Rs 890 million), Vishal Mega Mart has
been one of the pioneers of bargain retailing in India, and now it is
diversifying to become an all-purpose departmental store.

In the beginning

His family had a business in Calcutta (now Kolkata) when he was
growing up, but he wanted to do something different, so he got a job
instead. However, by 1984, he got bored and decided to start
something by myself.

At that time, especially in Calcutta, there weren't really any retail
stores. People would buy fabric and get their clothes stitched. He was
one of the first people to put forward the idea of a large departmental
style retail store that early on.


Financial worries

He started with around Rs 100,000, for which he had to take out a
loan as well as dip into some family savings. This went into renting
their workspace, which was an office and a workshop rolled in one,


                                    18
and hiring the three people he had working for him. They sourced all
their material from Calcutta itself, and stitched their garments in-
house.

It took two years for them to really take off -- until then it was a
continuous learning process for him, since he was relatively
inexperienced in running a business. He had to learn various tricks
along the way, especially in terms of selling. They set up their first
shop in 1986, and by 1990, they had four showrooms in Calcutta.

The first big outlet was set up in the popular Esplanade area in 1997.
The thing that really made a difference was, around 1988, he had the
brainwave of introducing sales. That idea really took off -- they would
buy in bulk at discounted rates, and sell at really low prices. They
took temporary shops and put up sales -- they'd get lines going
around the corner!

Expanding sales

The first shop they opened outside of Calcutta was in Bhubaneshwar,
and today they are present in cities like Jaipur, Indore, Hyderabad
and Pune. They set up their first Delhi shop in 2002 -- now they have
seven.

He owe all his success to the fact that he has managed to really
differentiate his product: they offer pure value for money. They do
business at a low margin, by cutting the middle-man -- and that's why
they clicked. They're probably the only players in India who purchase
with cash, and buy directly from the manufacturer. They started with a


                                  19
price point of Rs 125 on average, and today this has only increased
to Rs 250, pretty reasonable by today's standards. They even do
formalwear within this range.

The inspiration

He got the inspiration to diversify his stores when he went abroad.
Big retailers like Sears or Walmart cater to absolutely everything. In
India we don't have their equivalent here. While it is emerging now in
India, there is still nothing like an organised retail sector.

In the beginning of 2004, they started to branch out into furnishings,
cosmetics and other fast-moving consumer goods. They now have a
1,50,000 sq ft hypermarket in New Delhi's Mathura Road.

At this point, it is a little tough to manage this kind of expansion,
especially with all the different varieties it brings -- you have to keep
your fingers in several pies at once which is a bit of a juggling act --
but if you can manage this sector, there is no doubt that you will be
king of retail in India.

Hope for the future

They hope to reach Rs 5,000 crore (Rs 50 billion) by 2010. This is a
sobering thought, given that when he first started, they were making
sales of around Rs 200 a day! Their expansion plans are still on
target, they're planning more stores in Delhi and the big metros. He
think the main reason for his success is that he was in the right place
at the right time, and he realised that the middle classes were a vast


                                     20
untapped resource. Middle class wanted to spend their money, but
they also wanted bargains, and this is exactly what he gave them.


The VISHAL Group: What started as a humble one store enterprise in
1986 in Kolkata (erstwhile, Calcutta) is today a conglomerate encompassing
49 showrooms in 37 cities. India’s first hyper-market has also been opened
for the Indian consumer by Vishal. Situated in the national capital Delhi this
store boasts of the singe largest collection of goods and commodities sold
under one roof in India.
     The Group has a turnover of Rs 150 crore for 2004-05. Under the
dynamic leadership of Mr. Ram Chandra Agarwal the group is expecting
to touch the turnover of Rs 300 crore by the end of March 2006 and Rs
650 crore for the period 2006-07.


The group’s prime focus is on retailing. The Vishal stores offer affordable
family fashion at prices to suit every pocket.


The group’s philosophy is integration and towards this end has initiated
backward integration in the field of high fashion by setting up a state of the
art manufacturing facility to support its retail endeavors.


Vishal is one of fastest growing retailing groups in India. Its outlets cater to
almost all price ranges. The showrooms have over 70,00 products range
which fulfills all your household needs, and can be catered to under one
roof. It is covering more than 11 Lacs of sq. ft. in retail space and more than
5 Lacs sq.ft. under construction. Each store gives you international quality


                                       21
goods and prices hard to match. The cost benefit that is derived from the
large central purchase of goods and services is passed on to the consumer.
The Founders:


                    Mr.Ramchandra Aggarwal


                        Mrs.Uma Aggarwal


                       Mr.Surendra Aggarwal


                                     22
Introduction to the Research topic


Vishal Retail Ltd is one of the leading retail houses in India. As of January
25, 2007, they operated 48 retail stores of Vishal Mega Mart spread over
1,150,000 square feet across 37 cities in 17 states. In their efforts to
strengthen their supply chain, they have set up seven regional distribution
centers and an apparel manufacturing plant.


They started as a retailer of ready-made apparels in Kolkata in 2001. In
2003, they acquired the manufacturing facilities from Vishal Fashions
Private Limited and M/s Vishal Apparels. Subsequently, with evolution of
retail industry in India and change in consumer aspirations, they diversified
their portfolio of offerings to include other retail goods. Currently, they sell
ready-made apparels and a wide range of household merchandise and other
consumer goods such as footwear, toys, watches, toiletries, grocery items,
sports items, crockery, gift and novelties.


They follow the concept of value retail in India. In other words, their
business approach is to sell quality goods at reasonable prices by either
manufacturing themselves or directly procuring from manufacturers
(primarily from small and medium size vendors and manufacturers). They
endeavour to facilitate one-stop-shop convenience for their customers and to
cater to the needs of the entire family. They believe this concept has helped
them grow to their current size within a short time frame of four years.


                                        23
Why chosen Vishal Mega Mart as the research subject


        We all know that Retail is one of the fastest growing sectors in India
and in the time to come it is expected to grow manifold. Hence this is the
sector which has immense opportunities not only for working professionals
but for the freshers, new to the corporate world, too. We have chosen retail
sector as we are eyeing the same to enter into, after successful completion of
our MBA programme because of the already mentioned reason. Further we
have chosen Vishal Mega Mart as our research subject because it is the
biggest and only specimen of organized retail in general merchandise in
Dehradun till date, though there are more than one organized food retailers
like Mc Donalds, Pizza Hut and Narula’s operating in the city.


                                      24
Review of Literature

The study of consumer store-choice or patronage behavior has been an
important area of research in retailing for many decades. The decision on the
choice of store has been modeled in different ways in the literature. Some of
the studies have taken the household as a rational decision making unit,
(Becker, 1965; Goldman and Johansson, 1978; Bawa and Ghosh, 1999).
Similarly, Bell, Ho and Tang, (1998) in their work on store choice found
evidence that each shopper is more likely to visit the store with the lowest
total shopping cost.

Some of the researchers (Bell, Ho and Tang, 2001) have worked on the
shoppers perceived utility and the store image in making the store choice.
Research also exists on how store environment cues influence consumers'
store choice decision criteria, such as perceived merchandise value and

shopping experience (Baker, Parasuraman, Grewal, and Voss, 2002).
Store choice has also been seen in the context of the risk reduction strategies
of the shoppers (Mitchel and McGoldrick, 1996; Mitchell and Harris,
2005). In addition work on store choice has also been done on the role of
situational factors (Wu, Petroshius, and Newell, 2004) and the task-store
attribute relationship (Kenhove, Wule, and Waterschoot, 1999) found to
be dependent on the timing of shopping trips, with consumers visiting
smaller local store for short "fill-in' trips and larger store for regular
shopping trips (Kahn and Schmittlein, 1989).


Most of the studies in store choice have however pointed out the primacy of
store location (Arnold, Oum and Tigert, 1983; Freymann, 2002) and price

                                      25
(Bell, Ho and Tang, 2001; Freymann, 2002; Arnold, Oum and Tigert,
1983) as the key drivers of store choice. Lastly Bell and Lattin (1998)
found a systematic relationship between a household's shopping behavior
and store preference, especially in the context of choice of a format

The most common technique employed in the methodologies of the majority
of research work involved in store image measurement has been by asking
consumers to rate particular outlets on pre-defined scales. Thus, the semantic
differential scaling used by Osgood et al. (1957) has subsequently been
widely employed. Five or seven point bi-polar scales have been the most
common (e.g. McDougall and Fry, 1974; Golden et al., 1987; and Cassill et
al., 1993), but Hansen and Deutscher (1977) used staple scales ranging from
zero to ten. Others, such as James et al. (1976) have utilized attitudinal
scaling techniques when evaluating attributes for a particular store (e.g.
‘very good’ or ‘very bad’), with total scores indicating how well a store
filled consumer expectations overall. Cassill et al. (1993) made some
attempt to summarise these ratings of individual attributes by using factor
analysis. They found that consumers choose to patronise individual
department stores for clothing purchases when a combination of factors were
present: the stocking of particular brands; the presence of national and own
branded products; and where garments offered functional value rather than
fashion appeal. Two problems characterise the majority of previous studies
of store image. First, the dimensions on which consumers are asked to rate
particular outlets have largely been predetermined by the researcher, and
have not emanated from the respondents themselves. Second, many studies
have treated attributes of store image as if they are all equally important,
which need not necessarily be the case. surprising, therefore, that researchers


                                      26
have striven consistently to provide an improved understanding of store
image (Martineau, 1958; Kunkel and Berry, 1968; Lindquist, 1974; In
Martineau’s (1958) paper, it was suggested that retail outlets had, so far as
customers wereconcerned, a ‘personality’ composed of functional and
psychological attributes. It can be concluded from this early work on store
image that findings from one sector are not, necessarily, broadly applicable.
It is not surprising, therefore, that Davies (1992) concluded that store image
is likely to be situation specific, varying according to the purpose of each
consumer purchase. Osman (1993) has attempted to relate these two factors,
by proposing that consumer attitudes to store choice are affected by the store
rating on each of the contributing attributes.

This is therefore, a critical area for further research work, as often managers
have been shown to perceive their own retail image differently from that of
their customers (McLure and Ryans, 1968).

The studies on store choice have mostly dealt with individual choices and
the studies have investigated the drivers of store choice taking individuals as
the samples (mostly housewives). Little research exists, which analyses the
shopping behavior with a family or household as a unit. Researchers have
found that, store choice and shopping trip timing decisions tend to differ for
individuals and households as a result of personal differences, household
composition, and activity patterns (Leszczyc and Timmermans, 1997; Kim
and Park, 1997). Similarly work has been done on household demographic
variables (Leszczyc, Sinha, and Timmermans, 2000; Bawa and Ghosh,
1999) and relating them to the shopping behaviour of the household, the trip
timing (Kahn and Schmittlein, 1989) and the store choice (Kau and
Ehrenberg, 1984). However, as compared to the work on the product and


                                       27
service choices by the families/households, the work on store choice is quite
less and covers few dimensions.


The existing research supports that household size has a positive effect on
the likelihood of a shopping trip (Leszczyc, Sinha, and Timmermans,
2000). Similarly Bawa and Ghosh, (1999), found that the size of the family
was positively associated with the frequency of shopping trips and the
basket size.


The household composition, will also affect the shopping basket, it has been
suggested that for a given household size, the presence of children in the
household is likely to lower expenditures relative to an all-adult household
due to differences in consumption rates for children and adults (Prais and
Houthakker, 1971; Benus, Kmenta and Shapiro, 1976; McClements,
1977; Muelbauer, 1980). In addition, the presence of children is likely to
result in a more diverse basket size, with higher chances of stock outs and
greater impulse purchases. Thus the presence of children will induce
baskets, with larger baskets in terms of categories, but smaller baskets in
terms of size.


                                     28
Hypothesis Formulation


Every test of significance begins with a null hypothesis (H0 ). H0 represents
a theory that has been put forward, either because it is believed to be true or
because it is to be used as a basis for argument, but has not been proved.
The very first step in the formulation of hypothesis is to formulate two
hypotheses instead of one in such a way that if one is accepted then the other
is rejected or vice versa. The other one is called as alternative hypothesis
(Ha ). It is a statement of what a statistical hypothesis test is set up to
establish.


In our study we have formed a number of hypotheses:

H01: More buying intention of customers is independent of gender.
H02: More buying intention of customers is independent of age.
H03: Unique shopping experience of customers is independent of gender.
H04: Unique shopping experience of customers is independent of age.
H05: Customer’s opinion of products being trendy and of latest style is
independent of gender.
H06: Customer’s opinion of products being trendy and of latest style is
independent of age.


                                      29
Objectives of study
1. To study the shopping behavior of customers coming to
  Vishal Mega Mart.
2. To study the consumer perception and attitude towards
  Vishal Mega Mart as a brand.
3. To study the effectiveness of visual merchandising in Vishal
  Mega Mart.
4. To study the perception of customers about products and
  services offered by Vishal Mega Mart.
5. To study the perception of customers of the prices of
  products and services offered by Vishal Mega Mart.
6. To study the customer perception about the promotional
  strategies of Vishal Mega Mart.


                             30
Scope and Importance
Though Vishal Mega Mart operates in 37 cities with 49 showrooms, the
study is restricted to the Dehradun region because of the time, cost and
accessibility constraints.
The study is important because it gives insight into the customer’s
perception towards organized retailing and gives an idea of customer’s
overall shopping behavior. It is important to Vishal Mega Mart because it
reveals the strong and weak points of the store. Thus it gives an opportunity
to the store to recognize and improve upon its weak points and convert its
strong areas into strategic advantage. Till date Vishal Mega Mart is the only
player in organized general merchandising and thus is enjoying the benefits
of monopoly. But in the time to come many big players like Big Bazaar,
Reliance etc. are also planning to enter Dehradun. Thus the report can be
useful to these new entrants also, as it provides a clue about the customer
behavior.


                                     31
Research Methodology
Research methodology is a way to the systematic solution of a research
problem. It focuses on the various steps adopted in studying the research
problem along with the logic behind using them.


Research Design
Research design is the conceptual structure within which research is
conducted. A research design specifies the methods and procedures for
conducting a particular study.
Research type
   Our research is both Exploratory as well as Descriptive. Explorative
because it focuses on the discovery of ideas and uses secondary data and
Descriptive because it also focuses on the characteristics of certain group of
customers such as age, sex, income etc.
-Universe
All the items under consideration in any field of inquiry constitute a
‘universe’. In our case it is the population of Dehradun city.
-Duration
The research work has been completed within the time limit specified by the
Management i.e. two months.


Sample Design
A sample design is a definite plan determined before any data are actually
collected for obtaining a sample from a given population. In our case we
have used systematic sampling. We stood at the exit of Vishal Mega Mart
and tapped every fifth customer.


                                      32
-Sample unit
Students, businessmen, servicemen, working women, house wives.
-Sampling technique
  Sampling technique is the technique or method by which the information
is collected. We have used well defined questioneres to collect the data.
Further we have also used the interview technique wherever we felt that the
respondents were not literate enough to answer the questions by themselves.
Interviews were taken in accordance with the questioneres.
-sample size
Initially we had 150 as the size of our research sample but responses of 7
respondents out of these 150 were found to be unfit to be included in the
sample so sample size got reduced to 143.


Data Collection
There are two types of data: primary and secondary.
Primary data is the data that have been observed and recorded by the
researchers for the first time to their knowledge.
Secondary data is the data that is not gathered for the immediate study at
hand but for some other purposes.
In our study we have used both types of data. Primary data has been
collected with the help of questioneres and interviews whereas secondary
data has been collected from various books and the websites.
Statistical tools used
-Measures of central tendency
-Chi-square test
-Simple pie and bar diagrams


                                       33
Analysis

Demographic analysis
1) Age


                                                 1-less than 20
                                                 2-greater than equal to 20 and
                                                 less than equal to 35
                                                 3-greater than 35


It can very easily be depicted from the graph that in our sample there are
  i.    only 7% people who are less than 20 years of age
 ii.    45% people belong to the age group of ‘greater than equal to 20 and
        less than equal to 35’
 iii.   48% people are greater than 35 years of age


                                      34
2) Income
                                                 1) Income<5000
                                                 2) 5000<=Income<10000
                                                 3) 10000<=Income<20000
                                                 4) 20000<=Income<30000
                                                 5) Income>30000


It can very easily be depicted from the graph that in our sample
  i.   24% respondents have income less than Rs5000
 ii.   17% respondents have income between Rs5000 and Rs10000
iii.   36% respondents have income between Rs10000 and Rs20000
iv.    19% respondents have income between Rs20000 and Rs30000
 v.    0nly 4% respondents have income more than Rs30000


                                      35
3) Expenditure
                                                1) Expenditure<1000
                                                2) 1000<=Expenditure<2000
                                                3) 2000<=Expenditure<3000
                                                4) 3000<=Expenditure<5000
                                                5) Expenditure>5000


It can very easily be depicted from the graph that in our sample
      i.   19% respondents have monthly expenditure less than Rs1000
     ii.   21% respondents have monthly expenditure between Rs1000 and
           Rs2000
    iii.   20% respondents have monthly expenditure between Rs2000 and
           Rs3000
    iv.    19% respondents have monthly expenditure between Rs3000 and
           Rs5000
     v.    21% respondents have monthly expenditure greater than Rs5000


                                      36
4) Gender


                                             1) Female
                                             2) Male
                          1
                         40%             1
             2                           2
            60%


                    1
                  100%


It can very easily be depicted from the graph that in our sample there are
40% females and 60% males.


                                    37
Shopping Behavior
 I.    I have started coming for shopping with my family now

                            Shopping with family


                       66
        70                                          Strongly agree
        60
                                                    agree
        50
                            38
        40                                          Neither agree nor
                                                    disagree
        30                        21                Disagree
        20       15

        10                              3           Strongly Disagree

        0


II. When I buy from VMM, I buy more than what I plan


                                            38
III. I have stopped visiting the old shop I used to visit


                                          39
Consumer perception and attitude towards VMM as a brand
IV. VMM offer a unique shopping experience

                     Unique shopping experience


      100            93                            Strongly agree

      80                                           Agree

      60                                           Neither agree nor
                                                   disagree
      40                  29                       Disagree

      20        8               9
                                       4           Strongly disagree

       0


 V.   Rate your shopping satisfaction level at VMM on the scale of 1-10(1 being
      poor and 10 being outstanding)


                                           40
VI.   Rate efficiency at billing counters of VMM on the scale of 1-10


VII. Rate layout of VMM on the scale of 1-10


                                          41
VIII. I will definitely come again to VMM for shopping


 IX. Rate following sections of VMM on the scale of 1-5(1 being poor and 5
      being outstanding)
             a) Grocery/Canned food


                                        42
b) Apparel

                        Apparel


                         65
70
                                   53
60                                           1
50                                           2
40                                           3
30                                           4
                   13
20             9                             5
                                        3
10
 0


     c) Kids

                         Kids


                         62
70
60                                           1
50                                           2
40                                 31        3
                   26
30                                      19   4
20                                           5
               5
10
 0


                              43
d) Footwear

                         Foot wear


70                  61
                           54
60                                            1
50                                            2
40                                            3
30                                            4
              12                     14
20                                            5
10                                        1

 0


     e) Household


                                44
f) Restaurant

                       Restaurant

                          50
                  47
50

40                                            1
                                              2
30                                            3
                                16
20                                            4
                                          8   5
10
         0
 0


     g) Overall


                                     45
Perception about Products and services
X. Rate quality of products at VMM on the scale of 1-10


XI. Rate product variety at VMM on the scale of 1-10


                                      46
XII. Products offered at VMM are trendy and of latest style


XIII. The way products are displayed makes me buy more than what I plan


                                        47
Price
XIV. Keeping the quality of products in mind, most of products at VMM are
     expensive


XV. Rate your satisfaction level regarding prices of products at VMM on the
     scale of 1-10


                                      48
XVI. I visit VMM because of less price or discounts offered


                                         49
Promotion


  XVII.    The discounts offers at VMM are usually tempting


XVIII. I am generally aware of all offers at VMM


                                             50
XIX. Rate your satisfaction regarding the clarity of signages carrying
      information about offers and discounts inside VMM on the scale of 1-10


XX. I come to VMM because I find advertisements of VMM effective


                                          51
XXI. Rate the following influencing factors on the scale of 1-5 which make you
      visit VMM


              a) Discount


              b) Ambience


                                         52
c) A good time pass destination


                 Time pass destination


60                           51
50                                          1
40                                          2
                                   23       3
30
                      16                    4
20
                6                           5
10                                      1
 0


     d) Self selection facility


                                  53
e) All items under one roof


                         All items under one roof

                                                 57
           60                                         51
                                                                          1
                                                                          2
           40
                                       25                                 3
           20                                                             4
                          4      6                                        5
             0


XXII. How would you rate the behavior of employees on the scale of 1-10


                                            54
Chi-square tests


  1)    To test whether more buying intention of customers (variable 1) has
        any relation with gender (variable 2)


        Step 1: State the null and alternative hypotheses.
                H0 : variable 1 is independent of variable 2
                Ha: variable 1 and variable 2 have a relationship


        Step 2: Significance level
                Significance level is 0.05 or 95% confidence level


        Step 3: Test criterion
                Applying Chi-square test


        Step 4: Computations


More Buying & Gender:-
Table 1

       Gender                Yes                  No                 Total
        Male                 50                   13                   63
       Female                39                   10                   49
        Total                89                   23                  112


                                        55
O                  E               (O-E)     (O-E)^2       (O-E)^2/E
  50             50.0625            -0.0625     3.9062         7.8027
  39             38..9375           0.0625      3.9062         1.0032
  13             12.9375            0.0625      3.9062         3.0193
  10             10.0625            -0.0625     3.9062         3.8819
 Total                                                        15.7076

Degree of freedom: (r-1)*(c-1)
                    = (2-1)*(2-1)
                    =1


        Step 5: Decision


               Chi (calculated): 15.7076
               Chi (tabulated) : 3.841


                   Since the calculated value is very much higher than the
tabulated value at 1 degree of freedom and 95% confidence level
therefore null hypothesis rejected i.e. more buying intention of customers
depends upon gender.


2)   To test whether more buying intention of customers (variable 1) has
     any relation with age (variable 2)


                                      56
Step 1: State the null and alternative hypotheses.
            H0 : variable 1 is independent of variable 2
            Ha: variable 1 and variable 2 have a relationship


    Step 2: Significance level
            Significance level is 0.05 or 95% confidence level


    Step 3: Test criterion
            Applying Chi-square test


    Step 4: Computations


More Buying &Age:-


    Age                  Yes                  No                  Total
     a                    6                    3                     9
     b                   40                   10                    50
      c                  44                    8                    52
    Total                90                   21                   111


      O                    E               (O-E)^2              (O-E)^2/E
       6                7.2973              1.6829                0.2306
      40               40.5405              02921                 0.0072
      44               42.1622              3.3775                0.0801
       3                1.7027              1.6829                09884
      10                9.4595              0.2921                0.0309
       8                9.8378              3.3775                0.3433


                                    57
Total                                                       1.6805

Degree of freedom: (r-1)*(c-1)
                    = (3-1)*(2-1)
                    =2


        Step 5: Decision


               Chi (calculated): 1.6805
               Chi (tabulated) : 5.991


                  Since the calculated value is much less than the tabulated
value at 2 degree of freedom and 95% confidence level therefore null
hypothesis accepted i.e. more buying intention of customers is
independent of age.


3)   To test whether unique shopping experience of customers (variable
     1) has any relation with gender (variable 2)


     Step 1: State the null and alternative hypotheses.
             H0 : variable 1 is independent of variable 2
             Ha: variable 1 and variable 2 have a relationship


     Step 2: Significance level


                                     58
Significance level is 0.05 or 95% confidence level


     Step 3: Test criterion
             Applying Chi-square test


     Step 4: Computations


Unique Shopping & Gender:-


    Gender                 Yes               No                   Total
     Male                   57                8                     65
    Female                  44                5                     49
     Total                 101               13                    114


     O                     E               (O-E)^2           (O-E)^2/E
     57                57.5877              0.3454            0.00599
     44                43.4123              0.3454            0.00796
      8                 7.4123              0.3454             0.0466
      5                 5.5877              0.3454             0.0618
    Total                                                      0.1224

  Degree of freedom: (r-1)*(c-1)
                    = (2-1)*(2-1)
                    =1


        Step 5: Decision


                                    59
Chi (calculated): 0.1224
              Chi (tabulated) : 3.8410


               Since the calculated value is less than the tabulated value at
1 degree of freedom and 95% confidence level therefore null hypothesis
accepted i.e. unique shopping experience of customers is independent of
gender.


4)   To test whether unique shopping experience of customers (variable
     1) has any relation with age (variable 2)


     Step 1: State the null and alternative hypotheses.
            H0 : variable 1 is independent of variable 2
            Ha: variable 1 and variable 2 have a relationship


     Step 2: Significance level
            Significance level is 0.05 or 95% confidence level


     Step 3: Test criterion


                                    60
Applying Chi-square test


     Step 4: Computations


Unique Shopping Experience & Age:-


     Age                   Yes            No        Total
      a                      6             2           8
      b                     46             7          53
       c                    49             4          53
     Total                 101            13         114


      O                   E             (O-E)^2   (O-E)^2/E
       6               7.0877            1.1831     0.1669
      46              46.9561            0.9141     0.0195
      49              46.9561            4.1775     0.0889
       2               0.9123            1.1813     1.2968
       7               6.0439            0.9141     0.1512
       4               6.0439            4.1775     0.6912
     Total                                          2.4145


  Degree of freedom: (r-1)*(c-1)
                   = (3-1)*(2-1)
                   =2


        Step 5: Decision


                                   61
Chi (calculated): 2.4145
              Chi (tabulated) : 5.991


                 Since the calculated value is much less than the tabulated
value at 2 degree of freedom and 95% confidence level therefore null
hypothesis accepted i.e. unique shopping experience of customers is
independent of age.


5)   To test whether customers of particular gender (variable 1) found the
     products of VMM trendy and of latest style (variable 2)


     Step 1: State the null and alternative hypotheses.
            H0 : variable 1 is independent of variable 2
            Ha: variable 1 and variable 2 have a relationship


     Step 2: Significance level
            Significance level is 0.05 or 95% confidence level


     Step 3: Test criterion
            Applying Chi-square test


     Step 4: Computations


                                    62
Gender            Yes                     No            Total
Male              44                      18            62
Female            24                      10            34
Total             68                      28            96


    O                E             (O-E)^2     (O-E)^2/E
    44           43.9167            6.9389       1.5800
    24           24.0833            6.9389       2.8812
    18           18.0833            6.9389       3.8549
    10            9.9167            6.9389       6.9389
   Total                                        15.2550


  Degree of freedom: (r-1)*(c-1)
                    = (2-1)*(2-1)
                    =1


         Step 5: Decision


               Chi (calculated): 15.255
               Chi (tabulated) : 3.8410


                  Since the calculated value is very much greater than the
  tabulated value at 1 degree of freedom and 95% confidence level


                                     63
therefore null hypothesis rejected i.e. opinion that the products at Vishal
  Mega Mart are trendy and of latest style depends upon gender.


  6)   To test whether customers of particular age group (variable 1) found
       the products of VMM trendy and of latest style (variable 2)


       Step 1: State the null and alternative hypotheses.
               H0 : variable 1 is independent of variable 2
               Ha: variable 1 and variable 2 have a relationship


       Step 2: Significance level
               Significance level is 0.05 or 95% confidence level


       Step 3: Test criterion
               Applying Chi-square test


Step 4: Computations
Table 2


       Age                  Yes                 No                  Total
        a                    4                    2                   6
        b                   29                  107                  39
         c                  34                   14                  48
       Total                67                   26                  93

                                       64
O                     E               (O-E)^2             (O-E)^2/E
    4                 4.3226              0.1041               0.0241
   29                28.0968              0.8158               0.0290
   34                34.5806              0.3371               9.7481
    2                 1.6774              0.1041               0.0620
   10                10.9032              0.8158               0.0748
   14                13.4194              0.3371               0.0251
  Total                                                        9.9631


Degree of freedom: (r-1)*(c-1)
                  = (3-1)*(2-1)
                  =2


      Step 5: Decision


             Chi (calculated): 9.9631
             Chi (tabulated) : 5.991


                    Since the calculated value is much greater than the
tabulated value at 2 degree of freedom and 95% confidence level
therefore null hypothesis rejected i.e. opinion that the products at Vishal
Mega Mart are trendy and of latest style depends upon age.


                                   65
7)    To test whether price (variable 1) has any relation with gender
        (variable 2)


        Step 1: State the null and alternative hypotheses.
                H0 : variable 1 is independent of variable 2
                Ha: variable 1 and variable 2 have a relationship


        Step 2: Significance level
                Significance level is 0.05 or 95% confidence level


        Step 3: Test criterion
                Applying Chi-square test


Step 4: Computations


       Gender                Yes                  No                  Total
        Male                 32                   25                    57
       Female                31                   13                    44
        Total                63                   38                   101


         O                    E                (O-E)^2              (O-E)^2/E
         32                35.5544             12.6337                0.3553


                                        66
31               27.4455              12.6344              0.3553
      25               21.4455              12.6344              0.5891
      13               16.5544              12.6337              0.7631
     Total                                                       2.0631

Degree of freedom: (r-1)*(c-1)
                    = (2-1)*(2-1)
                    =1


Step 5: Decision


               Chi (calculated): 2.0631
               Chi (tabulated) : 3.8410


                Since the calculated value is less than the tabulated value at
1 degree of freedom and 95% confidence level therefore null hypothesis
accepted i.e. price is independent of gender.


8)   To test whether price (variable 1) has any relation with 0 (variable)


                                     67
Step 1: State the null and alternative hypotheses.
             H0 : variable 1 is independent of variable 2
             Ha: variable 1 and variable 2 have a relationship


     Step 2: Significance level
             Significance level is 0.05 or 95% confidence level


     Step 3: Test criterion
             Applying Chi-square test


Step 4: Computations


     Age                  Yes                  No                  Total
      a                    3                    3                     6
      b                   30                   17                    47
       c                  30                   18                    48
     Total                63                   38                   101


      O                    E                (O-E)^2              (O-E)^2/E
      3                 3.7425               0.5513                0.1473

                                     68
30                 29.3168                 0.4667             0.1592
    3                  2.2574                0.55145             0.2442
   30                 29.9405                3.54025             0.1182
   17                 17.6831                 0.4666             0.0263
   18                 18.0594                 3.5283             1.9537
  Total                                                          2.6489


Degree of freedom: (r-1)*(c-1)
                  = (3-1)*(2-1)
                  =2


      Step 5: Decision


             Chi (calculated): 2.6489
             Chi (tabulated) : 5.991


              Since the calculated value is less than the tabulated value at
2 degree of freedom and 95% confidence level therefore null hypothesis
accepted i.e. price is independent of age.


            Rank Summary of different sections

Table 3


          Sections                                     Ratings
          Grocery                                       500
          Apparel                                       457
           Kids                                         462

                                   69
Footwear                357
          Household                490
          Restaurant               370
            Overall                457


 Rank summary of different promotional factors


Table 4


           Factors
       Discount                    487
       Ambience                    455
 Time pass Destination             486
     Self selection                562
  Item under one roof              574


                         70
Rank summary of different influencing factors

Table 5


             Factors
Rating of shopping                      975
satisfaction
Rating billing counter                  800
efficiency


                           71
Rating of lay out at VMM              805
Rating of product quality            1021
Rating of product variety             844
Rating of price satisfaction          825
Rating of clarity of signages         834
Rating of behavior of                1003
employees


                                72
Findings


Shopping behavior


     It has been found that majority of the respondents i.e. more than 56%
      people have started coming for shopping with their families after
      Vishal Mega Mart started its operations in Dehradun.
   More than 63% respondents agree that they buy more than planned
      when they buy from Vishal Mega Mart.
   After the application of Chi-square test it has been found that more
      buying intention of customers depends upon the gender and after
      considering table 1 we can easily infer that this tendency is more in
      males than in females.
   Further when we applied the same test to see whether more buying
      intention of customers varies with the age, it was found that more
      buying intention does not have any relation with the age.
     65% respondents are of the opinion that they have not stopped visiting
      the old shop they used to visit before Vishal Mega Mart came to
      Dehradun.


                                      73
Consumer perception and attitude towards VMM as a brand


     Nearly 71% respondents believe that Vishal Mega Mart offers a
      unique shopping experience.
   The application of Chi-square test suggests that all the respondents
      have a perception about unique shopping experience irrespective of
      gender i.e. unique shopping experience opinion, at Vishal Mega Mart
      does not depend whether a respondent is male or female.
     The application of Chi-square test suggests that all the respondents
      have a perception about unique shopping experience irrespective of
      age also i.e. unique shopping experience opinion, at Vishal Mega
      Mart does not depend on the age group of the respondents.
     Nearly 33% respondents have rated the shopping satisfaction level at
      Vishal Mega Mart as more than average.
     Only 26% respondents have rated efficiency of billing counters at
      Vishal Mega Mart as average.
     About 29% respondents believe that layout of Mega Mart is just
      average.
     Approximately 73% respondents said they will definitely come again
      to Vishal Mega Mart, only negligible minority refused to revisit
      Vishal Mega Mart.
     56% respondents have rated the grocery section of Vishal Mega Mart
      as outstanding.
     45% respondents believe the apparel section is just fair enough or
      average.
     43% respondents believe the kids section is just fair enough or
      average.

                                     74
   More than half of the respondents i.e. 51% have rated the foot wear
       section of Vishal Mega Mart as poor.
      Nearly 75% respondents believe that the house hold section of Vishal
       Mega Mart is above average.
      Nearly 68% respondents have rated the restaurant of Vishal Mega
       Mart to be below average.
      More than 61% respondents have rated the Vishal Mega Mart on
       overall basis to be average.
Table 3 clearly shows the rank wise likeliness of the following sections:


   1. Grocery
   2. Households
   3. Kids
   4. Apparel, Overall
   5. Restaurant
   6. Footwear


                                      75
Perception about Products and Services


        More than 43% respondents have rated the quality of products at
         Vishal Mega Mart to be good enough.
        38% respondents have rated the product variety available at Vishal
         Mega Mart to be above average.
        Nearly 48% respondents agree that the products offered at Vishal
         Mega Mart are trendy and of latest style. Only 20% respondents
         believe them not to be trendy and of latest style while the rest kept
         num to the question.
      Further the Chi-square test suggests that the opinion that the
         products at Vishal Mega Mart are trendy and of latest style does
         depend upon gender.
      The Chi-square test is also indicating a relationship between age
         and opinion that the products at Vishal Mega Mart are trendy and
         of latest style. Further the table 2 shows that respondents with
         higher the age perceived the products more trendy and of latest
         style.
      Majority of the respondents agree that the visual merchandising
         techniques practiced by Vishal Mega Mart make them buy more
         than what they initially plan.


                                      76
Price


        45% believe that keeping the quality of products in mind, most of
         the products at Vishal Mega Mart are expensive. Only 26%
         respondents believe them to be inexpensive while rest belongs to
         neither of the view.
        The application of Chi-square test shows no relation between
         perception about price and gender i.e. male and female perceives
         the price similarly.
      Similarly Chi-square test shows no relation between perception
         about price and age group i.e. members of all the age group
         perceive the price similarly.
      32% respondents have rated the price satisfaction level of products
         at Vishal Mega Mart to be above average.
      Majority of the respondents (55%) visit Vishal Mega Mart because
         of less price or discounts offered.


Promotion


      Nearly 43% respondents believe the discounts offered at Vishal
         Mega Mart to be tempting.
      37% respondents believe that they are generally aware of all offers
         at Vishal Mega Mart whereas nearly equal number of respondents
         i.e.38% believe that they are not aware of the offers at Vishal
         Mega Mart.


                                         77
 Nearly 50% of the people have appreciated clarity of signages at
           Vishal Mega Mart.
          Only 36% respondents come to Vishal Mega Mart because they
           find advertisements of Vishal Mega Mart effective.32%
           respondents do not find the advertisement effective enough and thr
           rest are of no opinion.
       Most of the respondents (51%) visit Vishal Mega Mart because of
           discounts offered.
       36% respondents have rated ambience of Vishal Mega Mart as
           above average whereas 25% have rated it to be below average, and
           the rest are of no opinion.
           36% respondents have rated Vishal Mega Mart as an average time
           pass destination.
       Nearly half of the respondents i.e. 48% have rated the self
           selection facility at Vishal Mega Mart as good enough.
       75% respondents visit Vishal Mega Mart because they find all
           items under one roof.
          Majority of the respondents have rated the behavior of the
           employees of Vishal Mega Mart to be good enough.


Table 4 clearly shows the rank wise likeliness of the following influencing
factors:
      1.   All items under one roof
      2. Self selection facility
      3. Discount
      4. A good time pass destination


                                         78
5. Ambience


Table 5 clearly shows the rank wise likeliness of the following factors:


    1. Product Quality
    2. Behavior of Employees
    3. Shopping satisfaction
    4. Product variety
    5. Clarity of signages
    6. Price satisfaction
    7. Layout of Vishal Mega Mart
    8. Billing counter efficiency


                                     79
80
Limitations

1) Many of the people were reluctant to give the information about their
income expenditure and age.
2) The Questionnaire was too lengthy and became time consuming.
3) The length of the questionnaire added to the cost constraint also
4) The sample size of the report is too small because of the time, costs and
accessibility constraints.
5) Respondents were not aware of all the sections of the store.
6) Some of the respondents were not literate enough to fill up the
questionnaire by themselves and thus needed to be guided. This became time
consuming.
7) Faced a bit of difficulty in getting permission from Vishal Mega Mart


                                      81
Conclusion


Vishal Mega Mart has only recently started its operations in Dehradun and
one of the most prominent effects of its showroom is that people have
started coming for shopping with their families now. People do feel unique
shopping experience when they shop at Vishal Mega Mart. One strong point
of the store is that the ways products are displayed make people buy more
than what they plan initially i.e. visual merchandising techniques are
effectively followed to certain extent but these are not being followed
extensively as people have rated ambience and layout to be poor. Sections
most popular among customers are grocery and household but customers
complain of not much discount being offered in these sections. One of the
reasons that people come to Vishal Mega Mart is that they find all items
under one roof. The other factors that attract customers most are discounts
and self selection facility.


          Presently the store is enjoying the benefits of monopoly as it is the
only organized general merchandising store in Dehradun though there are
more than one organized food retailers like Mc Donalds, Pizza Hut and
Narula’s operating in the city. But in the time to come many big players like
Big Bazaar, Reliance etc. are also planning to enter Dehradun. Thus the store
should recognize and improve upon its weak areas. One of its weak areas is
long waiting time at the billing counters. Further people have rated the
advertisement to be ineffective, inefficient and insufficient. The store should
also try and improve upon its quality and reduce costs as most of the people


                                      82
are of the view that keeping the quality in mind the products offered at
Vishal Mega Mart are expensive. It is not attracting footfalls as a good time
pass destination.
       On overall basis people find Vishal Mega Mart as average.


                                     83
Recommendations


1. The study reveals that usually males buy more than what they plan
     initially. Thus the store should maintain visual merchandising
     techniques in the men section and improve the same in the sections
     related to women.
2.   People find the waiting time in the que of the billing counters long, so
     the store should try and increase the number of billing counters.
     Further the employees training can increase the efficiency and
     decrease the waiting time.
3. There is vast scope of improvement in the layout of the store.
4. The sections that need attention are footwear, apparel and restaurant
5.   The study reveals that people who belong to high age group find the
     products of the store to be trendy and of latest style but the younger
     generation does not hold the same opinion. So the store should
     concentrate more on products related to younger generation.
6. Most of the people visit the store because of the discounts offered and
     the store should try and make them more attractive.
7. Further people feel that there is not much discount offered in the
     grocery section which is the most popular section. The store should
     try and increase the discount in this particular section then only it will
     be able to operate successfully in the competitive time to come.
8.   People are generally unaware of offers at Vishal Mega Mart because
     of poor advertising and promotional strategies. It should increase the
     number of adds in the print media and should also give adds in the
     local electronic media.


                                     84
9. Clarity of signages can be improved by increasing the number of
      signages and making them attractive.
10. No. of footfalls can be increased by improving upon the ambience
      and the restaurant.
11.   Till date Vishal Mega Mart is the only player in organized general
      merchandising in Dehradun and thus is enjoying the benefits of
      monopoly. In the absence of competition people are finding it fair
      enough because there is no other such store so far with which its
      performance can be compared. But in the time to come many big
      players like Big Bazaar, Reliance etc. are also planning to enter
      Dehradun. Thus it should recognize and improve upon its weak areas
      and convert its strong areas into strategic advantage.


                                      85
References


1. Retail management by Chetan Bajaj.
2. Marketing Management by Philip Kotler.
3. Economic survey 2005-2006 by govt. of India.
4. Marketing research by Malhotra
5. Ministry of Agriculture Annual Report 2005-06
6.   www.mpmandiboard.com
7.   www.pantaloon.com
8.   www.rpggroup.com
9. www.ficci.com
10. www.retailbiz.com
11. www.fciweb.nic.in
12. http://fcamin.nic.in
13. www.indiatimes.com
14. www.mckinseyquarterly.com
15. www.atkearney.com
16. www.retailyatra.com


                                86
Appendix
Objective: To study the impact of Vishal Mega Mart on Buying behavior of customers in Dehradun
City *


                                                  Questionnaire

Name ………………………………                                                          Age: ……….

Address……………………………………………                                          Contact no.…………………………
       ….………………………………………...

Gender ………..                                          Occupation ……………………….


Monthly Income (in Rs.)
a. < 5000       b. 5000-10000                         c. 10000-20000 d. 20000-30000 e. > 30000

Total Monthly expenditure on shopping

a.< 1000b. 1000-2000                      c.2000-3000                      d. 3000-5000                e. >5000

Shopping Behavior

1) I have started coming for shopping with my family now

a) Strongly agree        b) Agree     c). Neither agree nor disagree            d) Disagree   e) Strongly Disagree

2) When I buy from VMM, I buy more than what I plan
a) Strongly agree b) Agree c). Neither agree nor disagree                       d) Disagree   e) Strongly Disagree

3) I have stopped visiting the old shop I used to visit
a) Strongly agree b) Agree c). Neither agree nor disagree                       d) Disagree   e) Strongly Disagree

Consumer perception & attitude towards VMM as a brand

4) Vishal Mega Mart offers a unique shopping experience

a) Strongly agree        b) Agree     c). Neither agree nor disagree            d) Disagree   e) Strongly Disagree

5) Rate your shopping satisfaction level at VMM on the scale of 1-10
 1       2       3        4       5       6       7       8        9       10
6) Rate efficiency at billing counters of VMM on the scale of 1-10

 1       2       3        4       5       6       7       8        9       10

7) Rate layout of VMM on the scale of 1-10


 1       2       3        4       5       6       7       8        9       10


                                                              87

     1       2       3        4       5       6       7       8        9        10
8) I will definitely come again to VMM for shopping

a) Strongly agree   b) Agree       c). Neither agree nor disagree   d) Disagree      e) Strongly Disagree

9) Rate following sections of Vishal Mega Mart on a scale of 1 to 5 (1 being poor and 5 being Outstanding)

        a. Grocery/                1      2      3        4   5         b. Apparel           1      2       3   4   5
           Canned food

        c. Kids                    1      2      3        4   5         d. Foot wear
                                                                                             1      2       3   4   5
        e. House hold                                         g.        f. Others            1      2       3   4   5
                                   1      2      3        4   5
        h. Restaurant              1      2      3        4   5         i. Overall           1      2       3   4   5

Perception about Products and services

10) Rate quality of products at VMM on the scale of 1-10
 1      2      3      4     5      6      7      8        9   10
11)Rate product variety at VMM on the scale of 1-10
 1      2      3      4     5      6      7      8        9   10

12) Products offered at Vishal MM are trendy and of latest style

a) Strongly agree   b) Agree           c). Neither agree nor disagree   d) Disagree     e) Strongly Disagree


13) The way products are displayed makes me buy more than what I plan

a) Strongly agree   b) Agree           c). Neither agree nor disagree   d) Disagree     e) Strongly Disagree

Price
14) Keeping the quality of products in mind, most of products at VMM are expensive

a) Strongly agree   b) Agree           c). Neither agree nor disagree   d) Disagree     e) Strongly Disagree

15) Rate your satisfaction level regarding prices of products at VMM on the scale of 1-10

 1      2      3      4     5      6      7      8        9   10

16) I visit VMM because of less price or discounts offered

a) Strongly agree   b) Agree           c). Neither agree nor disagree   d) Disagree     e) Strongly Disagree


17) I generally buy those items which are offered with discounts

a) Strongly agree   b) Agree           c). Neither agree nor disagree   d) Disagree     e) Strongly Disagree


                                                     88
Promotions

18) The discount offers at VMM are usually tempting
a) Strongly agree b) Agree           c). Neither agree nor disagree          d) Disagree   e) Strongly Disagree

19) I am generally aware of all offers at VMM
a) Strongly agree b) Agree              c). Neither agree nor disagree       d) Disagree   e) Strongly Disagree

 20) Rate your satisfaction level regarding the clarity of signages carrying information about offers and
discounts inside VMM
 1      2      3       4     5        6    7      8        9   10

21) I come to VMM because I find advertisements of VMM effective
a) Strongly agree b) Agree         c). Neither agree nor disagree d) Disagree              e) Strongly Disagree


22) Rate the following influencing factors on the scale of 1 to 5 (1 being least influential & 5 being
most influential) which make you visit Vishal Mega Mart?


         b. Discount                                       1   2         3      4      5


         d. Ambience                                           1         2      3      4      5
         e. A good time pass destination                       1         2      3      4      5


         g. Self selection Facility                            1         2      3      4      5


         e. All items under one roof                           1         2      3      4      5


23) How would you rate the behavior of employees on the scale of 1-10

 1      2      3       4     5        6    7      8        9   10


                                                      89

Weitere ähnliche Inhalte

Was ist angesagt?

Retail project
Retail projectRetail project
Retail projectAkash Rana
 
Prospects and challenges of retail sector in india copy
Prospects and challenges of retail sector in india   copyProspects and challenges of retail sector in india   copy
Prospects and challenges of retail sector in india copyPreeti Gulati
 
An Insight inti Retail Management
An Insight inti Retail ManagementAn Insight inti Retail Management
An Insight inti Retail ManagementRuchikaChandna2
 
Evolution,Drivers Of Indian Retail
Evolution,Drivers Of Indian RetailEvolution,Drivers Of Indian Retail
Evolution,Drivers Of Indian Retailitsvineeth209
 
Retail Sector In India
Retail Sector In IndiaRetail Sector In India
Retail Sector In Indiapurval
 
AN EMPIRICAL STUDY ON ORGANIZED RETAIL OUTLET AND CONSUMER PERCEPTION TOWARDS...
AN EMPIRICAL STUDY ON ORGANIZED RETAIL OUTLET AND CONSUMER PERCEPTION TOWARDS...AN EMPIRICAL STUDY ON ORGANIZED RETAIL OUTLET AND CONSUMER PERCEPTION TOWARDS...
AN EMPIRICAL STUDY ON ORGANIZED RETAIL OUTLET AND CONSUMER PERCEPTION TOWARDS...IAEME Publication
 
Retail sector in India
Retail sector in IndiaRetail sector in India
Retail sector in Indiasujit kumar
 
A project report on consumer preference towards organized and unorganized ret...
A project report on consumer preference towards organized and unorganized ret...A project report on consumer preference towards organized and unorganized ret...
A project report on consumer preference towards organized and unorganized ret...Projects Kart
 
Retail In India
Retail In IndiaRetail In India
Retail In IndiaRS Khurana
 
Indian Retail Sector
Indian Retail SectorIndian Retail Sector
Indian Retail Sectoritsvineeth209
 
33 current scenario in retail marketing with special reference to organised r...
33 current scenario in retail marketing with special reference to organised r...33 current scenario in retail marketing with special reference to organised r...
33 current scenario in retail marketing with special reference to organised r...chelliah paramasivan
 

Was ist angesagt? (18)

Indian retail market, ayu
Indian retail market, ayuIndian retail market, ayu
Indian retail market, ayu
 
Retail
RetailRetail
Retail
 
Retail project
Retail projectRetail project
Retail project
 
Retail industry ppt
Retail industry pptRetail industry ppt
Retail industry ppt
 
Prospects and challenges of retail sector in india copy
Prospects and challenges of retail sector in india   copyProspects and challenges of retail sector in india   copy
Prospects and challenges of retail sector in india copy
 
19535997 retail
19535997 retail19535997 retail
19535997 retail
 
An Insight inti Retail Management
An Insight inti Retail ManagementAn Insight inti Retail Management
An Insight inti Retail Management
 
Evolution,Drivers Of Indian Retail
Evolution,Drivers Of Indian RetailEvolution,Drivers Of Indian Retail
Evolution,Drivers Of Indian Retail
 
organised retails
organised retailsorganised retails
organised retails
 
Retail
RetailRetail
Retail
 
Retail Sector In India
Retail Sector In IndiaRetail Sector In India
Retail Sector In India
 
AN EMPIRICAL STUDY ON ORGANIZED RETAIL OUTLET AND CONSUMER PERCEPTION TOWARDS...
AN EMPIRICAL STUDY ON ORGANIZED RETAIL OUTLET AND CONSUMER PERCEPTION TOWARDS...AN EMPIRICAL STUDY ON ORGANIZED RETAIL OUTLET AND CONSUMER PERCEPTION TOWARDS...
AN EMPIRICAL STUDY ON ORGANIZED RETAIL OUTLET AND CONSUMER PERCEPTION TOWARDS...
 
Retail sector in India
Retail sector in IndiaRetail sector in India
Retail sector in India
 
Evolution of retail in india
Evolution of retail in indiaEvolution of retail in india
Evolution of retail in india
 
A project report on consumer preference towards organized and unorganized ret...
A project report on consumer preference towards organized and unorganized ret...A project report on consumer preference towards organized and unorganized ret...
A project report on consumer preference towards organized and unorganized ret...
 
Retail In India
Retail In IndiaRetail In India
Retail In India
 
Indian Retail Sector
Indian Retail SectorIndian Retail Sector
Indian Retail Sector
 
33 current scenario in retail marketing with special reference to organised r...
33 current scenario in retail marketing with special reference to organised r...33 current scenario in retail marketing with special reference to organised r...
33 current scenario in retail marketing with special reference to organised r...
 

Ähnlich wie Ravi project

Indian retail scenario
Indian retail scenarioIndian retail scenario
Indian retail scenarioIsha Patel
 
Situation Analysis Of Retail Industry In India
Situation Analysis Of Retail Industry In IndiaSituation Analysis Of Retail Industry In India
Situation Analysis Of Retail Industry In IndiaKumar Rama Shankar
 
Indian retail industry 2004-05
Indian retail industry 2004-05Indian retail industry 2004-05
Indian retail industry 2004-05mohithjh
 
A research project report on comparative study of vishal megamart and its com...
A research project report on comparative study of vishal megamart and its com...A research project report on comparative study of vishal megamart and its com...
A research project report on comparative study of vishal megamart and its com...Projects Kart
 
Report -The Viability Of Liverpool Retail India Ltd
Report -The Viability Of Liverpool Retail India LtdReport -The Viability Of Liverpool Retail India Ltd
Report -The Viability Of Liverpool Retail India LtdNikita Sanghvi
 
Session 11 leb simple final
Session 11 leb simple finalSession 11 leb simple final
Session 11 leb simple finalDelwin Arikatt
 
A project report on customer feedback at big bazaar
A project report on customer feedback at big bazaarA project report on customer feedback at big bazaar
A project report on customer feedback at big bazaarProjects Kart
 
Current scenario in retail marketing with special reference to organised reta...
Current scenario in retail marketing with special reference to organised reta...Current scenario in retail marketing with special reference to organised reta...
Current scenario in retail marketing with special reference to organised reta...RAVICHANDIRANG
 
Stretagic analysis of retail industry
Stretagic analysis of retail industryStretagic analysis of retail industry
Stretagic analysis of retail industryrahul chaudhari
 
146911 633694115995883750 (2)
146911 633694115995883750 (2)146911 633694115995883750 (2)
146911 633694115995883750 (2)tausifurreza
 
Greporttheindianretailsector 100223025247-phpapp01
Greporttheindianretailsector 100223025247-phpapp01Greporttheindianretailsector 100223025247-phpapp01
Greporttheindianretailsector 100223025247-phpapp01Revathi R
 
Research project report sumit b
Research project report sumit bResearch project report sumit b
Research project report sumit bsumit saxena
 
Project report on retail marketing in india
Project report on retail marketing in indiaProject report on retail marketing in india
Project report on retail marketing in indiaGaurav Tyagi
 

Ähnlich wie Ravi project (20)

Indian retail scenario
Indian retail scenarioIndian retail scenario
Indian retail scenario
 
Situation Analysis Of Retail Industry In India
Situation Analysis Of Retail Industry In IndiaSituation Analysis Of Retail Industry In India
Situation Analysis Of Retail Industry In India
 
Shopping
ShoppingShopping
Shopping
 
Retail Mgmt
Retail MgmtRetail Mgmt
Retail Mgmt
 
Indian retail industry 2004-05
Indian retail industry 2004-05Indian retail industry 2004-05
Indian retail industry 2004-05
 
BIG BAZAR
BIG BAZARBIG BAZAR
BIG BAZAR
 
Private sip business plan
Private sip   business planPrivate sip   business plan
Private sip business plan
 
A research project report on comparative study of vishal megamart and its com...
A research project report on comparative study of vishal megamart and its com...A research project report on comparative study of vishal megamart and its com...
A research project report on comparative study of vishal megamart and its com...
 
Report -The Viability Of Liverpool Retail India Ltd
Report -The Viability Of Liverpool Retail India LtdReport -The Viability Of Liverpool Retail India Ltd
Report -The Viability Of Liverpool Retail India Ltd
 
Session 11 leb simple final
Session 11 leb simple finalSession 11 leb simple final
Session 11 leb simple final
 
A project report on customer feedback at big bazaar
A project report on customer feedback at big bazaarA project report on customer feedback at big bazaar
A project report on customer feedback at big bazaar
 
Current scenario in retail marketing with special reference to organised reta...
Current scenario in retail marketing with special reference to organised reta...Current scenario in retail marketing with special reference to organised reta...
Current scenario in retail marketing with special reference to organised reta...
 
Stretagic analysis of retail industry
Stretagic analysis of retail industryStretagic analysis of retail industry
Stretagic analysis of retail industry
 
Big bazaar: SCM
Big bazaar: SCMBig bazaar: SCM
Big bazaar: SCM
 
stp on future group
stp on future groupstp on future group
stp on future group
 
146911 633694115995883750 (2)
146911 633694115995883750 (2)146911 633694115995883750 (2)
146911 633694115995883750 (2)
 
Retail Industry
Retail IndustryRetail Industry
Retail Industry
 
Greporttheindianretailsector 100223025247-phpapp01
Greporttheindianretailsector 100223025247-phpapp01Greporttheindianretailsector 100223025247-phpapp01
Greporttheindianretailsector 100223025247-phpapp01
 
Research project report sumit b
Research project report sumit bResearch project report sumit b
Research project report sumit b
 
Project report on retail marketing in india
Project report on retail marketing in indiaProject report on retail marketing in india
Project report on retail marketing in india
 

Kürzlich hochgeladen

Enhancing and Restoring Safety & Quality Cultures - Dave Litwiller - May 2024...
Enhancing and Restoring Safety & Quality Cultures - Dave Litwiller - May 2024...Enhancing and Restoring Safety & Quality Cultures - Dave Litwiller - May 2024...
Enhancing and Restoring Safety & Quality Cultures - Dave Litwiller - May 2024...Dave Litwiller
 
Organizational Transformation Lead with Culture
Organizational Transformation Lead with CultureOrganizational Transformation Lead with Culture
Organizational Transformation Lead with CultureSeta Wicaksana
 
FULL ENJOY Call Girls In Mahipalpur Delhi Contact Us 8377877756
FULL ENJOY Call Girls In Mahipalpur Delhi Contact Us 8377877756FULL ENJOY Call Girls In Mahipalpur Delhi Contact Us 8377877756
FULL ENJOY Call Girls In Mahipalpur Delhi Contact Us 8377877756dollysharma2066
 
B.COM Unit – 4 ( CORPORATE SOCIAL RESPONSIBILITY ( CSR ).pptx
B.COM Unit – 4 ( CORPORATE SOCIAL RESPONSIBILITY ( CSR ).pptxB.COM Unit – 4 ( CORPORATE SOCIAL RESPONSIBILITY ( CSR ).pptx
B.COM Unit – 4 ( CORPORATE SOCIAL RESPONSIBILITY ( CSR ).pptxpriyanshujha201
 
MONA 98765-12871 CALL GIRLS IN LUDHIANA LUDHIANA CALL GIRL
MONA 98765-12871 CALL GIRLS IN LUDHIANA LUDHIANA CALL GIRLMONA 98765-12871 CALL GIRLS IN LUDHIANA LUDHIANA CALL GIRL
MONA 98765-12871 CALL GIRLS IN LUDHIANA LUDHIANA CALL GIRLSeo
 
VIP Call Girls In Saharaganj ( Lucknow ) 🔝 8923113531 🔝 Cash Payment (COD) 👒
VIP Call Girls In Saharaganj ( Lucknow  ) 🔝 8923113531 🔝  Cash Payment (COD) 👒VIP Call Girls In Saharaganj ( Lucknow  ) 🔝 8923113531 🔝  Cash Payment (COD) 👒
VIP Call Girls In Saharaganj ( Lucknow ) 🔝 8923113531 🔝 Cash Payment (COD) 👒anilsa9823
 
Ensure the security of your HCL environment by applying the Zero Trust princi...
Ensure the security of your HCL environment by applying the Zero Trust princi...Ensure the security of your HCL environment by applying the Zero Trust princi...
Ensure the security of your HCL environment by applying the Zero Trust princi...Roland Driesen
 
Call Girls Hebbal Just Call 👗 7737669865 👗 Top Class Call Girl Service Bangalore
Call Girls Hebbal Just Call 👗 7737669865 👗 Top Class Call Girl Service BangaloreCall Girls Hebbal Just Call 👗 7737669865 👗 Top Class Call Girl Service Bangalore
Call Girls Hebbal Just Call 👗 7737669865 👗 Top Class Call Girl Service Bangaloreamitlee9823
 
Call Girls In Panjim North Goa 9971646499 Genuine Service
Call Girls In Panjim North Goa 9971646499 Genuine ServiceCall Girls In Panjim North Goa 9971646499 Genuine Service
Call Girls In Panjim North Goa 9971646499 Genuine Serviceritikaroy0888
 
Call Girls Pune Just Call 9907093804 Top Class Call Girl Service Available
Call Girls Pune Just Call 9907093804 Top Class Call Girl Service AvailableCall Girls Pune Just Call 9907093804 Top Class Call Girl Service Available
Call Girls Pune Just Call 9907093804 Top Class Call Girl Service AvailableDipal Arora
 
Grateful 7 speech thanking everyone that has helped.pdf
Grateful 7 speech thanking everyone that has helped.pdfGrateful 7 speech thanking everyone that has helped.pdf
Grateful 7 speech thanking everyone that has helped.pdfPaul Menig
 
Insurers' journeys to build a mastery in the IoT usage
Insurers' journeys to build a mastery in the IoT usageInsurers' journeys to build a mastery in the IoT usage
Insurers' journeys to build a mastery in the IoT usageMatteo Carbone
 
HONOR Veterans Event Keynote by Michael Hawkins
HONOR Veterans Event Keynote by Michael HawkinsHONOR Veterans Event Keynote by Michael Hawkins
HONOR Veterans Event Keynote by Michael HawkinsMichael W. Hawkins
 
It will be International Nurses' Day on 12 May
It will be International Nurses' Day on 12 MayIt will be International Nurses' Day on 12 May
It will be International Nurses' Day on 12 MayNZSG
 
7.pdf This presentation captures many uses and the significance of the number...
7.pdf This presentation captures many uses and the significance of the number...7.pdf This presentation captures many uses and the significance of the number...
7.pdf This presentation captures many uses and the significance of the number...Paul Menig
 
M.C Lodges -- Guest House in Jhang.
M.C Lodges --  Guest House in Jhang.M.C Lodges --  Guest House in Jhang.
M.C Lodges -- Guest House in Jhang.Aaiza Hassan
 
John Halpern sued for sexual assault.pdf
John Halpern sued for sexual assault.pdfJohn Halpern sued for sexual assault.pdf
John Halpern sued for sexual assault.pdfAmzadHosen3
 
Dr. Admir Softic_ presentation_Green Club_ENG.pdf
Dr. Admir Softic_ presentation_Green Club_ENG.pdfDr. Admir Softic_ presentation_Green Club_ENG.pdf
Dr. Admir Softic_ presentation_Green Club_ENG.pdfAdmir Softic
 

Kürzlich hochgeladen (20)

Enhancing and Restoring Safety & Quality Cultures - Dave Litwiller - May 2024...
Enhancing and Restoring Safety & Quality Cultures - Dave Litwiller - May 2024...Enhancing and Restoring Safety & Quality Cultures - Dave Litwiller - May 2024...
Enhancing and Restoring Safety & Quality Cultures - Dave Litwiller - May 2024...
 
Organizational Transformation Lead with Culture
Organizational Transformation Lead with CultureOrganizational Transformation Lead with Culture
Organizational Transformation Lead with Culture
 
FULL ENJOY Call Girls In Mahipalpur Delhi Contact Us 8377877756
FULL ENJOY Call Girls In Mahipalpur Delhi Contact Us 8377877756FULL ENJOY Call Girls In Mahipalpur Delhi Contact Us 8377877756
FULL ENJOY Call Girls In Mahipalpur Delhi Contact Us 8377877756
 
B.COM Unit – 4 ( CORPORATE SOCIAL RESPONSIBILITY ( CSR ).pptx
B.COM Unit – 4 ( CORPORATE SOCIAL RESPONSIBILITY ( CSR ).pptxB.COM Unit – 4 ( CORPORATE SOCIAL RESPONSIBILITY ( CSR ).pptx
B.COM Unit – 4 ( CORPORATE SOCIAL RESPONSIBILITY ( CSR ).pptx
 
MONA 98765-12871 CALL GIRLS IN LUDHIANA LUDHIANA CALL GIRL
MONA 98765-12871 CALL GIRLS IN LUDHIANA LUDHIANA CALL GIRLMONA 98765-12871 CALL GIRLS IN LUDHIANA LUDHIANA CALL GIRL
MONA 98765-12871 CALL GIRLS IN LUDHIANA LUDHIANA CALL GIRL
 
VIP Call Girls In Saharaganj ( Lucknow ) 🔝 8923113531 🔝 Cash Payment (COD) 👒
VIP Call Girls In Saharaganj ( Lucknow  ) 🔝 8923113531 🔝  Cash Payment (COD) 👒VIP Call Girls In Saharaganj ( Lucknow  ) 🔝 8923113531 🔝  Cash Payment (COD) 👒
VIP Call Girls In Saharaganj ( Lucknow ) 🔝 8923113531 🔝 Cash Payment (COD) 👒
 
Ensure the security of your HCL environment by applying the Zero Trust princi...
Ensure the security of your HCL environment by applying the Zero Trust princi...Ensure the security of your HCL environment by applying the Zero Trust princi...
Ensure the security of your HCL environment by applying the Zero Trust princi...
 
unwanted pregnancy Kit [+918133066128] Abortion Pills IN Dubai UAE Abudhabi
unwanted pregnancy Kit [+918133066128] Abortion Pills IN Dubai UAE Abudhabiunwanted pregnancy Kit [+918133066128] Abortion Pills IN Dubai UAE Abudhabi
unwanted pregnancy Kit [+918133066128] Abortion Pills IN Dubai UAE Abudhabi
 
Call Girls Hebbal Just Call 👗 7737669865 👗 Top Class Call Girl Service Bangalore
Call Girls Hebbal Just Call 👗 7737669865 👗 Top Class Call Girl Service BangaloreCall Girls Hebbal Just Call 👗 7737669865 👗 Top Class Call Girl Service Bangalore
Call Girls Hebbal Just Call 👗 7737669865 👗 Top Class Call Girl Service Bangalore
 
Call Girls In Panjim North Goa 9971646499 Genuine Service
Call Girls In Panjim North Goa 9971646499 Genuine ServiceCall Girls In Panjim North Goa 9971646499 Genuine Service
Call Girls In Panjim North Goa 9971646499 Genuine Service
 
Call Girls Pune Just Call 9907093804 Top Class Call Girl Service Available
Call Girls Pune Just Call 9907093804 Top Class Call Girl Service AvailableCall Girls Pune Just Call 9907093804 Top Class Call Girl Service Available
Call Girls Pune Just Call 9907093804 Top Class Call Girl Service Available
 
Grateful 7 speech thanking everyone that has helped.pdf
Grateful 7 speech thanking everyone that has helped.pdfGrateful 7 speech thanking everyone that has helped.pdf
Grateful 7 speech thanking everyone that has helped.pdf
 
Insurers' journeys to build a mastery in the IoT usage
Insurers' journeys to build a mastery in the IoT usageInsurers' journeys to build a mastery in the IoT usage
Insurers' journeys to build a mastery in the IoT usage
 
HONOR Veterans Event Keynote by Michael Hawkins
HONOR Veterans Event Keynote by Michael HawkinsHONOR Veterans Event Keynote by Michael Hawkins
HONOR Veterans Event Keynote by Michael Hawkins
 
It will be International Nurses' Day on 12 May
It will be International Nurses' Day on 12 MayIt will be International Nurses' Day on 12 May
It will be International Nurses' Day on 12 May
 
Forklift Operations: Safety through Cartoons
Forklift Operations: Safety through CartoonsForklift Operations: Safety through Cartoons
Forklift Operations: Safety through Cartoons
 
7.pdf This presentation captures many uses and the significance of the number...
7.pdf This presentation captures many uses and the significance of the number...7.pdf This presentation captures many uses and the significance of the number...
7.pdf This presentation captures many uses and the significance of the number...
 
M.C Lodges -- Guest House in Jhang.
M.C Lodges --  Guest House in Jhang.M.C Lodges --  Guest House in Jhang.
M.C Lodges -- Guest House in Jhang.
 
John Halpern sued for sexual assault.pdf
John Halpern sued for sexual assault.pdfJohn Halpern sued for sexual assault.pdf
John Halpern sued for sexual assault.pdf
 
Dr. Admir Softic_ presentation_Green Club_ENG.pdf
Dr. Admir Softic_ presentation_Green Club_ENG.pdfDr. Admir Softic_ presentation_Green Club_ENG.pdf
Dr. Admir Softic_ presentation_Green Club_ENG.pdf
 

Ravi project

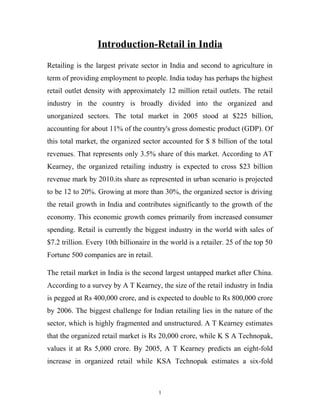
  • 1. Introduction-Retail in India Retailing is the largest private sector in India and second to agriculture in term of providing employment to people. India today has perhaps the highest retail outlet density with approximately 12 million retail outlets. The retail industry in the country is broadly divided into the organized and unorganized sectors. The total market in 2005 stood at $225 billion, accounting for about 11% of the country's gross domestic product (GDP). Of this total market, the organized sector accounted for $ 8 billion of the total revenues. That represents only 3.5% share of this market. According to AT Kearney, the organized retailing industry is expected to cross $23 billion revenue mark by 2010.its share as represented in urban scenario is projected to be 12 to 20%. Growing at more than 30%, the organized sector is driving the retail growth in India and contributes significantly to the growth of the economy. This economic growth comes primarily from increased consumer spending. Retail is currently the biggest industry in the world with sales of $7.2 trillion. Every 10th billionaire in the world is a retailer. 25 of the top 50 Fortune 500 companies are in retail. The retail market in India is the second largest untapped market after China. According to a survey by A T Kearney, the size of the retail industry in India is pegged at Rs 400,000 crore, and is expected to double to Rs 800,000 crore by 2006. The biggest challenge for Indian retailing lies in the nature of the sector, which is highly fragmented and unstructured. A T Kearney estimates that the organized retail market is Rs 20,000 crore, while K S A Technopak, values it at Rs 5,000 crore. By 2005, A T Kearney predicts an eight-fold increase in organized retail while KSA Technopak estimates a six-fold 1
  • 2. growth. The difference in these projections is attributed to their divergent definitions of ‘organized retailing’. While India’s retailing format has hitherto been basic at best, change is in the air. Over the past few years, there has been a proliferation of organized sector players entering or expanding their presence in the retail market. A number of large business groups such as Tata, RPG, Rahejas and Piramal have set up malls and built businesses within retail. This includes the Rs 190 crore (McKinsey estimate) FoodWorld, India’s leading supermarket chain. Other supermarket chains like Trinetra, Nilgiris, Apna Bazar and Subhiksha are rapidly establishing themselves. 2
  • 3. Dia. 3.1 Organized Retail In India The apparel sector has seen the emergence of stores like Pantaloons apart from company owned exclusive stores. Names like Shopper’s Stop, Lifestyle, Westside etc., have gained prominence in the lifestyle and fashion segments, and chains like Archies, Musicworld and Crossword cater to the books and music market. Even sectors like consumer durables have seen the emergence of organized retailers like Viveks (in Chennai) and JainsonsUrban markets are more attractive given the higher disposable incomes of the urban population. The increasing attractiveness of the sector is raising interest from a number of global retailers. McKinsey predicts that global companies such as Tesco, Kingfisher, Metro, Carrefour, and Ahold are exploring entry options, even as names like Benetton and Lifestyle have already built a presence in India. Even though the retail sector in India has been growing rapidly, there is still a long way to go. Firstly, organized retailers face steep regulatory and infrastructural barriers. Real estate access is complicated and complex, as is the tax system. In addition, the competition from the unorganized sector is formidable. As in any other industry, unorganized retailers enjoy higher margins due to lower operational costs. Organized retailers must counter the convenience of a hop-skip-and jump access of the small, neighborhood stores. These Indian versions of the mom and-pop store have some traditional advantages that make them formidable opponents for modern trade – established relationships with local consumers, easy credit terms, quick and easy acquisition of products in line with customer preferences and home delivery. 3
  • 4. The past few years have seen the spending power of the middle class increasing exponentially. Shopping for anything – from cars to cutlery, groceries to personal accessories is now a fun thing for the family to do together. Malls have become the alternative hangout and are growing in their popularity as the preferred venue for holiday and evening outings. The new brand of consumer has arrived – ‘the recreational shopper’. The Retail Industry in India is at the crossroads. India is ushering in a revolution in the retailing industry. This is attributed to the huge sum of money being poured in real estate, modern logistic and the creation of new brands. While the opportunity is large the rate and quantum of growth is uncertain. As retailers hope that shopping becomes the sport of choice (perhaps even displacing the old favorite – cricket), some might well say that the retail boom is only just beginning. Historical Evolution for retail in India Modern Formats/ Historic/Rural Traditional/Pervasive Government International Reach Reach Supported Exclusive Brand Outlets Hyper/Super Markets Department Stores Shopping Malls PDS Outlets Khaki Stores Cooperatives Convenience Stores Mom and Pop/ Kiranas W eekly Markets Village Fairs Melas Neighborhood Shopping Source of Availability/ Low Stores/Convenience Experience/Efficiency Entertainment Costs / Distribution 4
  • 5. Dia. 3.6 Historical Evolutions for Retail in India Sources: - ICICI presentation Different Retail Format Used in India Hypermarkets The hypermarket format is most suitable and appealing to the Indian consumer. Very large - over 40,000 sq. ft. The largest retailers operating in this format are Pantaloon Retail with Big Bazaar, RPG Enterprises with Giant (now Spencer’s) and Tata Trent’s Star India Bazaar hypermarkets. Most retailers are likely to continue expanding in the larger Indian cities and select tier-two cities with potential for growth. Some of the trends in the hypermarket format are a rapid growth in revenue led by volumes, and expansion in both large and medium cities. Supermarket Self-service stores - Approx. 4,000 to 20,000 sq. ft. in size, with a strong focus on food and personal care. Supermarkets take the form of a one-stop- shop, catering to the consumer's need for choice and variety. Clientele of supermarkets consist mostly of affluent Indians who are not too price- sensitive, prefer convenience, hygiene and the attractive atmosphere. Large players operating through these formats include Food Bazaars from Pantaloon Retail, RPG’s Food world supermarkets, Trinethra supermarket and Nilgiris. Discount stores 5
  • 6. If we stripped down supermarkets, offering basic range of grocery products typically at great discounts. They run extremely cost-efficient operations by reducing the complexity of inventory, and offering a basic ambience. The most prominent discount grocery chains are Subiksha (leader) and Margin Free Markets. Cash And Carry Usually - 70,000 to 100,000 sq. ft. stores that sell products to members, comprising retailers and institutions. The key added value is a wide range of products under one roof, at wholesale prices Neighborhood Store Traditional stores that provide basic offerings, fixed prices, zero usage of technology, and little or no ambience. These are either dying out, or repositioning themselves, on the basis of convenience and quality. 6
  • 7. Table 3.1 Different Retail Format and value position Current Trends in Indian Retailing Industry • Rising income levels, education and a global exposure have contributed to the evolution of the Indian middle class purchasing and shopping habits are maturing as a result. • Current organized retail is small and fragmented with players not being able to reap economies of scale. • Retailing through formats such as supermarkets, hypermarkets, department stores and other specialty chains are increasing. Leading industrial houses in the country are investing in the sector. This 7
  • 8. includes Food world, Shopper’s Stop, Crossroads, Globus, Pyramid and other such outlets. Dia. 3.7 Four Axis for Retail Scale up Sources: FICCI • Retailing through non-traditional channels such as Fuel Stations, Direct Selling and Home Shopping Television is on the rise. • FDI in retail trading is not encouraged in any form. However, a few foreign retail names appearing in the market are in the nature of franchisee. • Foreign retail chains like Marks & Spencer have already established their operations in the growing Indian market. Several companies including Metro, Tesco, and Carrefour are exploring entry options. Benetton and Lifestyle are already in the business in India. 8
  • 9. Opportunities • Organized retail is a lucrative proposition for a player who can bring in best practices from around the world, leverage economies of scale and reap these benefits through retail operations in India. • India has a large middle class of 350 million and an educated workforce to handle various critical functions like merchandising, sales promotion, inventory management, purchasing and marketing. • India also possesses IT skills in the area of supply chain management, database management and inventory management • A number of drivers are aiding the growth of the industry such as enhanced levels of income and increasing purchasing power, entry of foreign retailers and reforms in real estate markets. Given these developments the organised retailing sector is poised for significant growth in the country. Customer Is a King OR Queen Dia.3.8 Customer is a king or queen Future of Retail Industry in India 9
  • 10. Over 70% of the urban population is estimated to reside in Class I cities (population of over one million) and rest of them mostly stays in class II cities. This is largely as a result of increased employment opportunities in cities as well as a preference among the younger generation to move away from agriculture. Population by age group one of the important demographic trends in recent times is the changing age profile. India is increasingly being acknowledged as a “young” nation, with about 35% of its population less than 14 years of age. The median age of India’s population is 24 years. Dia. 3.9 Organized Retailing –Market Size Source: FICCI Youth are generally early adopters of most modern products and concepts. Given the higher aspirations and “willingness to change” of the younger age 10
  • 11. group, India’s age profile offers high market potential for consumer goods. However, in the long term, this factor represents a challenge as rapidly growing numbers of ageing consumers will have more discretionary income but will spend less on goods and more on healthcare and other services as well as saving for retirement. Set out below is the forecast of the age profile over the next 12 years. Table. 3.2 Population Projection POPULATION Population estimated at 1,055 million (2003) is growing by 1.7% this year. Growing is a key trend in the country, with rural growth averaging to 17.9% and urban 30.7% for the period 1991 to 2001. Statistics with regard to population growth and the rural split are setout below. 11
  • 12. Source: - KSA Technopack Dia. 1.10 Indian Consumer Market Wholesale Part of Retailing in India 12
  • 13. Dia: 15.1 Traditional and Mostly followed Supply chain model India followed by retailer and manufacturer • Supplier-driven product development process. • Push / pipeline model. • One-way info flow of information from supplier to retailer 13
  • 14. Dia: 15.2 New Form of supply chain in place to be in Future Manufacturer Telephony Infrastructure Direct Marketing Web Infrastructure Transportation Overnight Delivery Distributors Retailers Infomediary and Outsourced Service Providers In new globalize world this is going to happen in retail and manufacturer relationships. So there will be a backward integration also in supply chain in coming future with help of internet and technology. • 2-way real-time information flow • Networking model provides immediate sales feedback up and down the supply chain. • Fully informed supply through all phases of product life cycle 14
  • 15. Visual Merchandising (VM) is the art of presentation, which puts the merchandise in focus. It educates the customers, creates desire and finally augments the selling process. This is an area where the Indian textile and clothing industry, particularly, the SMEs lack adequate knowledge and expertise. This inadequacy is best reflected in poor presentation/display and communication in various national and international exhibitions. Therefore this Programme has been conceived to fill this gap. VM helps in: educating the customers about the product/service in an effective and creative way. establishing a creative medium to present merchandise in 3D environment, thereby enabling long lasting impact and recall value. setting the company apart in an exclusive position. establishing linkage between fashion, 15
  • 16. product design and marketing by keeping the product in prime focus. combining the creative, technical and operational aspects of a product and the business. drawing the attention of the customer to enable him to take purchase decision within shortest possible time, and thus augmenting the selling process. STATUS OF VISUAL MERCHANDISING IN INDIA: Unlike the western countries, where VM receives highest priority in commercial planning of a product, the Indian industry’s understanding and practice of the concept of VM is inadequate. With phasing out of quantitative restrictions after the year 2004, the textile industry will have to compete purely on the competitive edge of the products and VM will be a helpful tool in projecting the uniqueness of the products and thereby increasing the market access and sales. It is high time that the Indian textile and clothing industry, therefore, understands and adopts the scientific and professional system of VM rather than the traditional practices of display of products and communication. 16
  • 17. 17
  • 18. About Vishal Mega Mart Ram Agarwal started Vishal Mega Mart in Kolkata in 1986, in a 100 sq ft shop in Lal Bazaar. It was a struggle in the beginning, but within two years his store had taken off, and today Vishal Mega Mart has branches all over the country. With a turnover of Rs 89 crore (Rs 890 million), Vishal Mega Mart has been one of the pioneers of bargain retailing in India, and now it is diversifying to become an all-purpose departmental store. In the beginning His family had a business in Calcutta (now Kolkata) when he was growing up, but he wanted to do something different, so he got a job instead. However, by 1984, he got bored and decided to start something by myself. At that time, especially in Calcutta, there weren't really any retail stores. People would buy fabric and get their clothes stitched. He was one of the first people to put forward the idea of a large departmental style retail store that early on. Financial worries He started with around Rs 100,000, for which he had to take out a loan as well as dip into some family savings. This went into renting their workspace, which was an office and a workshop rolled in one, 18
  • 19. and hiring the three people he had working for him. They sourced all their material from Calcutta itself, and stitched their garments in- house. It took two years for them to really take off -- until then it was a continuous learning process for him, since he was relatively inexperienced in running a business. He had to learn various tricks along the way, especially in terms of selling. They set up their first shop in 1986, and by 1990, they had four showrooms in Calcutta. The first big outlet was set up in the popular Esplanade area in 1997. The thing that really made a difference was, around 1988, he had the brainwave of introducing sales. That idea really took off -- they would buy in bulk at discounted rates, and sell at really low prices. They took temporary shops and put up sales -- they'd get lines going around the corner! Expanding sales The first shop they opened outside of Calcutta was in Bhubaneshwar, and today they are present in cities like Jaipur, Indore, Hyderabad and Pune. They set up their first Delhi shop in 2002 -- now they have seven. He owe all his success to the fact that he has managed to really differentiate his product: they offer pure value for money. They do business at a low margin, by cutting the middle-man -- and that's why they clicked. They're probably the only players in India who purchase with cash, and buy directly from the manufacturer. They started with a 19
  • 20. price point of Rs 125 on average, and today this has only increased to Rs 250, pretty reasonable by today's standards. They even do formalwear within this range. The inspiration He got the inspiration to diversify his stores when he went abroad. Big retailers like Sears or Walmart cater to absolutely everything. In India we don't have their equivalent here. While it is emerging now in India, there is still nothing like an organised retail sector. In the beginning of 2004, they started to branch out into furnishings, cosmetics and other fast-moving consumer goods. They now have a 1,50,000 sq ft hypermarket in New Delhi's Mathura Road. At this point, it is a little tough to manage this kind of expansion, especially with all the different varieties it brings -- you have to keep your fingers in several pies at once which is a bit of a juggling act -- but if you can manage this sector, there is no doubt that you will be king of retail in India. Hope for the future They hope to reach Rs 5,000 crore (Rs 50 billion) by 2010. This is a sobering thought, given that when he first started, they were making sales of around Rs 200 a day! Their expansion plans are still on target, they're planning more stores in Delhi and the big metros. He think the main reason for his success is that he was in the right place at the right time, and he realised that the middle classes were a vast 20
  • 21. untapped resource. Middle class wanted to spend their money, but they also wanted bargains, and this is exactly what he gave them. The VISHAL Group: What started as a humble one store enterprise in 1986 in Kolkata (erstwhile, Calcutta) is today a conglomerate encompassing 49 showrooms in 37 cities. India’s first hyper-market has also been opened for the Indian consumer by Vishal. Situated in the national capital Delhi this store boasts of the singe largest collection of goods and commodities sold under one roof in India. The Group has a turnover of Rs 150 crore for 2004-05. Under the dynamic leadership of Mr. Ram Chandra Agarwal the group is expecting to touch the turnover of Rs 300 crore by the end of March 2006 and Rs 650 crore for the period 2006-07. The group’s prime focus is on retailing. The Vishal stores offer affordable family fashion at prices to suit every pocket. The group’s philosophy is integration and towards this end has initiated backward integration in the field of high fashion by setting up a state of the art manufacturing facility to support its retail endeavors. Vishal is one of fastest growing retailing groups in India. Its outlets cater to almost all price ranges. The showrooms have over 70,00 products range which fulfills all your household needs, and can be catered to under one roof. It is covering more than 11 Lacs of sq. ft. in retail space and more than 5 Lacs sq.ft. under construction. Each store gives you international quality 21
  • 22. goods and prices hard to match. The cost benefit that is derived from the large central purchase of goods and services is passed on to the consumer. The Founders: Mr.Ramchandra Aggarwal Mrs.Uma Aggarwal Mr.Surendra Aggarwal 22
  • 23. Introduction to the Research topic Vishal Retail Ltd is one of the leading retail houses in India. As of January 25, 2007, they operated 48 retail stores of Vishal Mega Mart spread over 1,150,000 square feet across 37 cities in 17 states. In their efforts to strengthen their supply chain, they have set up seven regional distribution centers and an apparel manufacturing plant. They started as a retailer of ready-made apparels in Kolkata in 2001. In 2003, they acquired the manufacturing facilities from Vishal Fashions Private Limited and M/s Vishal Apparels. Subsequently, with evolution of retail industry in India and change in consumer aspirations, they diversified their portfolio of offerings to include other retail goods. Currently, they sell ready-made apparels and a wide range of household merchandise and other consumer goods such as footwear, toys, watches, toiletries, grocery items, sports items, crockery, gift and novelties. They follow the concept of value retail in India. In other words, their business approach is to sell quality goods at reasonable prices by either manufacturing themselves or directly procuring from manufacturers (primarily from small and medium size vendors and manufacturers). They endeavour to facilitate one-stop-shop convenience for their customers and to cater to the needs of the entire family. They believe this concept has helped them grow to their current size within a short time frame of four years. 23
  • 24. Why chosen Vishal Mega Mart as the research subject We all know that Retail is one of the fastest growing sectors in India and in the time to come it is expected to grow manifold. Hence this is the sector which has immense opportunities not only for working professionals but for the freshers, new to the corporate world, too. We have chosen retail sector as we are eyeing the same to enter into, after successful completion of our MBA programme because of the already mentioned reason. Further we have chosen Vishal Mega Mart as our research subject because it is the biggest and only specimen of organized retail in general merchandise in Dehradun till date, though there are more than one organized food retailers like Mc Donalds, Pizza Hut and Narula’s operating in the city. 24
  • 25. Review of Literature The study of consumer store-choice or patronage behavior has been an important area of research in retailing for many decades. The decision on the choice of store has been modeled in different ways in the literature. Some of the studies have taken the household as a rational decision making unit, (Becker, 1965; Goldman and Johansson, 1978; Bawa and Ghosh, 1999). Similarly, Bell, Ho and Tang, (1998) in their work on store choice found evidence that each shopper is more likely to visit the store with the lowest total shopping cost. Some of the researchers (Bell, Ho and Tang, 2001) have worked on the shoppers perceived utility and the store image in making the store choice. Research also exists on how store environment cues influence consumers' store choice decision criteria, such as perceived merchandise value and shopping experience (Baker, Parasuraman, Grewal, and Voss, 2002). Store choice has also been seen in the context of the risk reduction strategies of the shoppers (Mitchel and McGoldrick, 1996; Mitchell and Harris, 2005). In addition work on store choice has also been done on the role of situational factors (Wu, Petroshius, and Newell, 2004) and the task-store attribute relationship (Kenhove, Wule, and Waterschoot, 1999) found to be dependent on the timing of shopping trips, with consumers visiting smaller local store for short "fill-in' trips and larger store for regular shopping trips (Kahn and Schmittlein, 1989). Most of the studies in store choice have however pointed out the primacy of store location (Arnold, Oum and Tigert, 1983; Freymann, 2002) and price 25
  • 26. (Bell, Ho and Tang, 2001; Freymann, 2002; Arnold, Oum and Tigert, 1983) as the key drivers of store choice. Lastly Bell and Lattin (1998) found a systematic relationship between a household's shopping behavior and store preference, especially in the context of choice of a format The most common technique employed in the methodologies of the majority of research work involved in store image measurement has been by asking consumers to rate particular outlets on pre-defined scales. Thus, the semantic differential scaling used by Osgood et al. (1957) has subsequently been widely employed. Five or seven point bi-polar scales have been the most common (e.g. McDougall and Fry, 1974; Golden et al., 1987; and Cassill et al., 1993), but Hansen and Deutscher (1977) used staple scales ranging from zero to ten. Others, such as James et al. (1976) have utilized attitudinal scaling techniques when evaluating attributes for a particular store (e.g. ‘very good’ or ‘very bad’), with total scores indicating how well a store filled consumer expectations overall. Cassill et al. (1993) made some attempt to summarise these ratings of individual attributes by using factor analysis. They found that consumers choose to patronise individual department stores for clothing purchases when a combination of factors were present: the stocking of particular brands; the presence of national and own branded products; and where garments offered functional value rather than fashion appeal. Two problems characterise the majority of previous studies of store image. First, the dimensions on which consumers are asked to rate particular outlets have largely been predetermined by the researcher, and have not emanated from the respondents themselves. Second, many studies have treated attributes of store image as if they are all equally important, which need not necessarily be the case. surprising, therefore, that researchers 26
  • 27. have striven consistently to provide an improved understanding of store image (Martineau, 1958; Kunkel and Berry, 1968; Lindquist, 1974; In Martineau’s (1958) paper, it was suggested that retail outlets had, so far as customers wereconcerned, a ‘personality’ composed of functional and psychological attributes. It can be concluded from this early work on store image that findings from one sector are not, necessarily, broadly applicable. It is not surprising, therefore, that Davies (1992) concluded that store image is likely to be situation specific, varying according to the purpose of each consumer purchase. Osman (1993) has attempted to relate these two factors, by proposing that consumer attitudes to store choice are affected by the store rating on each of the contributing attributes. This is therefore, a critical area for further research work, as often managers have been shown to perceive their own retail image differently from that of their customers (McLure and Ryans, 1968). The studies on store choice have mostly dealt with individual choices and the studies have investigated the drivers of store choice taking individuals as the samples (mostly housewives). Little research exists, which analyses the shopping behavior with a family or household as a unit. Researchers have found that, store choice and shopping trip timing decisions tend to differ for individuals and households as a result of personal differences, household composition, and activity patterns (Leszczyc and Timmermans, 1997; Kim and Park, 1997). Similarly work has been done on household demographic variables (Leszczyc, Sinha, and Timmermans, 2000; Bawa and Ghosh, 1999) and relating them to the shopping behaviour of the household, the trip timing (Kahn and Schmittlein, 1989) and the store choice (Kau and Ehrenberg, 1984). However, as compared to the work on the product and 27
  • 28. service choices by the families/households, the work on store choice is quite less and covers few dimensions. The existing research supports that household size has a positive effect on the likelihood of a shopping trip (Leszczyc, Sinha, and Timmermans, 2000). Similarly Bawa and Ghosh, (1999), found that the size of the family was positively associated with the frequency of shopping trips and the basket size. The household composition, will also affect the shopping basket, it has been suggested that for a given household size, the presence of children in the household is likely to lower expenditures relative to an all-adult household due to differences in consumption rates for children and adults (Prais and Houthakker, 1971; Benus, Kmenta and Shapiro, 1976; McClements, 1977; Muelbauer, 1980). In addition, the presence of children is likely to result in a more diverse basket size, with higher chances of stock outs and greater impulse purchases. Thus the presence of children will induce baskets, with larger baskets in terms of categories, but smaller baskets in terms of size. 28
  • 29. Hypothesis Formulation Every test of significance begins with a null hypothesis (H0 ). H0 represents a theory that has been put forward, either because it is believed to be true or because it is to be used as a basis for argument, but has not been proved. The very first step in the formulation of hypothesis is to formulate two hypotheses instead of one in such a way that if one is accepted then the other is rejected or vice versa. The other one is called as alternative hypothesis (Ha ). It is a statement of what a statistical hypothesis test is set up to establish. In our study we have formed a number of hypotheses: H01: More buying intention of customers is independent of gender. H02: More buying intention of customers is independent of age. H03: Unique shopping experience of customers is independent of gender. H04: Unique shopping experience of customers is independent of age. H05: Customer’s opinion of products being trendy and of latest style is independent of gender. H06: Customer’s opinion of products being trendy and of latest style is independent of age. 29
  • 30. Objectives of study 1. To study the shopping behavior of customers coming to Vishal Mega Mart. 2. To study the consumer perception and attitude towards Vishal Mega Mart as a brand. 3. To study the effectiveness of visual merchandising in Vishal Mega Mart. 4. To study the perception of customers about products and services offered by Vishal Mega Mart. 5. To study the perception of customers of the prices of products and services offered by Vishal Mega Mart. 6. To study the customer perception about the promotional strategies of Vishal Mega Mart. 30
  • 31. Scope and Importance Though Vishal Mega Mart operates in 37 cities with 49 showrooms, the study is restricted to the Dehradun region because of the time, cost and accessibility constraints. The study is important because it gives insight into the customer’s perception towards organized retailing and gives an idea of customer’s overall shopping behavior. It is important to Vishal Mega Mart because it reveals the strong and weak points of the store. Thus it gives an opportunity to the store to recognize and improve upon its weak points and convert its strong areas into strategic advantage. Till date Vishal Mega Mart is the only player in organized general merchandising and thus is enjoying the benefits of monopoly. But in the time to come many big players like Big Bazaar, Reliance etc. are also planning to enter Dehradun. Thus the report can be useful to these new entrants also, as it provides a clue about the customer behavior. 31
  • 32. Research Methodology Research methodology is a way to the systematic solution of a research problem. It focuses on the various steps adopted in studying the research problem along with the logic behind using them. Research Design Research design is the conceptual structure within which research is conducted. A research design specifies the methods and procedures for conducting a particular study. Research type Our research is both Exploratory as well as Descriptive. Explorative because it focuses on the discovery of ideas and uses secondary data and Descriptive because it also focuses on the characteristics of certain group of customers such as age, sex, income etc. -Universe All the items under consideration in any field of inquiry constitute a ‘universe’. In our case it is the population of Dehradun city. -Duration The research work has been completed within the time limit specified by the Management i.e. two months. Sample Design A sample design is a definite plan determined before any data are actually collected for obtaining a sample from a given population. In our case we have used systematic sampling. We stood at the exit of Vishal Mega Mart and tapped every fifth customer. 32
  • 33. -Sample unit Students, businessmen, servicemen, working women, house wives. -Sampling technique Sampling technique is the technique or method by which the information is collected. We have used well defined questioneres to collect the data. Further we have also used the interview technique wherever we felt that the respondents were not literate enough to answer the questions by themselves. Interviews were taken in accordance with the questioneres. -sample size Initially we had 150 as the size of our research sample but responses of 7 respondents out of these 150 were found to be unfit to be included in the sample so sample size got reduced to 143. Data Collection There are two types of data: primary and secondary. Primary data is the data that have been observed and recorded by the researchers for the first time to their knowledge. Secondary data is the data that is not gathered for the immediate study at hand but for some other purposes. In our study we have used both types of data. Primary data has been collected with the help of questioneres and interviews whereas secondary data has been collected from various books and the websites. Statistical tools used -Measures of central tendency -Chi-square test -Simple pie and bar diagrams 33
  • 34. Analysis Demographic analysis 1) Age 1-less than 20 2-greater than equal to 20 and less than equal to 35 3-greater than 35 It can very easily be depicted from the graph that in our sample there are i. only 7% people who are less than 20 years of age ii. 45% people belong to the age group of ‘greater than equal to 20 and less than equal to 35’ iii. 48% people are greater than 35 years of age 34
  • 35. 2) Income 1) Income<5000 2) 5000<=Income<10000 3) 10000<=Income<20000 4) 20000<=Income<30000 5) Income>30000 It can very easily be depicted from the graph that in our sample i. 24% respondents have income less than Rs5000 ii. 17% respondents have income between Rs5000 and Rs10000 iii. 36% respondents have income between Rs10000 and Rs20000 iv. 19% respondents have income between Rs20000 and Rs30000 v. 0nly 4% respondents have income more than Rs30000 35
  • 36. 3) Expenditure 1) Expenditure<1000 2) 1000<=Expenditure<2000 3) 2000<=Expenditure<3000 4) 3000<=Expenditure<5000 5) Expenditure>5000 It can very easily be depicted from the graph that in our sample i. 19% respondents have monthly expenditure less than Rs1000 ii. 21% respondents have monthly expenditure between Rs1000 and Rs2000 iii. 20% respondents have monthly expenditure between Rs2000 and Rs3000 iv. 19% respondents have monthly expenditure between Rs3000 and Rs5000 v. 21% respondents have monthly expenditure greater than Rs5000 36
  • 37. 4) Gender 1) Female 2) Male 1 40% 1 2 2 60% 1 100% It can very easily be depicted from the graph that in our sample there are 40% females and 60% males. 37
  • 38. Shopping Behavior I. I have started coming for shopping with my family now Shopping with family 66 70 Strongly agree 60 agree 50 38 40 Neither agree nor disagree 30 21 Disagree 20 15 10 3 Strongly Disagree 0 II. When I buy from VMM, I buy more than what I plan 38
  • 39. III. I have stopped visiting the old shop I used to visit 39
  • 40. Consumer perception and attitude towards VMM as a brand IV. VMM offer a unique shopping experience Unique shopping experience 100 93 Strongly agree 80 Agree 60 Neither agree nor disagree 40 29 Disagree 20 8 9 4 Strongly disagree 0 V. Rate your shopping satisfaction level at VMM on the scale of 1-10(1 being poor and 10 being outstanding) 40
  • 41. VI. Rate efficiency at billing counters of VMM on the scale of 1-10 VII. Rate layout of VMM on the scale of 1-10 41
  • 42. VIII. I will definitely come again to VMM for shopping IX. Rate following sections of VMM on the scale of 1-5(1 being poor and 5 being outstanding) a) Grocery/Canned food 42
  • 43. b) Apparel Apparel 65 70 53 60 1 50 2 40 3 30 4 13 20 9 5 3 10 0 c) Kids Kids 62 70 60 1 50 2 40 31 3 26 30 19 4 20 5 5 10 0 43
  • 44. d) Footwear Foot wear 70 61 54 60 1 50 2 40 3 30 4 12 14 20 5 10 1 0 e) Household 44
  • 45. f) Restaurant Restaurant 50 47 50 40 1 2 30 3 16 20 4 8 5 10 0 0 g) Overall 45
  • 46. Perception about Products and services X. Rate quality of products at VMM on the scale of 1-10 XI. Rate product variety at VMM on the scale of 1-10 46
  • 47. XII. Products offered at VMM are trendy and of latest style XIII. The way products are displayed makes me buy more than what I plan 47
  • 48. Price XIV. Keeping the quality of products in mind, most of products at VMM are expensive XV. Rate your satisfaction level regarding prices of products at VMM on the scale of 1-10 48
  • 49. XVI. I visit VMM because of less price or discounts offered 49
  • 50. Promotion XVII. The discounts offers at VMM are usually tempting XVIII. I am generally aware of all offers at VMM 50
  • 51. XIX. Rate your satisfaction regarding the clarity of signages carrying information about offers and discounts inside VMM on the scale of 1-10 XX. I come to VMM because I find advertisements of VMM effective 51
  • 52. XXI. Rate the following influencing factors on the scale of 1-5 which make you visit VMM a) Discount b) Ambience 52
  • 53. c) A good time pass destination Time pass destination 60 51 50 1 40 2 23 3 30 16 4 20 6 5 10 1 0 d) Self selection facility 53
  • 54. e) All items under one roof All items under one roof 57 60 51 1 2 40 25 3 20 4 4 6 5 0 XXII. How would you rate the behavior of employees on the scale of 1-10 54
  • 55. Chi-square tests 1) To test whether more buying intention of customers (variable 1) has any relation with gender (variable 2) Step 1: State the null and alternative hypotheses. H0 : variable 1 is independent of variable 2 Ha: variable 1 and variable 2 have a relationship Step 2: Significance level Significance level is 0.05 or 95% confidence level Step 3: Test criterion Applying Chi-square test Step 4: Computations More Buying & Gender:- Table 1 Gender Yes No Total Male 50 13 63 Female 39 10 49 Total 89 23 112 55
  • 56. O E (O-E) (O-E)^2 (O-E)^2/E 50 50.0625 -0.0625 3.9062 7.8027 39 38..9375 0.0625 3.9062 1.0032 13 12.9375 0.0625 3.9062 3.0193 10 10.0625 -0.0625 3.9062 3.8819 Total 15.7076 Degree of freedom: (r-1)*(c-1) = (2-1)*(2-1) =1 Step 5: Decision Chi (calculated): 15.7076 Chi (tabulated) : 3.841 Since the calculated value is very much higher than the tabulated value at 1 degree of freedom and 95% confidence level therefore null hypothesis rejected i.e. more buying intention of customers depends upon gender. 2) To test whether more buying intention of customers (variable 1) has any relation with age (variable 2) 56
  • 57. Step 1: State the null and alternative hypotheses. H0 : variable 1 is independent of variable 2 Ha: variable 1 and variable 2 have a relationship Step 2: Significance level Significance level is 0.05 or 95% confidence level Step 3: Test criterion Applying Chi-square test Step 4: Computations More Buying &Age:- Age Yes No Total a 6 3 9 b 40 10 50 c 44 8 52 Total 90 21 111 O E (O-E)^2 (O-E)^2/E 6 7.2973 1.6829 0.2306 40 40.5405 02921 0.0072 44 42.1622 3.3775 0.0801 3 1.7027 1.6829 09884 10 9.4595 0.2921 0.0309 8 9.8378 3.3775 0.3433 57
  • 58. Total 1.6805 Degree of freedom: (r-1)*(c-1) = (3-1)*(2-1) =2 Step 5: Decision Chi (calculated): 1.6805 Chi (tabulated) : 5.991 Since the calculated value is much less than the tabulated value at 2 degree of freedom and 95% confidence level therefore null hypothesis accepted i.e. more buying intention of customers is independent of age. 3) To test whether unique shopping experience of customers (variable 1) has any relation with gender (variable 2) Step 1: State the null and alternative hypotheses. H0 : variable 1 is independent of variable 2 Ha: variable 1 and variable 2 have a relationship Step 2: Significance level 58
  • 59. Significance level is 0.05 or 95% confidence level Step 3: Test criterion Applying Chi-square test Step 4: Computations Unique Shopping & Gender:- Gender Yes No Total Male 57 8 65 Female 44 5 49 Total 101 13 114 O E (O-E)^2 (O-E)^2/E 57 57.5877 0.3454 0.00599 44 43.4123 0.3454 0.00796 8 7.4123 0.3454 0.0466 5 5.5877 0.3454 0.0618 Total 0.1224 Degree of freedom: (r-1)*(c-1) = (2-1)*(2-1) =1 Step 5: Decision 59
  • 60. Chi (calculated): 0.1224 Chi (tabulated) : 3.8410 Since the calculated value is less than the tabulated value at 1 degree of freedom and 95% confidence level therefore null hypothesis accepted i.e. unique shopping experience of customers is independent of gender. 4) To test whether unique shopping experience of customers (variable 1) has any relation with age (variable 2) Step 1: State the null and alternative hypotheses. H0 : variable 1 is independent of variable 2 Ha: variable 1 and variable 2 have a relationship Step 2: Significance level Significance level is 0.05 or 95% confidence level Step 3: Test criterion 60
  • 61. Applying Chi-square test Step 4: Computations Unique Shopping Experience & Age:- Age Yes No Total a 6 2 8 b 46 7 53 c 49 4 53 Total 101 13 114 O E (O-E)^2 (O-E)^2/E 6 7.0877 1.1831 0.1669 46 46.9561 0.9141 0.0195 49 46.9561 4.1775 0.0889 2 0.9123 1.1813 1.2968 7 6.0439 0.9141 0.1512 4 6.0439 4.1775 0.6912 Total 2.4145 Degree of freedom: (r-1)*(c-1) = (3-1)*(2-1) =2 Step 5: Decision 61
  • 62. Chi (calculated): 2.4145 Chi (tabulated) : 5.991 Since the calculated value is much less than the tabulated value at 2 degree of freedom and 95% confidence level therefore null hypothesis accepted i.e. unique shopping experience of customers is independent of age. 5) To test whether customers of particular gender (variable 1) found the products of VMM trendy and of latest style (variable 2) Step 1: State the null and alternative hypotheses. H0 : variable 1 is independent of variable 2 Ha: variable 1 and variable 2 have a relationship Step 2: Significance level Significance level is 0.05 or 95% confidence level Step 3: Test criterion Applying Chi-square test Step 4: Computations 62
  • 63. Gender Yes No Total Male 44 18 62 Female 24 10 34 Total 68 28 96 O E (O-E)^2 (O-E)^2/E 44 43.9167 6.9389 1.5800 24 24.0833 6.9389 2.8812 18 18.0833 6.9389 3.8549 10 9.9167 6.9389 6.9389 Total 15.2550 Degree of freedom: (r-1)*(c-1) = (2-1)*(2-1) =1 Step 5: Decision Chi (calculated): 15.255 Chi (tabulated) : 3.8410 Since the calculated value is very much greater than the tabulated value at 1 degree of freedom and 95% confidence level 63
  • 64. therefore null hypothesis rejected i.e. opinion that the products at Vishal Mega Mart are trendy and of latest style depends upon gender. 6) To test whether customers of particular age group (variable 1) found the products of VMM trendy and of latest style (variable 2) Step 1: State the null and alternative hypotheses. H0 : variable 1 is independent of variable 2 Ha: variable 1 and variable 2 have a relationship Step 2: Significance level Significance level is 0.05 or 95% confidence level Step 3: Test criterion Applying Chi-square test Step 4: Computations Table 2 Age Yes No Total a 4 2 6 b 29 107 39 c 34 14 48 Total 67 26 93 64
  • 65. O E (O-E)^2 (O-E)^2/E 4 4.3226 0.1041 0.0241 29 28.0968 0.8158 0.0290 34 34.5806 0.3371 9.7481 2 1.6774 0.1041 0.0620 10 10.9032 0.8158 0.0748 14 13.4194 0.3371 0.0251 Total 9.9631 Degree of freedom: (r-1)*(c-1) = (3-1)*(2-1) =2 Step 5: Decision Chi (calculated): 9.9631 Chi (tabulated) : 5.991 Since the calculated value is much greater than the tabulated value at 2 degree of freedom and 95% confidence level therefore null hypothesis rejected i.e. opinion that the products at Vishal Mega Mart are trendy and of latest style depends upon age. 65
  • 66. 7) To test whether price (variable 1) has any relation with gender (variable 2) Step 1: State the null and alternative hypotheses. H0 : variable 1 is independent of variable 2 Ha: variable 1 and variable 2 have a relationship Step 2: Significance level Significance level is 0.05 or 95% confidence level Step 3: Test criterion Applying Chi-square test Step 4: Computations Gender Yes No Total Male 32 25 57 Female 31 13 44 Total 63 38 101 O E (O-E)^2 (O-E)^2/E 32 35.5544 12.6337 0.3553 66
  • 67. 31 27.4455 12.6344 0.3553 25 21.4455 12.6344 0.5891 13 16.5544 12.6337 0.7631 Total 2.0631 Degree of freedom: (r-1)*(c-1) = (2-1)*(2-1) =1 Step 5: Decision Chi (calculated): 2.0631 Chi (tabulated) : 3.8410 Since the calculated value is less than the tabulated value at 1 degree of freedom and 95% confidence level therefore null hypothesis accepted i.e. price is independent of gender. 8) To test whether price (variable 1) has any relation with 0 (variable) 67
  • 68. Step 1: State the null and alternative hypotheses. H0 : variable 1 is independent of variable 2 Ha: variable 1 and variable 2 have a relationship Step 2: Significance level Significance level is 0.05 or 95% confidence level Step 3: Test criterion Applying Chi-square test Step 4: Computations Age Yes No Total a 3 3 6 b 30 17 47 c 30 18 48 Total 63 38 101 O E (O-E)^2 (O-E)^2/E 3 3.7425 0.5513 0.1473 68
  • 69. 30 29.3168 0.4667 0.1592 3 2.2574 0.55145 0.2442 30 29.9405 3.54025 0.1182 17 17.6831 0.4666 0.0263 18 18.0594 3.5283 1.9537 Total 2.6489 Degree of freedom: (r-1)*(c-1) = (3-1)*(2-1) =2 Step 5: Decision Chi (calculated): 2.6489 Chi (tabulated) : 5.991 Since the calculated value is less than the tabulated value at 2 degree of freedom and 95% confidence level therefore null hypothesis accepted i.e. price is independent of age. Rank Summary of different sections Table 3 Sections Ratings Grocery 500 Apparel 457 Kids 462 69
  • 70. Footwear 357 Household 490 Restaurant 370 Overall 457 Rank summary of different promotional factors Table 4 Factors Discount 487 Ambience 455 Time pass Destination 486 Self selection 562 Item under one roof 574 70
  • 71. Rank summary of different influencing factors Table 5 Factors Rating of shopping 975 satisfaction Rating billing counter 800 efficiency 71
  • 72. Rating of lay out at VMM 805 Rating of product quality 1021 Rating of product variety 844 Rating of price satisfaction 825 Rating of clarity of signages 834 Rating of behavior of 1003 employees 72
  • 73. Findings Shopping behavior  It has been found that majority of the respondents i.e. more than 56% people have started coming for shopping with their families after Vishal Mega Mart started its operations in Dehradun.  More than 63% respondents agree that they buy more than planned when they buy from Vishal Mega Mart.  After the application of Chi-square test it has been found that more buying intention of customers depends upon the gender and after considering table 1 we can easily infer that this tendency is more in males than in females.  Further when we applied the same test to see whether more buying intention of customers varies with the age, it was found that more buying intention does not have any relation with the age.  65% respondents are of the opinion that they have not stopped visiting the old shop they used to visit before Vishal Mega Mart came to Dehradun. 73
  • 74. Consumer perception and attitude towards VMM as a brand  Nearly 71% respondents believe that Vishal Mega Mart offers a unique shopping experience.  The application of Chi-square test suggests that all the respondents have a perception about unique shopping experience irrespective of gender i.e. unique shopping experience opinion, at Vishal Mega Mart does not depend whether a respondent is male or female.  The application of Chi-square test suggests that all the respondents have a perception about unique shopping experience irrespective of age also i.e. unique shopping experience opinion, at Vishal Mega Mart does not depend on the age group of the respondents.  Nearly 33% respondents have rated the shopping satisfaction level at Vishal Mega Mart as more than average.  Only 26% respondents have rated efficiency of billing counters at Vishal Mega Mart as average.  About 29% respondents believe that layout of Mega Mart is just average.  Approximately 73% respondents said they will definitely come again to Vishal Mega Mart, only negligible minority refused to revisit Vishal Mega Mart.  56% respondents have rated the grocery section of Vishal Mega Mart as outstanding.  45% respondents believe the apparel section is just fair enough or average.  43% respondents believe the kids section is just fair enough or average. 74
  • 75. More than half of the respondents i.e. 51% have rated the foot wear section of Vishal Mega Mart as poor.  Nearly 75% respondents believe that the house hold section of Vishal Mega Mart is above average.  Nearly 68% respondents have rated the restaurant of Vishal Mega Mart to be below average.  More than 61% respondents have rated the Vishal Mega Mart on overall basis to be average. Table 3 clearly shows the rank wise likeliness of the following sections: 1. Grocery 2. Households 3. Kids 4. Apparel, Overall 5. Restaurant 6. Footwear 75
  • 76. Perception about Products and Services  More than 43% respondents have rated the quality of products at Vishal Mega Mart to be good enough.  38% respondents have rated the product variety available at Vishal Mega Mart to be above average.  Nearly 48% respondents agree that the products offered at Vishal Mega Mart are trendy and of latest style. Only 20% respondents believe them not to be trendy and of latest style while the rest kept num to the question.  Further the Chi-square test suggests that the opinion that the products at Vishal Mega Mart are trendy and of latest style does depend upon gender.  The Chi-square test is also indicating a relationship between age and opinion that the products at Vishal Mega Mart are trendy and of latest style. Further the table 2 shows that respondents with higher the age perceived the products more trendy and of latest style.  Majority of the respondents agree that the visual merchandising techniques practiced by Vishal Mega Mart make them buy more than what they initially plan. 76
  • 77. Price  45% believe that keeping the quality of products in mind, most of the products at Vishal Mega Mart are expensive. Only 26% respondents believe them to be inexpensive while rest belongs to neither of the view.  The application of Chi-square test shows no relation between perception about price and gender i.e. male and female perceives the price similarly.  Similarly Chi-square test shows no relation between perception about price and age group i.e. members of all the age group perceive the price similarly.  32% respondents have rated the price satisfaction level of products at Vishal Mega Mart to be above average.  Majority of the respondents (55%) visit Vishal Mega Mart because of less price or discounts offered. Promotion  Nearly 43% respondents believe the discounts offered at Vishal Mega Mart to be tempting.  37% respondents believe that they are generally aware of all offers at Vishal Mega Mart whereas nearly equal number of respondents i.e.38% believe that they are not aware of the offers at Vishal Mega Mart. 77
  • 78.  Nearly 50% of the people have appreciated clarity of signages at Vishal Mega Mart.  Only 36% respondents come to Vishal Mega Mart because they find advertisements of Vishal Mega Mart effective.32% respondents do not find the advertisement effective enough and thr rest are of no opinion.  Most of the respondents (51%) visit Vishal Mega Mart because of discounts offered.  36% respondents have rated ambience of Vishal Mega Mart as above average whereas 25% have rated it to be below average, and the rest are of no opinion.  36% respondents have rated Vishal Mega Mart as an average time pass destination.  Nearly half of the respondents i.e. 48% have rated the self selection facility at Vishal Mega Mart as good enough.  75% respondents visit Vishal Mega Mart because they find all items under one roof.  Majority of the respondents have rated the behavior of the employees of Vishal Mega Mart to be good enough. Table 4 clearly shows the rank wise likeliness of the following influencing factors: 1. All items under one roof 2. Self selection facility 3. Discount 4. A good time pass destination 78
  • 79. 5. Ambience Table 5 clearly shows the rank wise likeliness of the following factors: 1. Product Quality 2. Behavior of Employees 3. Shopping satisfaction 4. Product variety 5. Clarity of signages 6. Price satisfaction 7. Layout of Vishal Mega Mart 8. Billing counter efficiency 79
  • 80. 80
  • 81. Limitations 1) Many of the people were reluctant to give the information about their income expenditure and age. 2) The Questionnaire was too lengthy and became time consuming. 3) The length of the questionnaire added to the cost constraint also 4) The sample size of the report is too small because of the time, costs and accessibility constraints. 5) Respondents were not aware of all the sections of the store. 6) Some of the respondents were not literate enough to fill up the questionnaire by themselves and thus needed to be guided. This became time consuming. 7) Faced a bit of difficulty in getting permission from Vishal Mega Mart 81
  • 82. Conclusion Vishal Mega Mart has only recently started its operations in Dehradun and one of the most prominent effects of its showroom is that people have started coming for shopping with their families now. People do feel unique shopping experience when they shop at Vishal Mega Mart. One strong point of the store is that the ways products are displayed make people buy more than what they plan initially i.e. visual merchandising techniques are effectively followed to certain extent but these are not being followed extensively as people have rated ambience and layout to be poor. Sections most popular among customers are grocery and household but customers complain of not much discount being offered in these sections. One of the reasons that people come to Vishal Mega Mart is that they find all items under one roof. The other factors that attract customers most are discounts and self selection facility. Presently the store is enjoying the benefits of monopoly as it is the only organized general merchandising store in Dehradun though there are more than one organized food retailers like Mc Donalds, Pizza Hut and Narula’s operating in the city. But in the time to come many big players like Big Bazaar, Reliance etc. are also planning to enter Dehradun. Thus the store should recognize and improve upon its weak areas. One of its weak areas is long waiting time at the billing counters. Further people have rated the advertisement to be ineffective, inefficient and insufficient. The store should also try and improve upon its quality and reduce costs as most of the people 82
  • 83. are of the view that keeping the quality in mind the products offered at Vishal Mega Mart are expensive. It is not attracting footfalls as a good time pass destination. On overall basis people find Vishal Mega Mart as average. 83
  • 84. Recommendations 1. The study reveals that usually males buy more than what they plan initially. Thus the store should maintain visual merchandising techniques in the men section and improve the same in the sections related to women. 2. People find the waiting time in the que of the billing counters long, so the store should try and increase the number of billing counters. Further the employees training can increase the efficiency and decrease the waiting time. 3. There is vast scope of improvement in the layout of the store. 4. The sections that need attention are footwear, apparel and restaurant 5. The study reveals that people who belong to high age group find the products of the store to be trendy and of latest style but the younger generation does not hold the same opinion. So the store should concentrate more on products related to younger generation. 6. Most of the people visit the store because of the discounts offered and the store should try and make them more attractive. 7. Further people feel that there is not much discount offered in the grocery section which is the most popular section. The store should try and increase the discount in this particular section then only it will be able to operate successfully in the competitive time to come. 8. People are generally unaware of offers at Vishal Mega Mart because of poor advertising and promotional strategies. It should increase the number of adds in the print media and should also give adds in the local electronic media. 84
  • 85. 9. Clarity of signages can be improved by increasing the number of signages and making them attractive. 10. No. of footfalls can be increased by improving upon the ambience and the restaurant. 11. Till date Vishal Mega Mart is the only player in organized general merchandising in Dehradun and thus is enjoying the benefits of monopoly. In the absence of competition people are finding it fair enough because there is no other such store so far with which its performance can be compared. But in the time to come many big players like Big Bazaar, Reliance etc. are also planning to enter Dehradun. Thus it should recognize and improve upon its weak areas and convert its strong areas into strategic advantage. 85
  • 86. References 1. Retail management by Chetan Bajaj. 2. Marketing Management by Philip Kotler. 3. Economic survey 2005-2006 by govt. of India. 4. Marketing research by Malhotra 5. Ministry of Agriculture Annual Report 2005-06 6. www.mpmandiboard.com 7. www.pantaloon.com 8. www.rpggroup.com 9. www.ficci.com 10. www.retailbiz.com 11. www.fciweb.nic.in 12. http://fcamin.nic.in 13. www.indiatimes.com 14. www.mckinseyquarterly.com 15. www.atkearney.com 16. www.retailyatra.com 86
  • 87. Appendix Objective: To study the impact of Vishal Mega Mart on Buying behavior of customers in Dehradun City * Questionnaire Name ……………………………… Age: ………. Address…………………………………………… Contact no.………………………… ….………………………………………... Gender ……….. Occupation ………………………. Monthly Income (in Rs.) a. < 5000 b. 5000-10000 c. 10000-20000 d. 20000-30000 e. > 30000 Total Monthly expenditure on shopping a.< 1000b. 1000-2000 c.2000-3000 d. 3000-5000 e. >5000 Shopping Behavior 1) I have started coming for shopping with my family now a) Strongly agree b) Agree c). Neither agree nor disagree d) Disagree e) Strongly Disagree 2) When I buy from VMM, I buy more than what I plan a) Strongly agree b) Agree c). Neither agree nor disagree d) Disagree e) Strongly Disagree 3) I have stopped visiting the old shop I used to visit a) Strongly agree b) Agree c). Neither agree nor disagree d) Disagree e) Strongly Disagree Consumer perception & attitude towards VMM as a brand 4) Vishal Mega Mart offers a unique shopping experience a) Strongly agree b) Agree c). Neither agree nor disagree d) Disagree e) Strongly Disagree 5) Rate your shopping satisfaction level at VMM on the scale of 1-10 1 2 3 4 5 6 7 8 9 10 6) Rate efficiency at billing counters of VMM on the scale of 1-10 1 2 3 4 5 6 7 8 9 10 7) Rate layout of VMM on the scale of 1-10 1 2 3 4 5 6 7 8 9 10 87 1 2 3 4 5 6 7 8 9 10
  • 88. 8) I will definitely come again to VMM for shopping a) Strongly agree b) Agree c). Neither agree nor disagree d) Disagree e) Strongly Disagree 9) Rate following sections of Vishal Mega Mart on a scale of 1 to 5 (1 being poor and 5 being Outstanding) a. Grocery/ 1 2 3 4 5 b. Apparel 1 2 3 4 5 Canned food c. Kids 1 2 3 4 5 d. Foot wear 1 2 3 4 5 e. House hold g. f. Others 1 2 3 4 5 1 2 3 4 5 h. Restaurant 1 2 3 4 5 i. Overall 1 2 3 4 5 Perception about Products and services 10) Rate quality of products at VMM on the scale of 1-10 1 2 3 4 5 6 7 8 9 10 11)Rate product variety at VMM on the scale of 1-10 1 2 3 4 5 6 7 8 9 10 12) Products offered at Vishal MM are trendy and of latest style a) Strongly agree b) Agree c). Neither agree nor disagree d) Disagree e) Strongly Disagree 13) The way products are displayed makes me buy more than what I plan a) Strongly agree b) Agree c). Neither agree nor disagree d) Disagree e) Strongly Disagree Price 14) Keeping the quality of products in mind, most of products at VMM are expensive a) Strongly agree b) Agree c). Neither agree nor disagree d) Disagree e) Strongly Disagree 15) Rate your satisfaction level regarding prices of products at VMM on the scale of 1-10 1 2 3 4 5 6 7 8 9 10 16) I visit VMM because of less price or discounts offered a) Strongly agree b) Agree c). Neither agree nor disagree d) Disagree e) Strongly Disagree 17) I generally buy those items which are offered with discounts a) Strongly agree b) Agree c). Neither agree nor disagree d) Disagree e) Strongly Disagree 88
  • 89. Promotions 18) The discount offers at VMM are usually tempting a) Strongly agree b) Agree c). Neither agree nor disagree d) Disagree e) Strongly Disagree 19) I am generally aware of all offers at VMM a) Strongly agree b) Agree c). Neither agree nor disagree d) Disagree e) Strongly Disagree 20) Rate your satisfaction level regarding the clarity of signages carrying information about offers and discounts inside VMM 1 2 3 4 5 6 7 8 9 10 21) I come to VMM because I find advertisements of VMM effective a) Strongly agree b) Agree c). Neither agree nor disagree d) Disagree e) Strongly Disagree 22) Rate the following influencing factors on the scale of 1 to 5 (1 being least influential & 5 being most influential) which make you visit Vishal Mega Mart? b. Discount 1 2 3 4 5 d. Ambience 1 2 3 4 5 e. A good time pass destination 1 2 3 4 5 g. Self selection Facility 1 2 3 4 5 e. All items under one roof 1 2 3 4 5 23) How would you rate the behavior of employees on the scale of 1-10 1 2 3 4 5 6 7 8 9 10 89