1. NOTE ON THE INTERIM REPORT
The report of the International Monetary Fund (IMF)— Stand-By Arrangement—Review
Under the Emergency Financing Mechanism—presents the findings of an IMF staff visit to
Athens during June 14-18, 2010. The visit was conducted in cooperation with the European
Commission and the ECB. The purpose of the visit was to conduct an interim review of
economic developments and policy implementation, as called for under the Fund’s
Emergency Financing Mechanism (EFM). The report confirms the preliminary conclusions
of the interim mission, (see Press Release No. 10/246). In particular, the program appears to
be broadly on track as authorities are making considerable progress in putting public finances
on a sustainable path and are implementing major reforms, including of the pension system,
ahead of schedule. A more comprehensive review of the program is scheduled for July 26-
August 6, 2010. Completion of this comprehensive review by the Fund’s Executive Board—
expected in early September—will make the next tranche under the stand-by arrangement of
SDR 2.1627 billion (about US$3.27 billion) available to the Greek authorities.
3. INTERNATIONAL MONETARY FUND
GREECE
Stand-By Arrangement—Review Under the Emergency Financing Mechanism
Prepared by the European Department in Consultation with Other Departments
Approved by Poul Thomsen and Martin Mühleisen
June 30, 2010
Executive Summary
Overarching strategy of the program. The authorities are making progress to put the public
finances on a sustainable path, complemented with structural reforms to boost competitiveness and
growth, while seeking an equitable distribution of the adjustment burden across all levels of society
and protecting the most vulnerable.
Economic activity is declining as expected with the downturn projected to become more acute as
the year goes on. The decline is led by cuts in government spending, with some latent buoyancy in
private consumption. Inflation is running higher than expected as indirect tax increases are not
(even partially) absorbed in margins. Unit labor costs are, however, moderating considerably, and
unemployment is rising.
State budget implementation is on track with good expenditure control. However, hospitals and
social security funds present clear risks, as do financial pressures in public enterprises. These three
areas are not directly controlled by the state budget and require more attention. The pension reform
contains significant reductions in future pension costs, even though it is not clear that the
authorities can bring them down from 12.5 ppts of GDP before the reform to 2.5 ppts in one step,
as aimed in the program. A full actuarial assessment of the reform will take more time than
foreseen in the program.
Banks face continued liquidity pressures and some solvency erosion but plans are in place to
deal with this. Sharp downgrades of the sovereign led to margin calls on collateralized borrowing.
Deposits also are quite soft. That said, the European Central Bank (ECB) is assisting Greek banks
to tide them over the liquidity crunch. NPLs are rising but banks’ capital remains well above the
regulatory minimum and the Financial Stability Fund is nearly in place.
Structural reforms are progressing. The authorities announced a privatization program, labor
reforms, a local government reform, and initiatives to liberalize closed professions. They are ahead
of schedule in setting up a public sector employment and wage census.
Discussions took place on June 14‒18 with the Minister of Finance, Governor of the Bank of
Greece (BoG), Minister of Labor and Social Security, Minister of Interior, and staff in these and
other ministries and agencies, and private banks.
Staff comprised P. Thomsen (head), B. Traa, G. Everaert, M. Moreno Badia (all EUR); S. Eble and
M. Soto (FAD); and Y. Sun (SPR). O. Frecaut and L. Zanforlin (MCM) and B. Jansen and A.
Gullo (LEG) conducted a parallel TA mission on the Financial Stability Fund, and assisted the
interim review mission, as did two parallel FAD TA teams in Public Financial Management and
Expenditure Policy.
4. 2
Contents Page
I. Introduction ............................................................................................................................3
II. Recent Developments and Outlook .......................................................................................3
III. Policy Implementation .........................................................................................................8
A. Fiscal Policy ............................................................................................................10
B. Financial Sector .......................................................................................................12
C. Structural Policy and Data Reporting......................................................................14
IV. Staff Appraisal ...................................................................................................................15
Boxes
1. Inflation ............................................................................................................................... 7
2. The Pension Reform ......................................................................................................... 11
3. Update on the Financial Stability Fund ............................................................................ 13
4. Public Sector Employment and Wages Census ................................................................ 15
Figures
1. Financial Indicators, 2007–10 ............................................................................................. 4
2. Selected Indicators, 2000–10 .............................................................................................. 5
3. Labor Markets, 2001‒10 ..................................................................................................... 6
4. Money and Banking Indicators, 2005–10 ........................................................................... 9
Tables
1. Quantitative performance Criteria .................................................................................... 18
2. Structural Conditionality for 2010 .................................................................................... 19
3. Selected Economic Indicators ........................................................................................... 20
4. General Government Operations, 2009–15 ...................................................................... 21
5. Public Sector Financing Requirements and Sources ........................................................ 22
6. Summary of Balance Payments, 2009–15 ........................................................................ 23
7. External Financing Requirements and Sources, 2008‒15 ................................................ 24
8. Core Set of Financial Soundness Indicators for Deposit Taking Institutions, 2000–10 ... 25
9. Access and Phasing under the Proposed Stand-By Arrangement, 2010–13 ..................... 26
10. Indicators of Fund Credit .................................................................................................. 27
11. Monetary Survey............................................................................................................... 28
12 Modified General Government Cash Balance for Program Monitoring. ......................... 29
5. 3
I. INTRODUCTION
1. The mission took place in the context of the Emergency Financing Mechanism
(EFM). On May 9, 2010 the Executive Board approved a three-year Stand-By Arrangement
(SBA) for Greece under the EFM in the amount of SDR 26.4 billion (3,212 percent of quota).
The first purchase was €5.5 billion (SDR4.8 billion) upon SBA approval. The euro-zone
partner countries committed €80 billion, and made a first disbursement of €14.5 billion. The
EFM procedures call for a full review of the initial policy response and the reaction of
markets to these policies within one to two months of the approval of the arrangement.
II. RECENT DEVELOPMENTS AND OUTLOOK
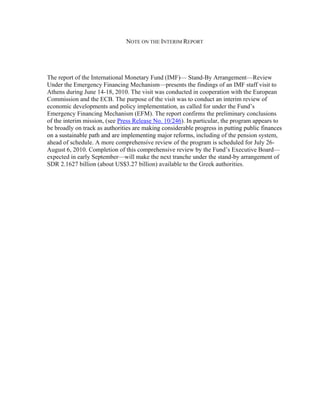
2. Markets are still skeptical and spreads are too high. Sovereign spreads dropped
sharply after the stand-by arrangement was approved, also supported by the ECB purchases
of Greek bonds—which are estimated at some €25 billion to date.1 Nevertheless, after
Moody’s 4-notch downgrade of the Greek sovereign on June 14 to below investment grade,
the benchmark 10-year bond spread over equivalent German issues rose again and reached
close to 800 bps subsequently, amid thin market trading (Figure 1).2 In the wake of this
downgrade, some continued pressure is evident as many index funds now have to divest their
holdings of Greek bonds. Speculation that Greek debt restructuring may have only been
postponed, rather than decisively put to rest, clearly weighs on sentiment. Evidence needs to
build that the program is being fully implemented, supported by social consensus and with
prospects for a growth recovery.
3. Economic activity is contracting in line with expectations, but inflation is higher
than anticipated. The drop in Q1 real GDP by 2.5 percent (year-on-year) was in line with
program projections and driven by a sharp cut in public consumption and investment (Figure
2). Private consumption was surprisingly resilient reflecting possibly some capture of
previously informal activity following a tax-administration campaign that obliges vendors to
issue VAT receipts to clients. Further, preliminary data up to March show that the external
trade deficit remained high reflecting higher oil prices and increased payments for ship
orders, reflecting a recovery in the shipping industry.3 Imports excluding oil and ships
declined (by 6.5 percent year-on-year), while exports and tourism still were soft.
Unemployment edged up to 10.8 percent (SA) by end-March 2010 (Figure 3). Year-on-year
inflation reached 5.3 percent at end-May, with an apparent large pass-through to prices of the
excise and VAT measures (Box 1).
1
The policy agreement on the large package of measures for the program was announced in early May, but the
spreads continued to rise until the day of approval in the Board and the announcement, on the same day, of the
new European Support Mechanism.
2
Moody’s had been an outlier, rating Greece much higher than S&P and Fitch, so a catch up downgrade was
not unexpected. Nevertheless, the large jump down unsettled the markets.
3
Some delayed EU transfers widened the CA deficit in Q1, but are expected to help in Q2.
6. 4
Figure 1. Greece: Financial Indicators, 2007–10
The stock market is down y/y... …led by bank equities.
120 120 130 130
Selected Stock Market Indices Bank Equities
(Average 2007=100) (2007=100)
110 110
100 100 Bank of Greece
Alpha Bank
90 90
EFG Eurobank
80 80
Piraeus Bank
70 70
60 60
50 50
Greece
40 40
U.S. S&P 30 30
Germany DAX
20 20 10 10
Jan-07 Sep-07 May-08 Jan-09 Oct-09 Jun-10 Jan-07 Sep-07 May-08 Jan-09 Oct-09 Jun-10
Banks' spreads are increasing. Sovereign spreads are up in the short-...
900 900 20 20
Fair Value Bond Spread Over Libor Government Interest Rates
(Basis points) (Percent)
National Bank of Greece 16 16
Greece 2-year bond
Alpha Bank
600 600
EFG Eurobank 12 Greece-German spread over 2- 12
year bonds
8 8
300 300
4 4
0 0 0 0
Jan-07 Sep-07 May-08 Jan-09 Oct-09 Jun-10 Jan-07 Sep-07 May-08 Jan-09 Oct-09 Jun-10
...and long-maturity end... …as are credit def ault swaps spreads.
14 14 1000 1000
Government Interest Rates Sovereign 5-Year Credit Default Swaps
(Percent) (Basis points)
12 12
800 800
Greece 10-year bond Greece
10 10
Germany
Greece-German spread over 10- 600 600
8 year bonds 8
6 6 400 400
4 4
200 200
2 2
0 0 0 0
Jan-07 Sep-07 May-08 Jan-09 Oct-09 Jun-10 Jan-07 Sep-07 May-08 Jan-09 Oct-09 Jun-10
Sources: Bloomberg; and Moody's Creditedge.
7. 5
Figure 2. Greece: Selected Indicators, 2000–10
(Year-on-year percent change, unless otherwise indicated)
The economy is contracting as expected... ...led by poor sentiment...
10 10 25 125
Contributions to GDP Growth Economic Sentiment, SA
8 Domestic demand 8 (Percent balance)
Net exports
6 6 0 100
GDP Growth
4 4
2 2 -25 75
0 0
-2 -2 -50 Industry 50
-4 -4 Consumer
Composite (right scale)
-6 -6 -75 25
2005Q1 2006Q1 2007Q1 2008Q1 2009Q1 2010Q1 Jan-05 Jan-06 Jan-07 Jan-08 Jan-09 Jan-10
...and the PMI is in contractionary territory. Industrial production is declining,...
70 70 15 15
PMI Manufacturing
(Index, 50=neutral) Industrial production
10 HP trend 10
60 60
5 5
50 50 0 0
-5 -5
40 Overall 40
-10 -10
New orders
30 30 -15 -15
2000 2002 2004 2006 2008 2010 2000 2002 2004 2006 2008 2010
...building permits are down by 25 percent y/y,... ...albeit HH consumption was resilient in 2010Q1.
75 75 15 15
(12 Months moving average)
10 10
50 50
5 5
25 25
0 0
-5 -5
0 0
-10 -10
-25 Building permits -25 Retail trade
-15 -15
HP trend HP trend
-50 -50 -20 -20
2000 2002 2004 2006 2008 2010 2000 2002 2004 2006 2008 2010
Sources: National Statistical Service; Eurostat; and IMF staff calculations and estimates.
8. 6
Figure 3. Greece: Labor Markets, 2001‒10
(Year-on-year percent change, unless otherwise indicated)
Unemployment has increased... ...and labor productivity is down.
6 12 6 6
Labor Productivity, SA
Employment growth, SA
Unemployment rate, SA (right scale)
11 4 4
4
10 2 2
2
9 0 0
0
8 -2 -2
Greece
Euro area
-2 7 -4 -4
2001 2004 2007 2010 2001 2004 2007 2010
Wages have started to adjust... ...but ULCs are still above the euro area.
16 16 12 12
Wages and Salaries per Employee, SA Nominal Unit Labor Cost, SA
14 14
10 10
12 12
8 8
Greece Greece
10 10
Euro area 6 Euro area 6
8 8
4 4
6 6
2 2
4 4
0 0
2 2
0 0 -2 -2
2001 2004 2007 2010 2001 2004 2007 2010
Sources: Eurostat; and IMF staff calculations.
9. 7
Box 1. Inflation
Inflation developments up to May reflect indirect tax increases. May inflation can be
decomposed into the effect of tax increases (4 ppts) and non-tax price developments
(1.3 ppts). The tax contribution to inflation has increased from 16 percent in January to
74 percent in May, while non-tax related price inflation has been falling only gradually.
Nontax downward price rigidities are a clear concern. The very high pass-through of
indirect taxes to final prices is indicative of poorly contested domestic markets—an area
where structural reforms are crucial. Inflation at constant taxes, while falling, remains
relatively high despite sharply falling activity. The impression is that unit labor costs are
at last moderating, but margins are rigid, and suppliers’ competition insufficient.
6 6 6 6
Overall Inflation Overall Inflation
(Year-on-year percent change) (Year-on-year percent change)
5 5 5 5
Inflation at constant tax rates
Tax price increases
4 4 4 4
3 3 3 3
2 2 2 2
1 Greece HICP 1 1 1
Greece core
Euro core
0 0 0 0
2007 2008 2009 2010 Jan-10 Feb-10 Mar-10 Apr-10 May-10
Sources: Eurostat; ELSTAT; and IMF staff estimates and calculations.
4. The state budget deficit reduction is broadly on track even though there are
risks. The January-May cash balance of the state budget (including military spending) was
much better than programmed (by €3.5 billion, or 1.5 percent of GDP), reflecting overall
revenues largely on track, and strong spending control. Available data through April however
suggest that health care costs are running high and that social security and local government
accounts are underperforming (by €1.5 billion, or 0.6 percent of GDP), which partially
offsets the strong state budget performance. Meanwhile, financing conditions for state-owned
enterprises have been affected by the sovereign crisis and an estimated €1.5 billion in
guarantees could be called during 2010, which would increase the debt, as has occurred in
the past.
10. 8
5. The banking sector remains under strain.
Liquidity conditions are tight. Banks face difficulties in renewing liabilities as
market confidence has not yet been restored and spreads have not yet resumed their
downward trend. The Moody’s 4-notch downgrade on June 14 triggered further
margin calls, leading to additional collateral needs, including with the ECB. While
Greek sovereign paper remains eligible with the ECB, it is subject to a 5 percent
higher haircut, because the recent downgrade means that two rating agencies now rate
Greece as non-investment grade. This put renewed pressure on banks’ liquidity
positions, which had gotten some respite after the program approval and ECB bond
market assistance. Nevertheless, the approval of a banking support package for €15
billion in additional guarantees in May and continued ECB liquidity assistance have
bolstered the resistance of the banking system (Figure 4).
Banks’ solvency buffers remain adequate, with some erosion. As expected, the
quality of banks’ loan portfolios declined slowly with the economic downturn. NPLs
increased from 7.7 percent of total loans in December 2009 to 8.2 percent as of
end-March 2010 and the NPL coverage ratio with provisions has dropped. The
system-wide capital adequacy ratio declined from 13.2 percent in December 2009 to
12.9 percent as of end-March 2010, as foreseen, but remains well above the 8 percent
regulatory minimum. Partial data available for April and May 2010 indicate further
slippage, with some differentiation among banks. Although banks’ pre-provisioning
operating income has remained stable at elevated levels, the need for larger
provisions against NPLs has driven the banking system as a whole into a loss after
including provisioning and taxes.
III. POLICY IMPLEMENTATION
6. Key commitments are being implemented and there is progress toward
medium-term reforms, yet challenges remain. Implementation of agreed fiscal policies is
delivering results as the authorities appear broadly on track to comply with end-June
quantitative PCs. There is also progress on structural reforms, not least what is set to be a
substantial overhaul of the pension system, with significant TA involvement. Banking sector
stability is challenging but is being maintained—with the ECB crucially helping banks meet
their funding needs—and with progress to establish the FSF. The authorities are working
hard to address challenges in the face of stretched capacity to implement multiple program
points.
11. 9
Figure 4. Greece: Money and Banking Indicators, 2005–10
HH credit growth is slowing... ...and so is corporate credit.
40 40 25 25
Household Credit Corporate Credit
(Year-on-year percent change) (Year-on-year percent change)
30 30 20 20
20 20 15 15
10 Total 10 10 10
Housing
Consumer credit
0 0 5 5
-10 -10 0 0
2005 2006 2007 2008 2009 2010 2005 2006 2007 2008 2009 2010
Real interest rates have fallen. Market access and deposits have declined.
12 12 30 30
Real Interest Rates on Funding
New Loans with Charges (Quarter-on -quarter percent change)
10 10 20 20
(Percent)
8 10 10
8
6 0 0
6
Housing
4 -10 -10
Consumer
4
2 -20 Retail deposits -20
Interbank deposits
0 2
-30 -30
2008Q4
2009Q1
2009Q2
2009Q3
2009Q4
2010Q1
-2 0
2005 2006 2007 2008 2009 2010
Banks have issued some debt in 2010 for collateral use at the ECB.
10 10
Issuance by the Private Financial Sector
(Billions of euros)
8 8
6 6
4 4
2 2
0 0
2005Q1 2005Q3 2006Q1 2006Q3 2007Q1 2007Q3 2008Q1 2008Q3 2009Q1 2009Q3 2010Q1
Sources: National Statistical Service; Bank of Greece; Bloomberg; ECB; and IMF staff calculations.
12. 10
A. Fiscal Policy
7. Implementation is progressing and risks need to be managed to ensure the
program remains on track. Nearly all fiscal measures for 2010 have been implemented4,
and are expected to yield a boost to revenue and another round of savings in the second half
of the year. However, performance in the health sector, social security, local governments,
and in public enterprises could deteriorate, posing risks.5 In health, accounts payable have
increased to an estimated €840 million, and are planned to be reduced over the next 4‒6
months. This is crucial so that these do not spill over into becoming arrears—a problem that
has occurred in the past. A monitoring mechanism for arrears is being developed but is still
not fully in place. Also, owing to project implementation delays and administrative lags,
delays in structural EU fund disbursements may not be fully overcome during this year,
despite good faith efforts, and revenue from EU funds’ disbursements could thus still come
in weaker.6 The authorities have been taking actions to deal with those risks through tight
execution of discretionary state budget spending, reductions in the costs of pharmaceuticals
(20 percent price cut in an approved “drugs list” and tight monitoring of prescriptions), closer
monitoring of hospital budgets, and advancing with the privatization program. Also, TA is
helping to establish commitment registers, identify contingency measures, and firm up
medium-term expenditure savings. Program monitoring has improved as the authorities
strengthened internal budget forecasting, monitoring, and reporting in line with program
requirements with assistance from EC/ECB/Fund staff.
8. Progress on improving fiscal management is underway. To strengthen overall
fiscal strategy and implementation, the fiscal management bill (end-June structural
benchmark) will introduce an annual rolling three-year fiscal and budget strategy for the
consolidated general government; establish top-down budgeting with medium-term
expenditure ceilings for the state budget; strengthen commitment controls; require
supplementary budgets for overspending; modernize fiscal audits; and strengthen
accountability and transparency including by creating a parliamentary budget office.
Preparation of the draft law is supported by IMF technical assistance and it is expected to be
in parliament by end-June.
9. The draft pension bill is making progress... The draft bill introduces a flat pension
and a proportional component and includes changes to key parameters that will reduce future
pension costs significantly such as through lower average replacement rates and higher
effective retirement ages (Box 2).
4
The reduction in the higher pensions (savings of €350 million) and in pensions of the power and telecoms
company employees (savings of €150 million) await final steps to become effective.
5
Also, the growing guarantee program for the financial sector implies a buildup of contingent risks; even
though this does not have a fiscal cash flow implication in the very short run other than fees for the government.
6
EU structural funds are earmarked for investment spending, thus their delay has little effect on the deficit, but
it could affect growth in the economy.
13. 11
Box 2. The Pension Reform
The reform seeks to improve long-run sustainability of the retirement system, simplify the
system, and increase labor force participation. The staff estimates that the proposed changes will
substantially slow down the increase in pension spending through 2060, which could come down from
12.5 ppts of GDP to around 4‒6 ppts of GDP (the main source of uncertainty relates to costs of
supplementary pensions, which require further analysis). Key reform elements are:
Accrual rates/generosity: The old system has different accrual rates across pension plans.
The new law proposes one profile of accrual rates for all workers, bringing these down from
2‒3 percent a year to a much lower range of 0.80‒1.50 percent a year, depending on the years
of service. This measure simplifies the pension system and reduces costs. It creates incentives
to participate longer as the accrual rate is progressive with working life.
Retirement age/years of contributions: The old system often allowed workers to claim full
benefits before age 60. The proposed system sets the minimum age of retirement at 60 for all
workers (men and women); requires 40 years of contributions to receive full benefits; and
reduces benefits by 6 percent a year for those who claim before age 65 without 40 years of
contributions. In addition, the two anchors (60 and 65 years of age) will be indexed to life
expectancy going forward.
Arduous professions: The reform requires a revision of the list of arduous occupations to
reduce claims in these categories.
Calculation of pensionable earnings: The current system uses the top 5 years of the last
10 years of earnings as the pensionable base. The new law will use the full earnings history to
calculate pensionable earnings.
Indexation of pensions: The current system tends to adjust pensions with wage growth. The
proposed system caps indexation at inflation.
Simplification: the new law merges some 13 funds into three, roughly corresponding to those
for private sector workers, the self-employed, and other remaining categories of workers.
Safeguard clause: if actuarial analysis suggests that the reform falls somewhat short of the
final objective to reduce increases in future pension costs to 2.5 ppts of GDP, then a
Ministerial Decision can lower costs further by a combination of adjusting parameters of the
system, the basic pension, and supplementary pensions to achieve the final objective.
10. ...even though an actuarial evaluation may take more time to be completed. The
National Actuarial Authority (NAA) has engaged in the time-consuming task of integrating
the main components of the reform into its models. A full actuarial assessment of the reform
will not be ready for the end-June structural benchmark. Nonetheless, the NAA is likely to
provide a basic evaluation of the impact of the proposed reform on the largest pension plans
by the first review mission scheduled for end-July. Preliminary results suggest that the
reform will reduce incremental pension spending substantially (perhaps by 6½‒8½ ppts of
GDP), which is short of the goal of bringing down the incremental pension costs over the
14. 12
period 2010‒2060 by 10 ppts of GDP (from 12.5 ppts of GDP) as aimed for in the program.
The authorities are committed to engage in subsequent further cost-reductions to deliver the
intended goal if the more complete actuarial results indicate that this were necessary.
However, because the political window of opportunity is narrow, the authorities want to
bring the bill on this ambitious reform to parliament before its summer recess, even before
the actuarial studies are finished.
11. The authorities are confident that they can place T-bills in July and October,
despite difficult market conditions. The demand for T-bills by Greek banks remains strong,
buoyed also by the liquidity support from the ECB, although non-resident demand may be
muted. The authorities plan to continue accessing the T-bill market during the program
period on a regular basis to facilitate short-term cash management for the budget and
gradually to prepare the way for opening up access to longer-dated maturities.
B. Financial Sector
12. The authorities are taking further measures to support bank liquidity. The
measures taken so far have proved crucial and preserved the stability of the system.
Nevertheless, the margins of safety they provide have been compressed by the effects of the
latest downgrade and the authorities aim to restore comfort through an additional installment,
currently under study, of new government guarantees (which could provide increased
collateral at the ECB).
13. The Financial Stability Fund (FSF) is nearly in place. Substantial progress—with
detailed inputs from the EC, ECB, and IMF—has been made in the finalization of the
legislation on the FSF (Box 3) to ensure that this capital backstopping facility becomes
available soon. The legal establishment of the FSF is an end-June structural benchmark and
the authorities are expected to provide the financing for the fund in September and
December. In the unlikely case that earlier financing were needed, this could be bridged with
T-bill placements or by drawing down cash balances. An update of stress test is planned for
September to incorporate the latest developments on potential capital injection needs.
14. Private-sector exposure to Greece is difficult to gauge because of confidentiality
provisions, which is complicating engagement of PSI. Foreign regulators are prevented
from sharing available data on bank exposures to Greece with the ECB and the Fund because
of confidentiality restrictions. Preliminary statistics (from the BIS and other sources) indicate
that Greek banks’ liability to non-resident financial institutions have remained broadly stable,
but no precise data are available. Announcements by German, French, and Dutch banks to
maintain exposures to Greek debt coincided with their home countries’ parliamentary votes
on the Greece support package. German banks have committed to uphold credit lines and
report exposures to the German regulator. Thin trading volume in Greek paper suggests little
change in investor composition, although precise information on this is sketchy. The
authorities are considering a road show following completion of the first review, when the
first critical set of achievements under the program is available, to bolster further support for
Greece and improve investor sentiment.
15. 13
Box 3. Update on the Financial Stability Fund
Establishment. The legislation for the FSF is expected to be approved by Parliament
in July. The FSF will be endowed with €10 billion to be disbursed in equal
installments in September and December.
Governance. The Board will be composed of seven members, five of which will be
nominated by the Governor of the Bank of Greece and then appointed by the latter
and the Minister of Finance. The remaining two members wil be the Deputy Governor
of the Bank of Greece and the Secretary General of the Ministry of Finance, acting on
an ex officio basis. The entity will be independent and autonomous. Internal auditing
functions will be established to ensure good governance. The FSF will provide
monthly balance sheets and annual audited financial statements to the Greek
Parliament, Minister of Finance, Governor of BoG, and the Greece staff teams of the
EC, ECB, and the Fund.
Capital support for banks: Modalities of capital injection will vary depending on
the initial capital of banks:
(1) Capital above regulatory limits but declining. In this case, banks can request
access to the FSF or the BoG could recommend the institution to apply if it fails
to raise additional capital in the market. The FSF will decide to provide resources
following presentation of a restructuring plan and a recommendation of the BoG.
Capital is injected through preference shares which would be converted into
common shares if targets identified under the restructuring plan are breached or if
the capital ratios are not complied with.
(2) Capital below pillar 2. The BoG will have the power to impose sanctions as
provided for in the banking law if the credit institution fails to follow the BoG
recommendations. The BoG may recommend that the FSF invest in the credit
institution. The terms of the support provided by the FSF will be the same as
above.
(3) Capital below pillar 1. Subject to a recommendation of the BoG, the FSF will
provide support to the credit institution upon presentation of a strong restructuring
plan and only after a formal audit of the accounts to ensure all existing losses are
recognized and absorbed by existing shareholders. In this case the FSF will only
provide common shares.
Alternatively, instead of taking the measures described under (2) and (3) above, the
BoG may also appoint a commissioner or revoke the license of the problem banks.
16. 14
C. Structural Policy and Data Reporting
15. The authorities are making progress with the large structural reform agenda:
The sub-central government reform (Kallikratis) was approved in Parliament
(end-June structural benchmark), and a reorganization of local governments and their
multiple entities has started. This will reduce the number of local administrations,
entities, and elected and appointed officials, with important fiscal savings although
final estimates are lacking. At the same time, the law envisages some devolution of
powers to the local authorities. Assurances should be put in place that spending
control and borrowing at the sub-national level remains tight, and fiscal policy
remains well-coordinated across the general government.
Progress is being made with establishing the Single Payment Authority, which will
improve transparency and control over the wage bill (Box 4).
The government is launching much-needed reforms in the important public enterprise
sector. In railways, legislation is being prepared to restructure the train operator. In
addition, the government has announced a privatization agenda, which will be further
discussed at the time of the first review.
Other areas where legislation is currently in the drafting stage include a significant
labor market reform and liberalization of road transportation (trucking). Preparatory
work on structural reforms in the product markets is ongoing with heavy involvement
of the EC (particularly on the Services Directive and the liberalization of professional
services). These will be further discussed at the first review.
16. The authorities are improving data quality. Data reporting mechanisms now
appear to be in place for the most problematic public enterprises, in support of public
enterprise reform and privatization. Elsewhere, the President of the newly independent
Statistical Office (ELSTAT) has been identified and his (her) appointment is expected to be
approved by Parliament by early-July, while the selection of the Council of the Hellenic
Statistical System is almost completed. Although progress has been made in data collection,
cooperation of ELSTAT with data providers needs to be improved further, particularly in the
areas of health and social security where important data shortfalls continue to plague the
interpretation of developments and emergence of concomitant fiscal risks. For that purpose,
MoUs are being drafted and a statistical correspondent will be appointed for each of the
data-providing institutions to seek compliance. A resident expert appointed by Eurostat is
working closely with the authorities to develop regulations of statistical obligations. Efforts
are being made to compile quarterly data of the ESA95 general government using direct data
whenever possible (this was not possible before), with Q1 data expected to be available in
early July. Progress with the implementation of the joint Greek government and EC statistical
action plan and the follow up on the K-1 Report on misreporting that was discussed in the
Executive Board will be discussed in the first review.
17. 15
Box 4. Public Sector Employment and Wage Census
The authorities are implementing a public employment and wage census to
improve transparency over the wage bill. Precise data on general government
employment numbers and wage compensation are notoriously lacking in Greece. The
census is therefore timely and works toward meeting an end-December structural
benchmark. The census will take place July 12‒23 and have the following key
characteristics:
Coverage will be broad. It will include the state budget and social security
funds by end-September, and by February 2011 the general government
(including the military). The type of employment covered will also be broad,
including all permanent employees and employees under contracts.
Type of compensation will include all wages, allowances, and bonuses,
including irregular payments such as overtime.
Implementation pilot. A pilot has been conducted for November 2009, and
has achieved coverage of about 80 percent of the general government. The key
missing groups were in education and local governments which are highly
dispersed.
Expected savings will result from cross-checking eligibility for allowances with
information provided to the tax authority (such as tax returns), and from
monitoring the amount of allowances paid. This availability of information on the
amount of allowances paid and employment will importantly enhance
accountability.
IV. STAFF APPRAISAL
17. The authorities have made a strong start with the program, but challenges also
remain evident. Staff is impressed with the determination of the authorities to make the
program a success. Their task is made more difficult by continued social anxiety over the
impact of the measures and the authorities are concerned about the repeated skepticism in the
press and among analysts whether Greece can work through the program without a debt
restructuring. Greece’s weak reputation is presenting credibility costs that can only be
overcome by strong and full implementation.
18. The economic response to the program has yet to play out fully, and the
program’s macro-framework will be reassessed in subsequent reviews. Since the
economy is relatively closed, the sharp cutbacks in public spending are beginning to affect
activity without a strong response yet from net exports. The authorities need to persevere in
18. 16
their efforts to open up the economy, and to improve tax administration which can help tap
into the large parallel economy where cushions of wealth and spending are located.
19. Inflation is too high. While the staff clearly underestimated the effects of indirect
taxes on headline inflation—we need to revise up the inflation projection in the first
review—the lack of evidence that any of the tax increases is being offset by narrower
margins in prices points toward serious rigidities in the product markets. The ministry of
economy needs to deepen and speed up product and services market reforms, in close
consultation with the European Commission.
20. Fiscal developments are encouraging, but risks need to be addressed. The state
government deserves recognition for well-executed and tight expenditures, while revenues
are broadly on track. Key risks emanate from health spending, social security accounts, local
governments, and public enterprises. Better data urgently need to be collected and processed,
and the deficits in these off-budget entities require a clear response. These problems have, in
fact, been festering for years, but have never been decisively addressed, causing “fiscal black
holes” that generate unexpected increases in debt as state guarantees are called and arrears
cleared. A demonstration of much stronger control over these entities can materially boost
fiscal credibility and help break the adverse trend in spreads.
21. A strong pension reform is essential to bolster fiscal sustainability and this vital
program for the public. While staff is confident that significant cost cutting is underway in
the draft pension reform law, concluding the discussions is made difficult by the absence of a
fully quantified actuarial analysis. Staff recommends strong actuarial underpinnings of the
pension reform, and if the authorities need to move to parliament fast with the law because
the window of opportunity is narrow (i.e. before all actuarial tests can be completed), then
adequate contingency plans need to be embedded in the law to correct possible shortfalls
once the actuarial results are in.
22. Banks’ liquidity problems and gradual solvency erosion require continued
vigilance. The assistance provided by the ECB and the fiscal authorities’ offer of guarantees
to the banking system to facilitate collateral material is vital and welcome. The FSF is almost
in place and will soon be endowed with substantial resources, ready to provide support if the
currently adequate levels of capital are not sufficient to absorb the expected further losses
due to the economic contraction.
23. Confidentiality considerations are complicating effective engagement of PSI.
Neither the private sector banks in various countries, nor the ECB in its program of Greek
government bond purchases, disclose details of their holdings and trading of Greek exposure.
Staff will continue to seek better information on such exposures, which would facilitate the
dialogue with the private sector.
24. The importance of very strong reforms for future growth cannot be
overestimated. Labor market reform under preparation is sound and needs to be
19. 17
implemented forthwith. However, product and services market reforms are too timid for now
and need to be strengthened and deepened. The thought persists that Greece’s closed nature
and inability to generate inflation below the euro-area average, even in the midst of a deep
recession, is evidence of poorly contested internal output markets. As expected, strong
resistance is being put up by closed professions (e.g. truckers, lawyers, notaries, architects,
etc.) and more needs to be done to overcome such resistance. This will also help generate
broad support for the program by preserving fairness in the distribution of the adjustment
burden between dependent labor, the self employed, and capital owners. The authorities can
send a further strong signal to the markets by being uncompromising in their resolve and
speed to privatize or close down the numerous state enterprises which have proven to cost tax
payers large sums of money, rather than yielding adequate dividends, and which may well be
obstacles to more efficient market structure as long as they remain in the public hands.
25. A safeguards assessment of the BoG is in progress and is expected to be completed
by the time of the first review of the SBA.
26. Next steps. The staff is encouraged by the progress so far in view of the difficult
situation the country faces. The first full review of the program will be conducted during a
mission to Athens at end-July, and Board discussion of this review is planned for early
September.
20. Table 1. Greece: Quantitative Performance Criteria (in billion of Euros, unless otherwise indicated)
Performance Criteria Indicative Targets
Jun-10 Sep-10 Dec-10 Jun-10 Sep-10 Dec-10 Dec-11 Dec-12 Dec-13
Progr. 1/ Progr. 1/ Progr. 1/ Progr. 1/ Progr. 1/ Progr. 1/ Progr. 2/ Progr. 3/ Progr. 4/
1. Floor on the modified general government primary cash balance -5.0 -4.0 -5.7 .. .. .. -2.1 2.4 7.4
2. Ceiling on State Budget primary spending 34 50 67 .. .. .. 67 68 69
3. Ceiling on the accumulation of new domestic arrears by the general government 5/ .. .. .. 0 0 0 0 0 0
4. Ceiling on the overall stock of central government debt 342 342 342 .. .. .. 365 .. ..
5. Ceiling on the new guarantees granted by the central government 2.0 2.0 2.0 .. .. .. 1.0 0.0 0.0
6. Ceiling on the accumulation of new external payments arrears on external debt
contracted or guaranteed by general government 5/ 0 0 0 .. .. .. 0 0 0
1/ Cumulatively from January 1, 2010 (unless otherwise indicated).
2/ Cumulatively from January 1, 2011 (unless otherwise indicated).
3/ Cumulatively from January 1, 2012 (unless otherwise indicated).
4/Cumulatively from January 1, 2013 (unless otherwise indicated).
18
5/ Applies on a continuous basis from April [30] onward.
21. Table 2. Greece: Structural Conditionality for 2010 1/
Measures Date Macrocritical relevance
Prior actions
1. Reduce public wage bill by cutting bonuses/allowances; and pension bonuses (except minimum pensions). Improves fiscal sustainability; has signaling effect for private sector
wage setting.
2. Increase standard VAT rate from 21 to 23 percent and reduced rate from 10 to 11 percent and excise tax rates on Improves fiscal sustainability.
alcohol, tobacco, and fuel with a yield of at least €1.25 billion in the remainder of 2010.
3. Appoint staff team and leader in GAO responsible for general government in-year cash reporting. Establishes in-year oversight responsibilities of general
government fiscal policy.
Structural benchmarks End-June 2010
1. Establish the independent Financial Stability Fund (FSF) to preserve the financial sector's soundness and thus its Enhances financial stability.
capacity to support the Greek economy by providing equity support to banks as needed.
2. Adopt and start to implement a reorganization of sub-central government with the aim to reduce the number of local Improves fiscal sustainability.
administrations and elected/appointed officials (Kalikrates).
3. Submit to parliament amendments to Law 2362/1995 to (i) require the MoF to present a three-year fiscal and budget Improves credibility of the budget and fiscal consolidation program.
strategy, (ii) introduce top-down budgeting with expenditure ceilings for the State budget and multi-year expenditure
estimates by line ministry, (iii) introduce standard contingency margins, (iv) require a supplementary budget for any
overspending above the contingency, (v) and introduce commitment controls. The amended law should be immediately
effective, including in the context of the 2011 budget.
19
4. The National Actuarial Authority to produce a report to assess whether the parameters of the new system significantly Reduces budgetary costs of ageing and improves long-term fiscal
strengthen long-term actuarial balance. sustainability. Increases labor force participation.
End-September 2010
1. Adopt a comprehensive pension reform that reduces the projected increase in public spending on pensions over the Improves fiscal sustainability.
period 2010-60 to 2½ percent of GDP.
2. Establish a commitment register in all line ministries and public law entities. Begin publishing monthly data on general Reduces budget overruns.
government in-year fiscal developments (including arrears).
3. Publish 2009 financial statements of the ten largest loss-making public enterprises, audited by chartered accountants, Increases transparency of fiscal risks to fiscal sustainability.
on the official website of the Ministry of Finance.
4. Put in place an effective project management arrangement (including tight MOF oversight and five specialist Achieves revenue targets and enhances sustainability of the
taskforces) to implement the anti-evasion plan to restore tax discipline through: strengthened collection enforcement and consolidation by increasing burden sharing of the adjustment.
recovery of tax arrears—coordinated with the social security funds—of the largest debtors; a reorganized large taxpayer
unit focused on the compliance of the largest revenue contributors; a strong audit program to defeat pervasive evasion
by high-wealth individuals and high income self-employed, including prosecution of the worst offenders; and a
strengthened filing and payment control program.
End-December 2010
1. Publish a detailed report by the ministry of finance in cooperation with the single payment authority on the structure Reduces wage escalation. Improves transparency of public sector
and levels of compensation and the volume and dynamics of employment in the general government. employment.
2. Adopt new Regulation of Statistical Obligations for the agencies participating in the Greek Statistical System. Enhance confidence in fiscal reporting and support the formulation
of fiscal policy.
3. Prepare a privatization plan for the divestment of state assets and enterprises with the aim to raise at least 1 billion Reduces state intervention in the real economy; improves market
euro a year during the period 2011-2013. efficiency; and cuts fiscal contingencies.
1/ Structural benchmarks for 2011 will be determined in the reviews for end-September and end-December 2010.
22. 20
Table 3. Greece: Selected Economic Indicators
2009 2010 2011 2012 2013 2014 2015
Proj.
(Percentage change, unless otherwise indicated)
Domestic economy
Real GDP -2.0 -4.0 -2.6 1.1 2.1 2.1 2.7
Output gap (percent of pot. output) 4.0 -1.1 -4.6 -4.7 -4.0 -3.7 -3.1
Total domestic demand -2.4 -7.1 -5.2 0.1 1.7 1.8 2.1
Private consumption -1.8 -4.0 -3.7 0.8 2.8 2.5 2.5
Public consumption 9.6 -10.6 -5.1 -3.6 -6.6 -3.2 -0.1
Gross fixed capital formation -13.9 -11.4 -11.8 0.8 4.8 3.5 2.3
Change in stocks (contribution) 0.0 -1.0 0.0 0.0 0.0 0.0 0.0
Foreign balance (contribution) 0.7 3.8 3.6 1.0 0.4 0.5 0.3
Exports of goods and services -18.1 4.5 5.4 5.9 6.0 5.9 6.0
Imports of goods and services -14.1 -9.7 -6.1 1.6 3.8 4.6 3.7
Unemployment rate (percent) 9.4 11.8 14.6 14.8 14.3 14.1 13.4
Employment -1.4 -2.6 -3.2 -0.2 0.7 0.3 0.9
Consumer prices (HICP), end of period 2.6 1.0 -0.5 0.7 0.8 1.2 1.0
Consumer prices (HICP), period average 1.3 1.9 -0.4 1.2 0.7 0.9 1.0
Core prices, period average 1/ 2.3 1.9 ... ... ... ... ...
GDP deflator 1.4 1.2 -0.5 1.0 0.7 1.0 1.1
(Percent of GDP)
Balance of payments
Current account -11.2 -8.4 -7.1 -5.6 -4.0 -2.8 -1.9
Trade balance -7.7 -3.5 -0.2 0.6 1.3 1.9 2.4
Export of goods and services 17.8 21.1 23.6 24.8 25.8 26.8 27.7
Imports of goods and services 25.5 24.6 23.8 24.2 24.5 24.8 25.2
Total transfers 0.5 0.4 0.5 0.5 0.4 0.4 0.3
Net income receipts -4.1 -5.2 -7.5 -6.7 -5.7 -5.1 -4.7
Net international investment position -83 -93 -101 -104 -104 -102 -100
Public finances (general government)
Total revenues 2/ 36.9 40.0 39.0 38.5 38.2 37.2 36.3
Total expenditures 2/ 50.4 50.5 53.2 53.9 54.0 52.3 50.6
Primary expenditures 2/ 45.4 44.9 46.6 46.5 46.0 43.9 42.5
Measures (cum.) 3/ … 2.5 6.7 9.0 11.0 12.6 12.2
Overall balance -13.6 -8.1 -7.6 -6.5 -4.8 -2.6 -2.0
Primary balance -8.6 -2.4 -0.9 1.0 3.1 5.9 6.0
Gross debt 115 133 145 149 149 144 139
Interest rates and credit
Long-term lending interest rate 4/ 5.7 5.8 ... ... ... ... ...
Private credit growth 4/ 5/ 4.2 3.5 ... ... ... ... ...
Exchange rates
Nominal effective exchange rate 6/ 0.7 -1.3 ... ... ... ... ...
Real effective exchange rate (CPI-based) 6/ 1.7 1.2 ... ... ... ... ...
Real effective exchange rate (man. ULC-based) 6/ 3.8 -0.5 ... ... ... ... ...
Memorandum item:
Nominal GDP (billions of euros) 237 231 224 228 235 242 251
Nominal GDP (percentage change) -0.7 -2.8 -3.1 2.1 2.8 3.1 3.8
Sources: National Statistical Service; Ministry of Economy and Finance; Bank of Greece; and IMF staff estimates.
1/ Core prices exclude energy, food, alcohol, and tobacco.
2/ Excluding unidentified measures.
3/ Measures fully identified up to 2013.
4/ As of March 2010.
5/ Domestic credit growth of households and enterprises.
6/ As of April 2010.
23. 21
Table 4. Greece: General Government Operations, 2009–15 1/
2009 2010 2011 2012 2013 2014 2015
Projections
(Euro billions)
Revenue 2/ 87.5 93.5 87.2 87.9 89.8 90.0 91.3
Taxes on production, and imports 26.4 32.0 28.8 29.4 30.5 32.1 33.3
Taxes on income, and property 18.8 18.3 16.9 17.0 17.4 18.5 18.9
Social contributions 30.4 29.1 27.8 27.7 27.7 28.8 29.3
Other 8.8 9.1 8.7 8.9 9.1 9.4 9.8
Capital transfers 3.1 5.0 5.0 5.0 5.0 1.2 0.0
Primary expenditure 2/ 107.9 99.1 104.2 106.1 108.0 106.2 106.9
Wages 29.5 26.9 27.6 27.1 26.7 26.6 27.2
Social benefits 48.8 47.9 52.0 53.8 55.0 56.5 57.9
Goods and services 14.5 11.0 10.6 11.2 12.1 12.2 12.3
Subsidies 0.3 0.3 0.3 0.3 0.3 0.3 0.3
Other current 3.9 3.7 3.7 3.7 3.8 3.8 3.8
Capital 10.9 9.4 10.0 9.9 10.0 6.9 5.4
Measures, cumulative … … 14.9 20.6 25.5 30.4 30.8
Measures, flow … … 9.2 5.6 4.8 4.6 0.0
of which: not yet estimated … … 0.0 0.0 4.2 4.6 0.0
Primary balance -20.4 -5.6 -2.1 2.4 7.4 14.2 15.2
Interest payments 11.9 13.0 14.9 17.1 18.9 20.4 20.3
Overall balance -32.3 -18.6 -17.0 -14.7 -11.5 -6.2 -5.1
Gross debt (Maastricht) 273.5 307.5 324.6 339.4 350.1 349.6 348.7
(Percent of GDP)
Revenue 2/ 36.9 40.5 39.0 38.5 38.2 37.1 36.3
Taxes on production, and imports 11.1 13.9 12.9 12.9 13.0 13.3 13.2
Taxes on income, and property 7.9 7.9 7.6 7.4 7.4 7.6 7.5
Social contributions 12.8 12.6 12.4 12.1 11.8 11.9 11.7
Other 3.7 4.0 3.9 3.9 3.9 3.9 3.9
Capital transfers 1.3 2.2 2.2 2.2 2.1 0.5 0.0
Primary expenditure 2/ 45.4 42.9 46.6 46.5 46.0 43.8 42.5
Wages 12.4 11.7 12.3 11.9 11.4 11.0 10.8
Social benefits 20.5 20.8 23.3 23.6 23.4 23.3 23.0
Goods and services 6.1 4.8 4.7 4.9 5.1 5.0 4.9
Subsidies 0.1 0.1 0.1 0.1 0.1 0.1 0.1
Other current 1.6 1.6 1.6 1.6 1.6 1.6 1.5
Capital 4.6 4.1 4.5 4.3 4.3 2.8 2.2
Measures, cumulative … … 6.7 9.0 11.0 12.6 12.2
Measures, flow … … 4.1 2.4 2.0 1.9 0.0
of which: not yet estimated … … 0.0 0.0 1.8 1.9 0.0
Primary balance -8.6 -2.4 -0.9 1.0 3.1 5.9 6.0
Interest payments 5.0 5.6 6.6 7.5 8.1 8.4 8.1
Overall balance -13.6 -8.1 -7.6 -6.5 -4.9 -2.6 -2.0
Gross debt (Maastricht) 115.2 133.3 145.1 148.6 149.1 144.3 138.7
Memorandum items:
Nominal GDP (in euro billions) 237 231 224 228 235 242 251
Source: Greece authorities, and IMF staff estimates.
1/ ESA95.
2/ For 2010 we have included all the measures already taken amounting to 7.5 percent of GDP.
For 2011 onwards, all program measures are shown in a separate line.