TOP 10 COUNTRIES AND ACCELERATORS IN THE FIWARE PROGRAMME
•
0 likes•3,344 views

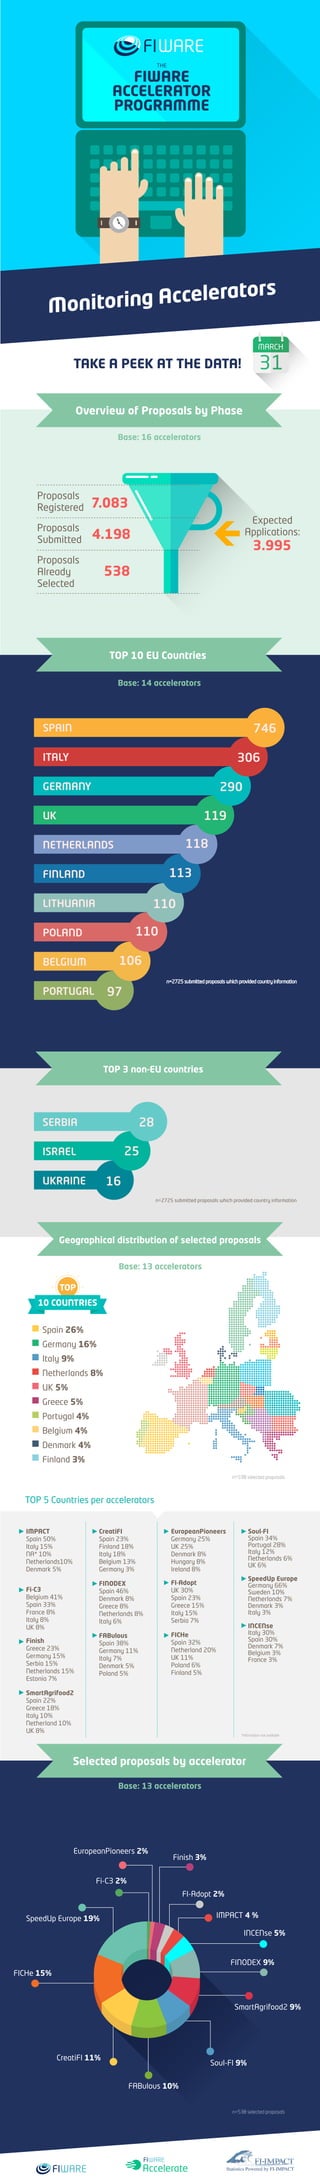
Infographic of the FIWARE Accelerator Programme's results in May 2015. For more info, visit www.fiware.org

Recommended
Recommended
More Related Content
What's hot
Viewers also liked
Viewers also liked (20)
Similar to TOP 10 COUNTRIES AND ACCELERATORS IN THE FIWARE PROGRAMME
Similar to TOP 10 COUNTRIES AND ACCELERATORS IN THE FIWARE PROGRAMME (6)
More from FIWARE
More from FIWARE (20)
Recently uploaded
Recently uploaded (20)
TOP 10 COUNTRIES AND ACCELERATORS IN THE FIWARE PROGRAMME
- 1. TAKE A PEEK AT THE DATA! Monitoring Accelerators Overview of Proposals by Phase Base: 16 accelerators Base: 14 accelerators TOP 10 EU Countries Geographical distribution of selected proposals Base: 13 accelerators Spain 26% Germany 16% Italy 9% Netherlands 8% UK 5% Greece 5% Portugal 4% Belgium 4% Denmark 4% Finland 3% Selected proposals by accelerator Base: 13 accelerators 10 COUNTRIES TOP EuropeanPioneers Germany 25% UK 25% Denmark 8% Hungary 8% Ireland 8% FI-Adopt UK 30% Spain 23% Greece 15% Italy 15% Serbia 7% FICHe Spain 32% Netherland 20% UK 11% Poland 6% Finland 5% Soul-FI Spain 34% Portugal 28% Italy 12% Netherlands 6% UK 6% SpeedUp Europe Germany 66% Sweden 10% Netherlands 7% Denmark 3% Italy 3% INCENse Italy 30% Spain 30% Denmark 7% Belgium 3% France 3% IMPACT Spain 50% Italy 15% NA* 10% Netherlands10% Denmark 5% Fi-C3 Belgium 41% Spain 33% France 8% Italy 8% UK 8% Finish Greece 23% Germany 15% Serbia 15% Netherlands 15% Estonia 7% SmartAgrifood2 Spain 22% Greece 18% Italy 10% Netherland 10% UK 8% CreatiFI Spain 23% Finland 18% Italy 18% Belgium 13% Germany 3% FINODEX Spain 46% Denmark 8% Greece 8% Netherlands 8% Italy 6% FABulous Spain 38% Germany 11% Italy 7% Denmark 5% Poland 5% FIWARE ACCELERATOR PROGRAMME THE SpeedUp Europe 19% FICHe 15% CreatiFI 11% Soul-FI 9% FINODEX 9% IMPACT 4 % FI-Adopt 2% Finish 3% EuropeanPioneers 2% Fi-C3 2% SPAIN ITALY GERMANY UK NETHERLANDS FINLAND LITHUANIA POLAND BELGIUM PORTUGAL 746 306 290 119 118 113 110 110 106 97 7.083 4.198 538 Proposals Already Selected Proposals Registered Proposals Submitted 3.995 Expected Applications: FABulous 10% SmartAgrifood2 9% INCENse 5% n=538 selected proposals n=538 selected proposals *Information not available SERBIA ISRAEL UKRAINE 28 25 16 TOP 3 non-EU countries n=2725 submitted proposals which provided country information n=2725 submitted proposals which provided country information Accelerate TOP 5 Countries per accelerators
- 2. 45% Purely Software 1% NA* 28% Services (non-IT) n = 243, selected proposals offering purely software solutions <64% <25% <6% <6% Applications (155) Applications Development & Deployment (60) Consumer Application (14) System Infrastructure Software (14) 25% Software & Hardware TAKE A PEEK AT THE DATA! Which type of technology are they offering? Base: 13 accelerators Base: 13 accelerators 0-1 MEMBERS 2-5 TEAM MEMBERS 6-10 TEAM MEMBERS 10+ TEAM MEMBERS 38% 48% 12% 2% Who are these guys? FIWARE ACCELERATOR PROGRAMME THE Markets targeted by proposals Base: 13 accelerators Business Services Public Administration Accommodation/Food services Retail/Wholesale Telecom/Media Education Healthcare Utilities Construction Manufacturing Arts/Entertainment Agriculture Transport Education/Culture Transport/Logistics Energy/Home automation Environment/Nature Health/Wellness Other DIY/Design Citizen engagement Leisure/Gaming Shopping 26% no experience 20% 1 year 13% 2-4 years 11% 5+ years 30% unknown Consumer solutions by target market Teams and experience 24% 20% 16% 12% 8% 8% 6% 4% 2% 2% n=538 selected proposals Years of experience 6% 2% 16% 10% 23% 11% 15% 4% 2% 1% Target sectors 5% 4% 5% Accelerate