Africa; A Simplified Cost-Effective Biosand Filter (BSFZ) For Removal Of Chemical Contaminants From Water
•
2 gefällt mir•1,703 views

Africa; A Simplified Cost-Effective Biosand Filter (BSFZ) For Removal Of Chemical Contaminants From Water

Empfohlen
Empfohlen
Weitere ähnliche Inhalte
Was ist angesagt?
Was ist angesagt? (20)
Ähnlich wie Africa; A Simplified Cost-Effective Biosand Filter (BSFZ) For Removal Of Chemical Contaminants From Water
Ähnlich wie Africa; A Simplified Cost-Effective Biosand Filter (BSFZ) For Removal Of Chemical Contaminants From Water (20)
Mehr von D7Z
Mehr von D7Z (20)
Kürzlich hochgeladen
Kürzlich hochgeladen (20)
Africa; A Simplified Cost-Effective Biosand Filter (BSFZ) For Removal Of Chemical Contaminants From Water
- 1. Journal of Chemical Engineering and Materials Science Vol. 2(10), pp. 156-167, November 2011 Available online at http://www.academicjournals.org/jcems ISSN-2141-6605 JCEMS ©2011 Academic Journals DOI: 10.5897/JCEMS11.041 Full Length Research Paper A simplified cost-effective biosand filter (BSFZ) for removal of chemical contaminants from water Themba O. Mahlangu1, Lizzy Mpenyana-Monyatsi2, Maggie N. B. Momba2 and Bhekie B. Mamba1* 1 Department of Chemical Technology, University of Johannesburg, P. O. Box 17011, Doornfontein 2028, South Africa. 2 Department of Environmental, Water and Earth Science, Tshwane University of Technology, Arcadia Campus, Private Bag X680, 0001 Pretoria, South Africa. Accepted 29 September, 2011 A study aimed at designing, constructing and evaluating a cost-effective biosand filter was undertaken. The biosand filter was modified with the addition of zeolites (clinoptilolite). The zeolites formed the largest part of the filter media which comprised of four layers. The complete filter had six zones which played a role during the filtration process. Filtration was done for 3 h to mimic water filtration in private homes. The filtered water was collected in a vessel for 1 h after which the samples were taken for analysis. Results indicated removal of up to 80 calcium, 89 magnesium, 99 iron, 56 arsenic, 54 fluorides, 96 turbidity, 37 nitrates and 41% total organic carbon. Higher turbidity (r = 0.024) and chlorophyll a (r = - 0.566) concentrations resulted in a decrease in the flow rate of the filter which was between 1.74 ℓ/h and 19.20 ℓ/h. Higher chlorophyll a concentrations resulted in higher turbidity (r = 0.609). The filter was cost- effective (<US$20.00), and easy to construct, operate and maintain. Key words: Biosand filter, zeolites, total organic carbon, chlorophyll a. INTRODUCTION Although access to safe potable water has recently used in addition to other good practices such as become a human right, it is alarming to note that water improved hygiene, sanitation and improved water supply quality and scarcity are serious problems, especially in and quality (Clasen et al., 2006). Although there are a the rural areas of developing countries (DCs) (Sobsey, vast number of treatment methods, they have been found 2004). Approximately one billion people lack access to to have some limitations such as ineffectiveness in safe potable water globally (Duke et al., 2006). This removing contaminants or disinfecting water and high situation has been brought about, at least partly, by operation and maintenance costs (Earwaker, 2006) and industrialization in most developing countries resulting in hence there is need for the development of a much more safe drinking water being a scarce resource (Wegmann efficient HWTS. Extensive research has therefore been et al., 2008). These results in deaths estimated at 2.2 conducted to develop an effective water purifier that can million annually as a result of diarrhoea which is asso- reduce colour and turbidity, while concomitantly removing ciated with water contamination (PSI, 2006). There has microorganisms such as Cryptosporidium and Giardia been a significant growth in household water treatment (Sobsey, 2004), and chemical contaminants. Due to the systems (HWTSs) in recent years. These are considered increase in the number of deaths reported every year as cheap and effective in preventing or reducing waterborne a result of drinking contaminated water, point of use diseases in rural areas of DCs. These HWTSs would be (POU) water treatment systems are encouraged in rural areas of DCs. An ideal water treatment system for developing countries should be able to remove all chemical and *Corresponding author. E-mail: bmamba@uj.ac.za. Tel: 0027 microbial contaminants in one single filtration process. (0)11 559 6516. Fax: 0027 (0)11 559 6425. These filters should reduce contaminants to acceptable
- 2. Mahlangu et al. 157 levels while retaining their permeability and reactivity over the filter has to be cleaned is not well documented. The extended periods. Low-cost and readily available efficiency of the BSF was focused on the removal of materials which are efficient in removing contaminants microbial contaminants, yet there is a need to scale up from drinking water are considered to be a solution for the removal of chemical contaminants such as iron, due providing clean water in rural areas of DCs. These to the high rate of industrialisation which results in heavy- materials include activated alumina, agricultural by- metal contamination of water sources (Wegmann et al., products (e.g. rice hulls), apatite, clay minerals, granular 2008). activated carbon (GAC), industrial by-products, iron oxide Since some communities in the rural areas of DCs may (coated sands), manganese oxide (coated sands), be exposed to heavy-metal water contaminants such as metallic iron (Fe), peat and peat moss, phosphate rocks, arsenic (As) and iron (Fe), we are proposing the design seaweeds and their derivatives, wood chips, and zeolites of a modified biosand filter containing zeolites (Malik et al., 2009). Biosand filters (BSFs) form part of the (clinoptilolite) to serve as an alternative water purifier to many emerging technologies being developed from many other designs which are complex and expensive. locally available materials, for the removal of contami- The BSF is one of the 5 filters that were selected by the nants from water in rural areas to make the water suitable project team (funded by the Water Research for use by low-income rural people of DCs. As BSFs are Commission, South Africa) to evaluate their efficiency cheap to construct and maintain they could be promoted and applicability in providing safe drinking water to and utilised in the rural areas of many DCs. people of SARA. The selection criteria were based on the The BSF was developed by Dr Eric Manz (University cost-effectiveness of the filter, availability of construction of Calgary, Canada) and has been introduced in many materials, ease of construction, ease of operation, ease countries (Earwaker, 2006), but this device is not used of maintenance, amount of purified water the filter can extensively in South African rural areas (SARA). These produce and durability of the filter. Modification of the SARA are exposed to pollution by microbial and chemical standard BSF resulted in the filter being cheaper to contaminants. Before this system could be used construct and to maintain. The size of the BSF was extensively in SARA, there is a need to evaluate its effi- designed in a way that it could be located inside the ciency in removing chemical contaminants from drinking house for the user’s convenience for use and water. The BSF carries out various filtration processes maintenance. which include settlement, straining, filtration, removal of The reasons for the choice of zeolite material to be organics, inactivation of micro-organisms and chemical incorporated in the BSF include the fact that zeolites change (Huisman and Wood, 1974). The BSF is gravity occur as natural aluminosilicates which consist of a driven and no pre-treatment of water is required. The flow framework of tetrahedral molecules. Exchangeable rate of the BSF (15 ℓ/h to 20 ℓ/h) is controlled by the cations present in zeolites counterbalance the negative height of the water column above the sand bed together charge on the zeolite surface generated from with the porosity of the sand bed (Barnes et al., 2009). isomorphous substitution (Barrer, 1978). Decreasing the The BSF can remove up to 1 NTU turbidity (Buzunis, particle size of zeolites increases their metal adsorption 1995), 15 to 25% (dissolved organic carbon), 90 to 95% potential; however, particle size reduction often leads to iron (Ngai and Welewijk, 2003), 50 to 90% organic and the reduction in flow rate in the column due to reduced inorganic toxicants (Palmateer et al., 1999) and <47% permeability of the column. It has been documented in arsenic (Collins, 1998). Surface straining is a process the literature that zeolites provide a very good com- whereby particles too large to pass through the bination of ion exchange and molecular sieve properties, interstices between the grains that form the filter media which can be modified with ease (Cincotti et al., 2006). become trapped. This is the main mechanism of turbidity The predominant exchangeable cations for the natural reduction by the BSF (Haarhoff and Cleasby, 1991). zeolite are sodium (Na+), potassium (K+) and calcium Spherically shaped grains have been proposed to (Ca2+). In this study a natural zeolite (clinoptilolite) with a capture particles about 15% of the grain size (Huisman particle size of between 1 mm and 3 mm was used and Wood, 1974). Muhammad et al. (1996) and Collins without any modification. It was conceptualised that a (1998) predicted that BSFs may remove some heavy biosand filter with zeolites (BSFZ) would be developed metals and their hypothesis was based on research that could efficiently and effectively remove chemical carried out on slow-sand filters (SSFs). On the whole, a contaminants from raw water to produce potable water of complex biological layer (schmutzdecke) which is acceptable quality in terms of the South African National considered to be the most important component in BSFs Standard Drinking Water Specification (SANS 241, provides effective purification, while the underlying sand 2006). The specific objectives of the study were to provides the support medium (Huisman and Wood, evaluate the following: 1974). The BSF has been shown to be effective in reducing turbidity and pathogens but the performance of (i) Removal efficiency of the BSFZ in removing chemical the filter in terms of removing chemical contaminants as contaminants well as the amount of water that can be treated before (ii) Effect of contact time on the removal of each chemical
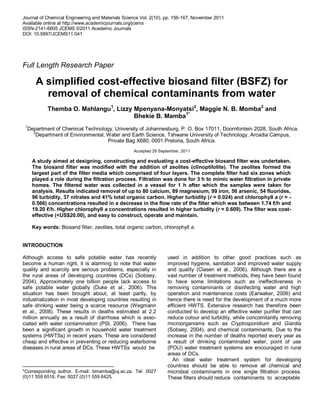
- 3. 158 J. Chem. Eng. Mater. Sci. Figure 1. Skeletal design of BSFZ showing internal components of the filter. An inlet where water is poured in and an outlet (spigot) are also shown. The filter house is a 25 ℓ plastic bucket. contaminant this layer is composed of sand. The sixth zone is the gravel zone (iii) Effect of turbidity on the flow rate of the BSFZ composed of coarse sand (0.95 mm) and gravel (1 to 3 mm). The gravel layer (2.5 cm thick) is very useful in ensuring that there is an (Iv) Correlation of chlorophyll a concentrations with filter easy flow of water to the pipe that connects to the spigot. The flow rate and turbidity of filtered water coarse sand layer (also 2.5 cm deep) helps in retaining the clinoptilolite, and preventing it from being flushed down into the The BSF was evaluated for performance in removing gravel layer. chemical contaminants, maintenance practices and In order to prevent poured water from disturbing the biological lifespan. The acceptance of the BSFZ by South African layer, a diffuser plate was made from the lid of the bucket by trimming the lid radically until it fitted into the plastic bucket and people living in the rural areas is under investigation. resting it on top of short ledges made from PVC pipes. The diffuser plate was perforated by drilling circular holes (2 cm apart). The diffuser plate distributes water at a steady rate, maintains the flow METHODOLOGY rate of the BSFZ and also traps larger particles such as grass and leaves (Barnes et al., 2009). The BSFZ was produced with natural Design and description materials and might have a different behavior when clinoptilolite is replaced with another type of zeolite such as chabazite (different The biosand filter with zeolites (BSFZ) was fabricated in the types of zeolites may have varying ion-exchange capacities). workshop of the Tshwane University of Technology (Pretoria, South Africa) with minor modifications based on guidelines given in the literature (CAWST, 2008). Collection of water samples The BSFZ has six distinct zones: The first zone is the inlet reservoir zone where water is poured in during filtration. This was Surface water samples of low turbidity were obtained from the constructed by removing the lid of a 25 ℓ bucket. The second zone Apies River in Hermanstad, Pretoria and high-turbidity surface is the standing water zone. This zone came about as a result of water samples were obtained from Hartbeespoort Dam. elevating the under-drain pipe connected to the spigot, 5 cm above Low-turbidity and high-turbidity groundwater samples were the top layer of sand (Figure 1). It is useful in that oxygen now collected from boreholes situated in two different areas, namely diffuses through this zone to the biological layer (CAWST, 2008). Delmas and Wallmannsthal, respectively. Water obtained from the The third zone is the bio-layer which develops a few centimetres (1 Delmas Municipality constituted the low-turbidity groundwater. to 2 cm) above the top sand layer. This layer comprises slime, Water from a borehole situated in a security company compound in sediments and micro-organisms (CAWST, 2008). The fourth layer is Wallmannsthal constituted the high-turbidity groundwater. The the biological zone that develops at the top 5 to 10 cm of the sand temperature, visual colour and odour of water were recorded on surface and is useful for the removal of iron and microbial site. The turbidity and the pH were recorded immediately upon contaminants (CAWST, 2008). arrival at the Tshwane University of Technology (TUT) Water The fifth layer is the clinoptilolite zone. This zone is 15 cm deep Research Group Laboratory before the water was filtered through and forms the largest part of the filter media. The clinoptilolite zone the BSFZ. Water samples were collected 6 times from each site is responsible for the removal of heavy metals. In standard BSFs, over each test period.
- 4. Mahlangu et al. 159 Filtration oxide as a support gas for arsenic and calcium analysis (APHA, 1995). Pure metal standards of the ions (1000 mg/ℓ) were obtained The BSFZ was evaluated for its efficiency to reduce chemical from the Tshwane University of Technology chemical store and contaminants from environmental water sources (surface water and working standards were prepared from them. groundwater) with low and high turbidity. Filtration was carried out in the laboratory (Tshwane University of Technology) to mimic filtration in rural homes. The collected water samples were filtered Nitrate analysis through the BSFZ upon arrival in the laboratory (TUT). Filtration was carried out for 3 h with the assumption that enough purified To quantify nitrate removal by the filters, a calibration curve was water would have been produced over this period of time for drawn using results of 0 to 5 mg/ℓ nitrate standards prepared from drinking and cooking. Different volumes of filtrates were collected at analytical reagent (AR) grade potassium nitrate (KNO 3) dissolved in 1 h intervals over the 3 h period of filtration. This was done to deionised water. The salicylate method (APHA, 1995) was used establish whether there was a difference in the reduction of and the absorbance of standards and samples was determined at chemical contaminants at different times and to make the 410 nm using a spectrophotometer (SPEKOL 1300 Model). necessary adjustments and recommendations. In cases where the pre-filtered raw water was found to have lower contaminant concentrations falling within the recommended limits, the water was Fluoride analysis spiked with the chemical of interest. This was mainly done to evaluate whether the BSFZ would reduce the concentrations of the The Metrohm 713 pH meter was used together with a fluoride contaminants of interest to allowable levels recommended by the electrode for all experimental measurements of fluorides from SANS, 241 (2006). surface water and groundwater samples with low and high turbidity. The collected samples were analysed in triplicate to determine An Ag/AgCl 6.0228.00 electrode was used as the reference the water quality after filtration. The quality of the water produced electrode. Fluoride standard solutions (0.1 to 100 mg/ℓ) were was compared to the SANS 241 (2006) Drinking Water Guidelines prepared using AR grade sodium fluoride (NaF) and a calibration for Chemical Contaminants. curve was plotted as log concentration vs. potential difference (mV). Fluoride samples and fluoride standard solutions were diluted with TISAB II (total ionic strength adjuster buffer) in a 1:1 ratio. The ions Flow-rate and turbidity determination (F-) were then detected with the ion-selective electrode (Hamdi and Srasra 2007). The first step in evaluating the filter flow rates was to determine the flow rate of the filters using deionised water (2 to 3 µS/cm) produced by an ultra-pure reverse osmosis unit (O Purite) with filter Analysis of total organic carbon (TOC) pore size of 0.2 µm. This would give the benchmark flow rate of the BSFZ expected when water samples with very low turbidity are A total organic carbon (TOC) combustion analyser (TEKMAR filtered. Knowledge of this flow rate is fundamental in that it will DOHRMANN APOLLO 9000 model) was used to analyse TOC in all allow filter users to know when the flow rate has declined filtered and unfiltered samples. Vials with penetrable Teflon septum significantly. Deionised water together with environmental water were filled with 40 mℓ of samples to be analysed and placed into the (surface water and groundwater with low and high turbidity) was TOC analyser auto-sampler rack. A calibration curve was prepared filtered through the filter and the flow rates were measured every from results of a range of potassium phthalate standards (1.0 to hour for 3 h. The flow rate was measured as the ratio of filtered 25.0 mg/ℓ) and all sample concentrations were deduced from the water volume (ℓ) per unit time (h) taken to filter it. calibration curve in triplicates (n = 3). Turbidity in nephelometric turbidity units (NTU) for all samples was determined using a Eutech TN-100 turbidimeter calibrated with 0.2 to 800 NTU calibration standards. Triplicate readings were Effect of contact time between the filter media and the taken for each sample for data validation. contaminant The effect of contact time between the contaminant/filter media was Chlorophyll a analysis investigated by collecting water at different times (1 h intervals over a period of 3 h) with the assumption that the filter media would have The main aim in the determination of chlorophyll a was to quantify had enough contact time to act on the contaminated water. the amount of chlorophyll a in unfiltered water samples and to correlate this with the filtrate flow rate and turbidity. Chlorophyll a concentrations were determined using Standard Methods (APHA, 1995). A Mixtacel CENTRO 8 centrifuge was used to centrifuge all Investigation of cost and maintenance of the filter samples at 3600 rpm for 5 min and an ultrasonic cell disrupter (VIRSONIC 100 Ultrasonic Cell Disrupter) was used to agitate It became a priority to investigate the cost and maintenance of each chlorophyll a cells. Optical density was measured using a filter device. This was important in order to determine whether our spectrophotometer (SPEKOL 1300 model) at 750 nm and 664 nm device was cheaper in terms of construction costs and maintenance prior to acidification and at 750 nm and 665 nm after acidification of compared to other filters on the market. It was also imperative to samples with 0.1 mℓ of 0.1 M hydrochloric acid (APHA, 1995). establish the volume of water that the device could filter before cleaning needs to take place. Since this filter was designed for use in rural areas, we decided on two parameters that could be used to Heavy metal analysis determine cleaning time, namely filter flow rate and visual observation of the dirty filter wall or media. Chemical analyses of calcium, magnesium, iron and arsenic were The cost of the filter was investigated by recording the cost of performed by atomic absorption spectrophotometer (AAS) using a each part used in the filter construction, repairs and maintenance. VARIAN 220 FS model with an air acetylene flame and nitrous Volumes of filtered water before commencement of cleaning the
- 5. 160 J. Chem. Eng. Mater. Sci. Figure 2. Results of turbidity removal from environmental water sources: Change of flow rate with volume of filtered water. Effect of turbidity in the flow rate of BSFZ and effect of filter washing on turbidity reduction efficiency. filter were also monitored. This was useful in quantifying the cost volume of water filtered. Filtration of high-turbidity water effectiveness of the filter devices. resulted in a significant decrease in the flow rate of the BSFZ. Filter cleaning after 180 ℓ of highly turbid water had been filtered resulted in an improvement in the flow RESULTS AND DISCUSSION rate which decreased again over time as more turbid water was filtered (Figure 2). Filter washing after 360 ℓ During this study period, 420 ℓ of contaminated had been filtered did not result in an overall increase in environmental water was filtered. Water from each water the flow rate of the BSFZ, but cleaning improved turbidity source was filtered six times and three replicate samples reduction by the filter. Lower flow rates were observed were taken at each hour of filter run. The first run of 120 ℓ when water with higher turbidity levels (16.70 to 42.93 of contaminated water comprised the surface water with NTU) was filtered. Filtered water produced turbidity levels low turbidity (SWLT); the second run of 140 to 240 ℓ of between 1.64 and 42.93 NTU. Higher turbidity levels comprised the groundwater with low turbidity (GWLT); the were obtained from samples of SWHT (Hartbeespoort third run of 260 to 360 ℓ comprised the groundwater with Dam) and lower turbidity levels were obtained from high turbidity (GWHT); and the fourth run of 380 to 420 ℓ samples of GWLT (Delmas, Borehole 7). The BSFZ comprised the surface water with high turbidity (SWHT). reduced turbidity greatly when the initial turbidity value in the untreated raw water was higher. The highest reduction in turbidity was 96% and this was obtained in Flow rate and turbidity the first hour of the filtration run with initial turbidity of 35.63 NTU (420 ℓ). The lowest turbidity reduction (1%) The BSFZ produced flow rates of between 1.74 and was obtained in the first hour of filtering contaminated 19.20 ℓ/h (Figure 2). The flow rate of the BSFZ was water with initial turbidity of 1.72 NTU (220 ℓ). Higher higher in the first hour of filter run and decreased with turbidity reductions by the BSFZ were obtained on time of filter run. This observation supported the findings filtration of SWLT (60 to 100 ℓ) and SWHT (380 to 420 ℓ) made by Barnes et al. (2009) that a decrease in the (Figure 2). As a generalisation, there was poor turbidity height of the water above the sand bed results in a reduction by the BSFZ on filtering groundwater samples. decrease in the flow rate. Most of the time, the flow rate The BSFZ reduced turbidity to <1 NTU and this finding of the BSFZ was within the recommended limit (15 to 20 supported the observations made by Buzunis (1995) that ℓ) as given in the literature (Barnes et al., 2009). However BSFs have higher turbidity reduction efficiencies with clogging due to filtration of highly turbid water, flow compared to fast sand filters. The major turbidity rates lower than the recommended limits were obtained. reduction mechanism is believed to be through surface The flow rate of the BSFZ decreased with an increase in straining as predicted by Haarhoff and Cleasby (1991).
- 6. Mahlangu et al. 161 Figure 3. Results of turbidity relation with chlorophyll a and the effect of higher and lower chlorophyll a concentrations on the flow rate of BSFZ. Effects of chlorophyll a on the flow rate of the BSFZ contributed to an overall increase in calcium removal efficiency by the BSFZ as more calcium removal was Chlorophyll a (chl a) which can be used as a measure of observed after washing the filter. There was no significant algal growth in the water was determined in the study. difference in the reduction of calcium by the BSFZ The effect of chl a on the flow rate of the BSFZ was between 1 h and 3 h (p = 0.097), 2 and 3 h (p = 0.821) studied. The relation between turbidity and chl a was also and between the first and second hour of filter run (p = investigated. Figure 3 shows that higher chl a concen- 0.054). trations resulted in lower flow rates and higher turbidity. Higher magnesium reduction efficiency was achieved There was an inverse strong negative correlation by the BSFZ. Magnesium was reduced greatly by the between chl a and flow rate of the BSFZ (r = -0.566). BSFZ regardless of whether the initial concentration in There was a strong positive correlation between the chl a the untreated water was lower or higher. The highest concentration and turbidity of the filtered water (r = initial magnesium concentration recorded was 108.48 0.607). The decrease in flow rate with an increase in both mg/ℓ (100 ℓ) and the lowest initial concentration recorded chl a concentrations and turbidity could be explained was 21.34 mg/ℓ (40 ℓ). Figure 5 shows that at higher initial based on the fact that suspended particles result in magnesium concentrations, the flow rates of the BSFZ fouling of the filter pores. Once the pores are clogged, the were lower and when initial magnesium concentrations channels that allow water molecules to pass become were lower, the flow rates were higher. The highest blocked. This results in a given volume of water taking magnesium reduction efficiency achieved was 89% and longer to be filtered than it would have taken with lower this was obtained in the second hour of filter run (200 ℓ) levels of total suspended solids (Jenkins et al., 2009). when GWLT was filtered. The lowest recorded magnesium removal efficiency was 28% and this was obtained in the second hour of filter run when GWLT was Removal of metals filtered (140 ℓ). The average magnesium reduction efficiency by the filter was 63, 59 and 57% for the first, The BSFZ achieved high removal efficiency of calcium second and third hour of filter run, respectively. and the reduction was greater during the first hour of the Magnesium removal efficiency in 1, 2 and 3 h of filter run filter run and with higher initial concentrations (Figure 4). was the same (p ≥ 0.05). The reduction of magnesium by Calcium reduction efficiency by the BSFZ was between the BSFZ could be through ion exchange and precipi- 50 and 80% at most during the study period. Higher tation of metal hydroxides from the solution as predicted reductions supported observations cited in the literature by Motsi et al. (2009) in a study to investigate the that zeolites provide a very good combination of ion- removal of heavy metals from acid mine drainage by exchange and molecular sieve properties, which can be means of natural zeolites. Based on the fact that zeolites modified with ease (Cincotti et al., 2006). Filter cleaning have an overall negative charge (Barrer, 1978), it could
- 7. 162 J. Chem. Eng. Mater. Sci. Figure 4. Calcium reduction by the BSFZ: Reduction from environmental water samples with low and high turbidity. Hourly reduction efficiency and the effect of flow rate on the removal efficiency. Figure 5. Magnesium reduction by the BSFZ: Reduction from environmental water samples with low and high turbidity. Hourly reduction efficiency and the effect of flow rate on the removal efficiency. be expected that zeolites favour the removal of cations the initial concentration level (Figure 6). The highest iron such as magnesium. reduction efficiency achieved was 99% and this was BSFs have long been shown to remove 90 to 95 % of obtained during the second hour of the filter run when iron from contaminated water (Ngai and Welewijk, 2003). contaminated water with an initial iron concentration of According to CAWST (2008), most iron in the 0.4 mg/ℓ (220 ℓ) was filtered. The average hourly contaminated water is removed in the biological zone of reductions of iron by the BSFZ were 89, 86 and 80% for the filter. Our results also showed higher iron reductions filtration runs of 1, 2 and 3 h, respectively. Analysis of by the BSFZ and iron was reduced greatly regardless of variance in the mean reduction of iron by the BSFZ for
- 8. Mahlangu et al. 163 Figure 6. Iron reduction by the BSFZ: Reduction from environmental water samples with low and high turbidity. Hourly reduction efficiency and the effect of flow rate on the removal efficiency. filter runs of 1 , 2 and 3 h showed that there was no the filter at all times of filter run (p ≥ 0.05). The average significant difference in the hourly reduction of iron hourly reductions of arsenic were 57, 58 and 56% for between 1 and 2 h (p = 0.434), 1 and 3 h (p = 0.117) filter runs of 1, 2 and 3 h, respectively. Filter cleaning was and 2 and 3 h (p = 0.406). A mechanism of iron removal observed to result in an overall increase in the reduction by BSFs was investigated and reported by Stumm and of arsenic as it was observed on filtration of SWHT (360, Morgan (1981). The same mechanism is believed to be 380 and 400 ℓ). taking place in the reduction of iron by the BSFZ. It is The BSFZ showed poor reduction of nitrates (Figure 8) believed that soluble iron (II) is oxidised and converted to on filtration of all water sources (SWLT, GWLT, GWHT insoluble iron (III) as a result of aeration. The process and SWHT). The average hourly removal was 37 (1), 50 proceeds according to Equations (1) and (2) (Stumm and (2) and 19% (3 h). Leaching of nitrates from the filter Morgan, 1981): media was observed several times during the study period. There was no significant difference in the 2+ + 3+ 4Fe + O2 + 4H → 4Fe + 2H2O (1) reduction of nitrates by the BSFZ at the different run times (1, 2 and 3 h) of collecting filtered water (p ≥ 0.05). Fe3+ + 3H2O → Fe(OH)3 + 3H+ (2) Filter washing did not produce an overall improvement in the reduction of nitrates by the BSFZ (Figure 8). Poor Lower iron reductions were observed on filtration of 20 ℓ reduction of nitrates by the BSFZ could be accounted for (3 h) and 40 ℓ (2 h and 3h) of contaminated water. It was by the overall negative charge of zeolites. Auerbach et al. suspected that there was some recontamination of the (2003) predicted that zeolites would remove nitrates. filtered samples during sample collection and sample They claimed that large empty spaces or cages which are preparation for analysis. found within zeolites accommodate cations such as Na+, There was greater removal of arsenic by the BSFZ on K+, Ca2+ and NH4+ and in some cases also incorporate - - filtration of SWLT (20 to 120 ℓ) and SWHT (380 to 420 ℓ). small amounts of anionic groups such as halides (Cl , Br Figure 7 shows that arsenic reduction by the BSFZ was ), carbonate and nitrate. The later are most difficult owing greater when the initial concentration was lower. The the negative charges in the zeolite framework. This is highest arsenic reduction efficiency achieved by the why our results showed poor nitrate removal by the BSFZ was 95% and this was obtained in the first hour zeolite filter. (400 ℓ) of the filter run during filtration of SWHT (Figure It was observed that the BSFZ was not able to remove 7). Arsenic reduction efficiency by the BSFZ was fluorides from contaminated water on filtration of SWLT observed to be the same throughout the duration of the (20 ℓ to 100 ℓ). Removal of fluorides was observed after filter run. In short, there was equal removal of arsenic by the first filter washing at 180 ℓ (Figure 9). The BSFZ had
- 9. 164 J. Chem. Eng. Mater. Sci. Figure 7. Arsenic reduction by the BSFZ: Reduction from environmental water samples with low and high turbidity. Hourly reduction efficiency and the effect of flow rate on the removal efficiency. Figure 8. Nitrate reduction by the BSFZ: Reduction from environmental water samples with low and high turbidity. Hourly reduction efficiency and the effect of flow rate on the removal efficiency. 42, 37 and 54% average fluoride reduction efficiencies for Due to the negative charge, the zeolites will therefore filter runs of 1 , 2 and 3 h, respectively, but there was no have poor affinity for fluorides resulting in poor removals difference in the overall hourly reduction of fluorides by being observed. the BSFZ (p ≥ 0.05). The highest fluoride concentration recorded in the filtered water was 4.934 mg/ℓ and this was obtained on filtration of SWLT (120 ℓ). The poor TOC reduction removal of fluorides by the BSFZ could be explained by the fact that zeolites have an overall negative charge. Table 1 shows results of TOC reduction by the BSFZ.
- 10. Mahlangu et al. 165 Figure 9. Fluoride reduction by the BSFZ: Reduction from environmental water samples with low and high turbidity. Hourly reduction efficiency and the effect of flow rate on the removal efficiency. Table 1. Results of total organic carbon removal by the BSFZ from environmental water with hourly percentage reduction efficiencies1. TOC reduction by BSFZ Water (ℓ) BT (mg/ℓ) AT 1 h (mg/ℓ)(%) AT 2 h (mg/ℓ)(%) AT 3 h (mg/ℓ)(%) 20 7.4769 4.5622 (39) 5.8476 (22) 6.1678 (18) 40 7.8567 4.6416 (41) 6.0772 (23) 6.3474 (19) 60 7.5484 4.5618 (40) 6.1369 (19) 6.4231 (15) 80 7.6409 4.6279 (39) 6.2465 (18) 6.4273 (16) 100 6.4082 5.5052 (14) 5.4315 (15) 5.6821 (11) 120 6.5774 5.4319 (17) 5.5102 (16) 5.5698 (15) 140 6.3757 5.3921 (15) 5.5148 (14) 5.5782 (13) 160 6.4231 5.4838 (15) 5.5312 (14) 5.5205 (14) 180 5.1311 4.6485 (9) 4.2538 (17) 4.4422 (13) 200 4.9943 4.6585 (7) 4.1644 (17) 4.1655 (17) 220 4.9229 4.5236 (8) 4.19 (15) 4.3757 (11) 240 4.5927 4.4712 (3) 4.1151 (10) 4.4823 (2) 1 Water volume of 240 ℓ was filtered during the study. Initial concentration was recorded as BT and concentrations after treatment were reported as AT. Concentrations at every hour of collection of filtered water (1 h – 3 h) were reported and the percentage removal was presented in brackets. Results show that the highest TOC concentration BSFZ was observed to decrease with filter usage as recorded in untreated water was 7.8567 mg/ℓ and the more volumes of contaminated water were filtered. lowest recorded concentration was 4.5927 mg/ℓ. The BSFZ achieved 41% TOC reduction efficiency and the lowest observed reduction was 2%. Lower reductions in Effect of contact time TOC were observed in the third hour of the filter run. The BSFZ removed TOC greatly when the initial TOC It has to be noted that in this study an attempt was made, concentration in the untreated water was higher. Due to as far as possible, to mimic the situation that would be lower TOC reduction efficiency by the BSFZ, this filter is taking place at household level when users would use the not recommended for use when TOC is the targeted BSFZ to filter their daily water. In investigating this effect, pollutant. Total organic carbon reduction efficiency by the we had two assumptions in mind: Filter users fill up the
- 11. 166 J. Chem. Eng. Mater. Sci. BSFZ and collect filtered water after it has been allowed viewed through the top of the bottle then the water to collect in the collection vessel for 1 and 3 h.Based on possibly has turbidity levels >50 NTU. The filter should the results, advice needed to be given on whether or not not be moved after installation since this may disturb the there was a difference in the hourly removal of biological layer. The filter should be kept out of the reach contaminants by the BSFZ so that time limit could be set of children to avoid damage to the spigot and disturbance for collecting water for drinking and cooking purposes. of the biological layer. Long pause periods (>48 h) should Therefore it had to be established whether there was a be avoided as the biological layer may die due to nutrient difference in the hourly removal of contaminants by the depletion. The recommended resting period is 6 h to 12 h BSFZ; statistical results showed that the amount of time (CAWST, 2008). spent by the contaminant of interest in the filter media does not affect the removal of the contaminant. Removal of contaminants by the BSFZ, after allowing Conclusion contaminated water to be filtered and collected every 1 h, showed equal removals (p ≥ 0.05) for the 1 h collections, In conclusion, a modified biosand filter with zeolites and throughout the duration of the filter run (3 h) for all (BSFZ) was designed, constructed and evaluated for contaminants investigated in the study. This implies that chemical contaminant removal efficiency. The BSFZ is filter users can use the filtered water collected after a easy to construct, maintain and operate. The BSFZ is filter run of 1 h for drinking and cooking purposes equally cost effective (manufacturing cost = ZAR165.00 ~ as well as the 2 and 3 h collections. Filter users might as US$20) and could be afforded by most rural people in well filter water for 3 h at one time. South Africa. There are no additional maintenance costs unless when the spigot is dislodged and damaged hence requiring replacement. The filter was observed to have Cost and maintenance of the BSFZ higher flow rates which make it suitable for use by a larger family for the production of clean water for both In construction of the BSFZ, the following materials were drinking and cooking purposes. The size of the filter used: two x 25 ℓ plastic buckets (ZAR25.58 each), 1 makes it convenient for the users to position it in an area spigot (ZAR49.99), 1 m clear tubing (ZAR24.99), 2 insert where food is prepared and hence encourages the use elbows (ZAR3.79 each), 1 thread tape (ZAR6.49), 40 kg and maintenance of the filter. The BSFZ had higher fine sand (ZAR28.00), 40 kg gravel (ZAR30.24), 40 kg removal efficiency of chemical contaminants and hence coarse sand (ZAR34.82) and 50 kg zeolites (ZAR155.35). can be used for production of higher quality water at It was observed that the clear tubing and the thread tape lower costs. could be used to construct 2 filters, fine sand (20 filters), If lower turbidity reductions during the first day of filter gravel and coarse sand (40 filters) and zeolites (5 filters). run are observed, it implies that the sand was not This resulted in the cost of 1 BSFZ being ZAR164.23 (< thoroughly washed. Removals of ~90% are expected with US$20.00). This price was observed to be reasonable for time as the filter is continuously used. Cleaning the top low-income SARA people. layer of sand improves turbidity reduction by the BSFZ. The sand filter can become clogged over time when High-turbidity water results in a significant drop in the flow solid materials accumulate within or on the sand surface. rate of the filter. Highly turbid raw water needs to be left The filter is cleaned by removing the top 5 cm layer of standing for a while to allow total suspended solids to fine sand, thoroughly washing the sand and replacing it. If settle before filtration. The flow rate of the BSFZ new sand is available, it is recommended that it be used generally decreases with time of filter use and higher flow to replace the used sand. Clean filtered water must be rates could be regained by filter washing. Reduction of used for cleaning the sand and the collection bucket. If chemical contaminants by the BSFZ was observed to be the bed cannot be regenerated removal of the top few greatest when the flow rate was lower as this increased centimetres of the top sand bed is appropriate when it is the contact time between the filtered water and the filter clogged with fine particles and water cannot penetrate media, but the reduction was observed to be insignifi- deep into the sand bed (Fewster et al., 2004). Biosand cantly different to those achieved at higher flow rates (p ≥ filters have been designed to filter water with turbidity 0.05). This means that BSFZ users can leave the filter levels <50 NTU (Barnes et al., 2009). Water with higher filtering while doing some other household chores and turbidity levels (>50 NTU) should be allowed to settle first come and collect filtered water after 3 h. The BSFZ could before filtration. A standard to determine turbidity >50 be used for the removal of calcium, magnesium and iron NTU was given by CAWST (2008). For rural people to to levels allowable by SANS, 241 (2006) but its use is not test the turbidity of the raw water, it is advised that a clear recommended for the removal of arsenic, total organic 2 ℓ plastic soft-drink bottle is filled with water and placed carbon, nitrates and fluorides in highly contaminated on top of a piece of paper with large print. The more total water. Proper care needs to be taken when washing and suspended solids in the water, the murkier it seems and moving the filter as there might be disturbance to the filter the higher the turbidity. If the print is not visible when media and the biological layer.
- 12. Mahlangu et al. 167 RECOMMENDATIONS Earwaker P (2006). Evaluation of Household BioSand Filters in Ethiopia. Master of Science thesis in Water Management (Community Water Supply). Institute of Water and Environment, It is recommended that BSFZ users avoid filtration of Cranfield University, Silsoe, United Kingdom. highly turbid water as this result in quick clogging of the Fewster E, Mol A, Wiessent-Brandsma C (2004). The long term filter media. The filter should be kept out of the reach of sustainability of household bio-sand filtration. 30th WEDC International Conference. Vientiane, Lao. children as they may dismantle the hanging spigot and Haarhoff J, Cleasby JL (1991). Biological and physical mechanisms in re-contaminate filtered water. If it cannot be kept inside slow sand filtration. In: Slow Sand Filtration. Gary Logsdon (ed.). the house, the filter should be positioned away from American Society of Civil Engineers, New York, pp. 19-98. direct sunlight, because this results in filter drying and Hamdi N, Srasra E (2007). Removal of fluoride from acidic wastewater by clay mineral: Effect of solid–liquid ratios. Desalination, 206: 238– hence killing the biological layer. Long pause periods 244. (>48 h) should be avoided as the biological layer may die Huisman L, Wood W (1974). Slow Sand Filtration. WHO, Geneva. due to nutrient depletion. The recommended resting Jenkins MW, Tiwari SK, Darby J, Nyakash D, Saenyi W, Langenbach K period is 6 to 12 h (CAWST, 2008). (2009). The BioSand Filter for Improved Drinking Water Quality in High Risk Communities in the Njoro Watershed, Kenya. Research Brief 09-06-SUMAWA, Global Livestock Collaborative Research Support Program. University of California, Davis, USA. ACKNOWLEDGEMENTS Malik AH, Khan ZM, Mahmood Q, Nasreen S, Bhatti ZA (2009). Perspectives of low cost arsenic remediation of drinking water in This project was funded by the Water Research Pakistan and other countries, J. Hazard. Mater., 168: 1–12. Motsi T, Rowson NA, Simmons MJH (2009). Adsorption of heavy Commission (South Africa). The authors would like to metals from acid mine drainage by natural zeolite. Int. J. Miner. thank the University of Johannesburg and Tshwane Process, 92: 42–48. University of Technology for instrumentation. Muhammad N, Ellis K, Parr J, Smith MD (1996). Optimization of slow sand filtration. Reaching the unreached: challenges for the 21st century. 22nd WEDC Conference New Delhi, India, pp. 283-285. Ngai T, Welewijk S (2003). The Arsenic Biosand Filter (ABF) Project: REFERENCES Design of an Appropriate Household Drinking Water Filter for Rural Nepal. Report prepared by RWSSSP and ENPHO. Auerbach SM, Carrado KA, Dutta PK (2003). Handbook of Zeolite Palmateer G, Manz D, Jurkovic A, McInnis R, Unger S, Kwan KK, Science and Technology. Marcel Dekker, Inc., New York, Basel. Dudka B (1999). Toxicant and parasite challenge of Manz intermittent Barnes D, Collin, Ziff S (2009). The Biosand Filter, Siphon Filter and slow sand filter. Environ. Toxicol., 14: 217–225. Rainwater Harvesting, pp. 25–27. PSI (2006). Disinfecting Water, Saving Lives: Point-of-use Safe Water Barrer R (1978). Zeolites and Clay Minerals as Sorbents and Molecular Products Prevent Diarrhoea and Improve Family Health. PSI Sieves. Academic Press Inc., London-New York, pp. 497. Services International, Washington. Buzunis B (1995). Intermittently Operated Slow Sand Filtration: A New Sobsey M (2004). Evaluation of the Biosand Filter for Reducing Risks of Water Treatment Process. Department of Civil Engineering, Diarrhoeal Illness and Improving Drinking Water Quality in University of Calgary, Canada. Communities in The Dominican Republic. University of North CAWST (2008). Biosand Filter Manual: Design, Construction, Carolina. Installation, Operation and Maintenance. South African National Standard (SANS) 241 (2006). Drinking Water http://www.cawst.org/en/themes/biosand-filter (Accessed on 24 Specification. South African Bureau of Standards 241 (SABS). February 2010). Standard Methods (1995). Standard Methods for the Examination of Cincotti A, Mameli A, Locci MA, Orru R, Cao G (2006). Heavy metal th Water and Wastewater (19 edn.). Edited by Andrew D Eaton, uptake by Sardinian natural zeolites: Experiment and modelling. Ind. Lenore S Clesceri and Arnold E Greenberg. American Public Health Eng. Chem. Res., 45: 1074–1084. Association (APHA), Washington, DC. Clasen T, Roberts I, Rabie T, Schmidt W, Cairncross S (2006). nd Stumm W, Morgan JJ (1981). Aquatic Chemistry, 2 Edn. Wiley Inter Interventions to improve water quality for preventing diarrhoea. Science, New York NY, pp. 780. Cochrane Database of Systematic Reviews, Issue 3. Art. No.: Wegmann M, Michen B, Luxbacher T, Fritsch J, Graule T (2008). CD004794. DOI: 10.1002/14651858.CD004794.pub2. Modification of ceramic microfilters with colloidal zirconia to promote Collins RM (1998). Assessing slow sand filtration and proven the adsorption of viruses from water. Water Res., 42: 1726–1734. modifications. In: Small Systems Water Treatment Technologies: State of the Art Workshop. NEWWA Joint Regional Operations Conference and Exhibition. Marlborough, Massachusetts. Duke W, Mazumder A, Nordin R, Baker D (2006). The use and performance of biosand filters in the Artibonite Valley of Haiti: A field study of 107 households. Rural Remote Health, 6: 570.