Ten Organizational Design Models to align structure and operations to busines...
80691025
1. October 24, 2011
ACTION
Buy
E Ink Holdings Inc (8069.TWO)
Return Potential: 35% Equity Research
Updating our long-term framework on e-readers; reiterate Buy
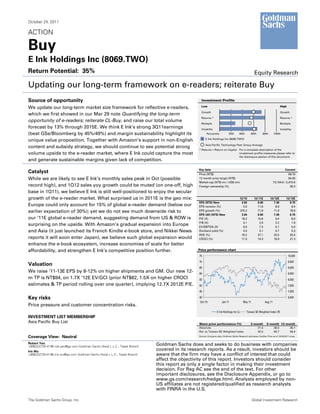
Source of opportunity Investment Profile
Low High
We update our long-term market size framework for reflective e-readers,
Growth Growth
which we first showed in our Mar 29 note Quantifying the long-term
Returns * Returns *
opportunity of e-readers; reiterate CL-Buy, and raise our total volume
Multiple Multiple
forecast by 13% through 2015E. We think E Ink’s strong 3Q11earnings Volatility Volatility
(beat GSe/Bloomberg by 45%/49%) and margin sustainability highlight its Percentile 20th 40th 60th 80th 100th
E Ink Holdings Inc (8069.TWO)
unique value proposition. Together with Amazon’s support in non-English
Asia Pacific Technology Peer Group Average
content and subsidy strategy, we should continue to see potential strong
* Returns = Return on Capital For a complete description of the
volume upside to the e-reader market, where E Ink could capture the most investment profile measures please refer to
the disclosure section of this document.
and generate sustainable margins given lack of competition.
Key data Current
Catalyst Price (NT$) 69.70
While we are likely to see E Ink’s monthly sales peak in Oct (possible 12 month price target (NT$) 94.00
Market cap (NT$ mn / US$ mn) 73,154.5 / 2,415.6
record high), and 1Q12 sales yoy growth could be muted (on one-off, high Foreign ownership (%) 39.3
base in 1Q11), we believe E Ink is still well-positioned to enjoy the secular
growth of the e-reader market. What surprised us in 2011E is the geo mix: 12/10 12/11E 12/12E 12/13E
EPS (NT$) New 3.84 6.60 7.38 8.75
Europe could only account for 15% of global e-reader demand (below our EPS revision (%) 0.0 11.6 8.9 8.4
earlier expectation of 30%); yet we do not see much downside risk to EPS growth (%) 375.2 71.9 11.9 18.6
EPS (dil) (NT$) New 3.84 6.60 7.38 8.75
our ’11E global e-reader demand, suggesting demand from US & ROW is P/E (X) 18.2 10.6 9.4 8.0
P/B (X) 3.1 2.6 2.2 1.9
surprising on the upside. With Amazon’s gradual expansion into Europe EV/EBITDA (X) 9.0 7.3 6.1 5.0
and Asia (it just launched its French Kindle e-book store, and Nikkei News Dividend yield (%) 0.0 3.1 4.7 5.3
ROE (%) 18.2 27.1 25.5 25.4
reports it will soon enter Japan), we believe such global expansion would CROCI (%) 11.5 14.3 19.9 21.3
enhance the e-book ecosystem, increase economies of scale for better
affordability, and strengthen E Ink’s competitive position further. Price performance chart
75 10,000
70 9,500
Valuation
65 9,000
We raise ‘11-13E EPS by 8-12% on higher shipments and GM. Our new 12- 60 8,500
m TP is NT$94, on 1.7X ‘12E EV/GCI (prior NT$82, 1.5X on higher CROCI 55 8,000
estimates & TP period rolling over one quarter), implying 12.7X 2012E P/E. 50 7,500
45 7,000
Key risks 40 6,500
Oct-10 Jan-11 May-11 Aug-11
Price pressure and customer concentration risks.
E Ink Holdings Inc (L) Taiwan SE Weighted Index (R)
INVESTMENT LIST MEMBERSHIP
Asia Pacific Buy List Share price performance (%) 3 month 6 month 12 month
Absolute 21.4 38.0 36.7
Rel. to Taiwan SE Weighted Index 42.5 65.7 49.4
Coverage View: Neutral Source: Company data, Goldman Sachs Research estimates, FactSet. Price as of 10/24/2011 close.
Robert Yen Goldman Sachs does and seeks to do business with companies
+886(2)2730-4196 rob.yen@gs.com Goldman Sachs (Asia) L.L.C., Taipei Branch
Iris Wu
covered in its research reports. As a result, investors should be
+886(2)2730-4186 iris.wu@gs.com Goldman Sachs (Asia) L.L.C., Taipei Branch aware that the firm may have a conflict of interest that could
affect the objectivity of this report. Investors should consider
this report as only a single factor in making their investment
decision. For Reg AC see the end of the text. For other
important disclosures, see the Disclosure Appendix, or go to
www.gs.com/research/hedge.html. Analysts employed by non-
US affiliates are not registered/qualified as research analysts
with FINRA in the U.S.
The Goldman Sachs Group, Inc. Global Investment Research
3. October 24, 2011 E Ink Holdings Inc (8069.TWO)
E-reader market size update: quantifying the long-term
opportunity
Exhibit 1: Based on our assumptions, the accumulated e-reader market size by 2015E could reach c.340 mn units
Key assumptions for our estimate of the potential long-term e-reader market size
E-reader market size in the next 3-5 years (k units)
Consumer Demand 2009 2010 2011E 2012E 2013E 2014E 2015E
US Book Market, US$m
Trade print 5,127 4,864 4,621 4,390 4,170 3,962 3,764
yoy -1% -5% -5.0% -5.0% -5.0% -5.0% -5.0%
E-books 170 441 1,063 1,756 2,502 3,169 3,764
yoy 177% 160% 141% 65% 43% 27% 19%
Total trades 5,297 5,305 5,684 6,146 6,672 7,131 7,527
yoy 1% 0% 7% 8% 9% 7% 6%
E book share as total 3.2% 8.3% 18.7% 28.6% 37.5% 44.4% 50.0%
US Consumer Demand For E-reader
Bookworm factor 1.00 1.00 1.00 1.05 1.10 1.15 1.15
New demand US, k units 3,069 8,780 17,810 17,783 16,849 13,701 10,961
Installed base, k units 3,725 12,506 31,566 55,662 83,644 114,074 142,146
Replacement % 0% 10% 10% 20% 20% 20% 15%
Replacement demand, k units 0 373 1,251 6,313 11,132 16,729 17,111
US e-reader shipment, k units 3,069 9,153 19,060 24,097 27,982 30,430 28,072
US as % of global demand 90.0% 85.0% 70.0% 50.0% 40.0% 37.0% 35.0%
Global consumer e-reader shipment, k units 3,410 10,768 27,229 48,193 69,955 82,242 80,205 307,824
yoy 216% 153% 77% 45% 18% -2%
Corporate Demand 2009 2010 2011E 2012E 2013E 2014E 2015E
Corporate PC installed base, k units 618,930 656,853 699,931 750,962 750,962 750,962 750,962
% penetration of tablet/e-readers 5% 15% 20%
Corporate tablet/e-readers 37,548 75,096 37,548
% of e-readers 20% 20% 20%
Global corporate e-reader shipment (k units) 7,510 15,019 7,510 30,038
Consumer + Corporate Demand 27,229 48,193 77,465 97,262 87,715 337,863
Source: Association of American Publishers, Goldman Sachs Research estimates.
E-books/e-readers correlation: Given limited historical data, we assume a simple
linear correlation between the incremental growth of US e-books penetration and e-
readers as seen in 2010 (US e-books sales penetration jumped c.500 bps when US e-
reader shipment net rose nearly 6mn units) as the benchmark for our long-term e-
reader market size view.
E-books sales penetration: We assume US e-books sales could account for 50% of
total book sales by 2015 (vs. 8% in 2010). Based on Amazon’s e-book sales
surpassing print copies in January this year (suggesting e-book penetration reached
over 50% of total book sales), we consider 50% potential penetration as a
reasonable target for 2015.
US market weight in global e-reader shipment declining: We assume that US e-
readers as a percentage of global e-reader shipment could decline to 35% by 2015
from 85% in 2010. E Ink management commented that it expects Europe and Japan
markets to see strong e-reader demand growth, starting next year. Accordingly, we
expect the trend of digital reading gradually to spread to other regions besides the
US.
Consumer replacement demand: We expect most of the e-reader demand in the
coming two years to be mostly new demand as we do not think the current e-reader
roadmap provides compelling reasons for consumers to “upgrade” their existing e-
reader devices. However, we assume a modest replacement ratio from 2012, as we
expect the additional touch and color features to trigger some replacement demand
(we assume 20% of e-reader installed base).
Goldman Sachs Global Investment Research 3
4. October 24, 2011 E Ink Holdings Inc (8069.TWO)
“Bookworm” factor: In the early years of e-book sales and e-reader shipment
growth, the major driving force is likely to be those consumers who are categorised
as the “bookworm” grade readers, as they consumed more e-books per e-reader
than general consumers. Over the longer term, as e-reader prices continue to fall,
we believe that general consumers could become potential e-reader buyers, but
their contribution to e-books sales penetration would be lower than “bookworm”
readers. We select modest adjustment factors to accommodate such dynamics.
Enterprise market demand: E Ink management has indicated that it has been
working with some IT companies to bring e-readers to the corporate enterprise
market. The rationale is that instead of printing out long documents or emails onto
paper, E Ink hopes that enterprise users would print onto an e-reader to reduce the
financial and environmental cost associated with printer cartridges and paper. We
believe there are still many bottlenecks to overcome before this plan comes to
fruition, such as e-reader-desktop connection and security environment. Therefore,
we assume only a small portion more longer term, i.e. over 2013-2015, using the
corporate PC installed base as the benchmark.
3Q11 results beats on better GM; 4Q11 outlook in line
3Q results: E Ink posted 3Q EPS NT$2.08 (+70% qoq; +208% yoy), 45% better than
GSe NT$1.44 and 49% above Bloomberg consensus, driven by better GM (35.4% vs.
GSe 29.3% thanks to higher mix of EPD business).
Company guidance: 1) EPD shipment to be up qoq in 4Q (vs. GSe +3% qoq). No
change of 2011 full year EPD shipment guidance 25-30m units (vs. GSe 27.6m units).
2) 4Q GM is likely to be down qoq on increasing mix of LCD/FFS panel (vs. 35.4% in
3Q & GSe 31.9% in 4Q). 3) US market accounts for around 70% of global e-reader
demand this year. The chairman believes momentum from US market should be
sustainable, while Europe and Japan markets will ramp up starting 2012. 4)
Substantial sequential growth of FFS panel revenues in 4Q driven by tablet demand.
Exhibit 2: E Ink posted better 3Q unaudited results mainly on higher than expected GM
E Ink Holdings Inc. (8069.TWO) 3Q2011 2Q2011 (QoQ) 3Q2010 (YoY)
Summary P&L (NT$mn) Actual GS est. Diff (%) Actual % Actual %
Revenues 10,929 10,494 4% 6,926 58% 5,273 107%
Gross profits 3,869 3,075 26% 2,251 72% 1,648 135%
Operating profits 2,501 1,796 39% 1,126 122% 804 211%
Pretax earnings 2,517 1,758 43% 1,247 102% 992 154%
Net earnings 2,247 1,548 45% 1,325 70% 709 217%
EPS (NT$) 2.08 1.44 45% 1.23 70% 0.68 208%
Ratio analysis
Gross margin (%) 35.4% 29.3% 32.5% 31.3%
EBIT margin (%) 22.9% 17.1% 16.3% 15.2%
Net margin (%) 20.6% 14.8% 19.1% 13.4%
Source: Company data, Goldman Sachs Research estimates.
Goldman Sachs Global Investment Research 4
5. October 24, 2011 E Ink Holdings Inc (8069.TWO)
Exhibit 3: We raise 2011-13E EPS by 8-12 % on higher shipment and GM assumptions
E Ink Holdings Inc. (8069.TWO)
P&L (GAAP, NT$mn) 2011E New 2011E Old Diff. 2012E New 2012E Old Diff. 2013E New 2013E Old Diff.
Revenues 39,272 38,973 1% 50,375 47,183 7% 63,456 57,079 11%
Gross profits 12,645 11,632 9% 15,462 13,783 12% 18,267 15,832 15%
Operating profits 7,651 6,910 11% 9,413 8,664 9% 11,368 10,387 9%
Pretax earnings 7,758 6,968 11% 9,258 8,450 10% 11,250 10,195 10%
Net earnings 7,117 6,381 12% 7,961 7,316 9% 9,438 8,708 8%
EPS (fully diluted, NT$) 6.60 5.91 12% 7.38 6.78 9% 8.75 8.07 8%
Ratio analysis
Gross margin (%) 32.2% 29.8% 30.7% 29.2% 28.8% 27.7%
EBIT margin (%) 19.5% 17.7% 18.7% 18.4% 17.9% 18.2%
Tax & minority (as % of EBT) 8.3% 8.4% 14.0% 13.4% 16.1% 14.6%
Net margin (%) 18.1% 16.4% 15.8% 15.5% 14.9% 15.3%
Return analysis
ROA (%, annualized) 15.5% 14.7% 14.4% 14.7% 14.9% 15.4%
ROE (%, annualized) 27.1% 24.3% 25.5% 23.5% 25.4% 23.8%
Key assumptions 2011E New 2011E Old Diff. 2012E New 2012E Old Diff. 2013E New 2013E Old Diff.
EPD revenues (NT$mn) 28,387 27,935 2% 39,437 36,379 8% 51,059 44,720 14%
EPD shipment (k units) 27,642 28,204 -2% 46,476 45,761 2% 63,951 60,002 7%
EPD ASP (US$) 33.2 32.7 1% 27.6 26.7 3% 26.1 25.2 4%
E Ink's EPD global market share 91% 93% 86% 86% 74% 74%
FFS panel revenues ( NT$mn) 8,086 8,448 -4% 7,739 8,172 -5% 9,107 9,616 -5%
Total revenues (NT$mn) 39,272 38,973 1% 50,375 47,183 7% 63,456 57,079 11%
EPS (fully diluted, NT$) 6.60 5.91 12% 7.38 6.78 9% 8.75 8.07 8%
Source: Company data, Goldman Sachs Research estimates.
Exhibit 4: We believe E Ink appears attractive in terms of Exhibit 5: E Ink’s upward trending ROE implies share
its CROCI-generating ability price upside potential
EV/GCI (X) E Ink (8069.TWO) EV/GCI vs. CROCI CROCI P/B (X) E Ink (8069.TWO) P/B vs. ROE
EV/GCI (L) Avg. EV/GCI (L) CROCI (R) Avg. CROCI (R) 7.0 Fwd P/B (L) Avg P/B (L) ROE (R) Avg ROE (R) 30%
2.5 25%
25%
6.0
2.0 20% 20%
5.0
15%
Avg: 11%
1.5 15% 4.0
Avg: 8% 10%
Current: 1.3X
3.0 5%
1.0 10%
Avg: 0.9X
Avg: 2.0X Current: 2.2X 0%
2.0
-5%
0.5 5%
1.0
-10%
0.0 0% 0.0 -15%
Mar-04 Dec-04 Sep-05 Jun-06 Mar-07 Dec-07 Sep-08 Jun-09 Mar-10 Dec-10 Sep-11 Mar-04 Dec-04 Sep-05 Jun-06 Mar-07 Dec-07 Sep-08 Jun-09 Mar-10 Dec-10 Sep-11
Source: Company data, Datastream, Goldman Sachs Research estimates. Source: Company data, Datastream, Goldman Sachs Research estimates.
Goldman Sachs Global Investment Research 5
7. October 24, 2011 E Ink Holdings Inc (8069.TWO)
Reg AC
I, Robert Yen, hereby certify that all of the views expressed in this report accurately reflect my personal views about the subject company or
companies and its or their securities. I also certify that no part of my compensation was, is or will be, directly or indirectly, related to the specific
recommendations or views expressed in this report.
Investment Profile
The Goldman Sachs Investment Profile provides investment context for a security by comparing key attributes of that security to its peer group and
market. The four key attributes depicted are: growth, returns, multiple and volatility. Growth, returns and multiple are indexed based on composites
of several methodologies to determine the stocks percentile ranking within the region's coverage universe.
The precise calculation of each metric may vary depending on the fiscal year, industry and region but the standard approach is as follows:
Growth is a composite of next year's estimate over current year's estimate, e.g. EPS, EBITDA, Revenue. Return is a year one prospective aggregate
of various return on capital measures, e.g. CROCI, ROACE, and ROE. Multiple is a composite of one-year forward valuation ratios, e.g. P/E, dividend
yield, EV/FCF, EV/EBITDA, EV/DACF, Price/Book. Volatility is measured as trailing twelve-month volatility adjusted for dividends.
Quantum
Quantum is Goldman Sachs' proprietary database providing access to detailed financial statement histories, forecasts and ratios. It can be used for
in-depth analysis of a single company, or to make comparisons between companies in different sectors and markets.
GS SUSTAIN
GS SUSTAIN is a global investment strategy aimed at long-term, long-only performance with a low turnover of ideas. The GS SUSTAIN focus list
includes leaders our analysis shows to be well positioned to deliver long term outperformance through sustained competitive advantage and
superior returns on capital relative to their global industry peers. Leaders are identified based on quantifiable analysis of three aspects of corporate
performance: cash return on cash invested, industry positioning and management quality (the effectiveness of companies' management of the
environmental, social and governance issues facing their industry).
Disclosure Appendix
Coverage group(s) of stocks by primary analyst(s)
Robert Yen: Asia Pacific Technology.
Asia Pacific Technology: AAC Technologies, Acer, ASUSTeK Computer, AU Optronics, BYD Electronic, Catcher Technology, Cheng Uei Precision
(Foxlink), Chimei Innolux, China Wireless Technologies, Compal Communications, Compal Electronics, Coretronic, Delta Electronics, E Ink Holdings
Inc, Epistar, Everlight Electronics, Foxconn Int'l Holdings, Foxconn Technology, Hon Hai Precision, HTC Corp., Largan Precision, Lenovo Group, Lite-
On Technology, Novatek Microelectronics, Pegatron, Quanta Computer, Radiant Opto-Electronics, Silitech Technology, SK C&C, TCL
Communication, TPK Holding, TPV Technology, Wintek, Wistron, Young Fast Optoelectronics.
Company-specific regulatory disclosures
The following disclosures relate to relationships between The Goldman Sachs Group, Inc. (with its affiliates, "Goldman Sachs") and companies
covered by the Global Investment Research Division of Goldman Sachs and referred to in this research.
Goldman Sachs expects to receive or intends to seek compensation for investment banking services in the next 3 months: E Ink Holdings Inc
(NT$69.70)
Distribution of ratings/investment banking relationships
Goldman Sachs Investment Research global coverage universe
Rating Distribution Investment Banking Relationships
Buy Hold Sell Buy Hold Sell
Global 31% 55% 14% 50% 43% 36%
As of October 1, 2011, Goldman Sachs Global Investment Research had investment ratings on 3,198 equity securities. Goldman Sachs assigns
stocks as Buys and Sells on various regional Investment Lists; stocks not so assigned are deemed Neutral. Such assignments equate to Buy, Hold
and Sell for the purposes of the above disclosure required by NASD/NYSE rules. See 'Ratings, Coverage groups and views and related definitions'
below.
Goldman Sachs Global Investment Research 7
8. October 24, 2011 E Ink Holdings Inc (8069.TWO)
Price target and rating history chart(s)
E Ink Holdings Inc (8069.TWO) Stock Price Currency : Taiw an Dollar
Goldman Sachs rating and stock price target history
100 10,000
80 80 82
50 68
80 47 9,000
42
43
8,000
60
7,000
40 78
82 100 6,000
20 5,000
0 4,000
Apr 15 Sep 13
Stock Price
Index Price
S B
N D J F MA M J J A S O N D J F MA MJ J A S O N D J F MA M J J A S
2008 2009 2010 2011
Source: Goldman Sachs Investment Research for ratings and price targets; FactSet closing prices as of 9/30/2011.
Rating Covered by Robert Yen,
Price target as of Apr 15, 2010
Price target at removal Not covered by current analyst
Taiw an SE Weighted
Index
The price targets show n should be considered in the context of all prior published Goldman Sachs research, w hich may or
may not have included price targets, as w ell as developments relating to the company, its industry and f inancial markets.
Regulatory disclosures
Disclosures required by United States laws and regulations
See company-specific regulatory disclosures above for any of the following disclosures required as to companies referred to in this report: manager
or co-manager in a pending transaction; 1% or other ownership; compensation for certain services; types of client relationships; managed/co-
managed public offerings in prior periods; directorships; for equity securities, market making and/or specialist role. Goldman Sachs usually makes a
market in fixed income securities of issuers discussed in this report and usually deals as a principal in these securities.
The following are additional required disclosures: Ownership and material conflicts of interest: Goldman Sachs policy prohibits its analysts,
professionals reporting to analysts and members of their households from owning securities of any company in the analyst's area of coverage.
Analyst compensation: Analysts are paid in part based on the profitability of Goldman Sachs, which includes investment banking revenues.
Analyst as officer or director: Goldman Sachs policy prohibits its analysts, persons reporting to analysts or members of their households from
serving as an officer, director, advisory board member or employee of any company in the analyst's area of coverage. Non-U.S. Analysts: Non-U.S.
analysts may not be associated persons of Goldman Sachs & Co. and therefore may not be subject to NASD Rule 2711/NYSE Rules 472 restrictions
on communications with subject company, public appearances and trading securities held by the analysts.
Distribution of ratings: See the distribution of ratings disclosure above. Price chart: See the price chart, with changes of ratings and price targets
in prior periods, above, or, if electronic format or if with respect to multiple companies which are the subject of this report, on the Goldman Sachs
website at http://www.gs.com/research/hedge.html.
Additional disclosures required under the laws and regulations of jurisdictions other than the United
States
The following disclosures are those required by the jurisdiction indicated, except to the extent already made above pursuant to United States laws
and regulations. Australia: This research, and any access to it, is intended only for "wholesale clients" within the meaning of the Australian
Corporations Act. Brazil: Disclosure information in relation to CVM Instruction 483 is available at http://www.gs.com/worldwide/brazil/gir/index.html.
Where applicable, the Brazil-registered analyst primarily responsible for the content of this research report, as defined in Article 16 of CVM
Instruction 483, is the first author named at the beginning of this report, unless indicated otherwise at the end of the text. Canada: Goldman Sachs
& Co. has approved of, and agreed to take responsibility for, this research in Canada if and to the extent it relates to equity securities of Canadian
issuers. Analysts may conduct site visits but are prohibited from accepting payment or reimbursement by the company of travel expenses for such
visits. Hong Kong: Further information on the securities of covered companies referred to in this research may be obtained on request from
Goldman Sachs (Asia) L.L.C. India: Further information on the subject company or companies referred to in this research may be obtained from
Goldman Sachs (India) Securities Private Limited; Japan: See below. Korea: Further information on the subject company or companies referred to
in this research may be obtained from Goldman Sachs (Asia) L.L.C., Seoul Branch. Russia: Research reports distributed in the Russian Federation
are not advertising as defined in the Russian legislation, but are information and analysis not having product promotion as their main purpose and
do not provide appraisal within the meaning of the Russian legislation on appraisal activity. Singapore: Further information on the covered
companies referred to in this research may be obtained from Goldman Sachs (Singapore) Pte. (Company Number: 198602165W). Taiwan: This
material is for reference only and must not be reprinted without permission. Investors should carefully consider their own investment risk.
Investment results are the responsibility of the individual investor. United Kingdom: Persons who would be categorized as retail clients in the
United Kingdom, as such term is defined in the rules of the Financial Services Authority, should read this research in conjunction with prior
Goldman Sachs research on the covered companies referred to herein and should refer to the risk warnings that have been sent to them by
Goldman Sachs International. A copy of these risks warnings, and a glossary of certain financial terms used in this report, are available from
Goldman Sachs International on request.
European Union: Disclosure information in relation to Article 4 (1) (d) and Article 6 (2) of the European Commission Directive 2003/126/EC is
available at http://www.gs.com/client_services/global_investment_research/europeanpolicy.html which states the European Policy for Managing
Conflicts of Interest in Connection with Investment Research.
Japan: Goldman Sachs Japan Co., Ltd. is a Financial Instrument Dealer under the Financial Instrument and Exchange Law, registered with the
Kanto Financial Bureau (Registration No. 69), and is a member of Japan Securities Dealers Association (JSDA) and Financial Futures Association of
Japan (FFAJ). Sales and purchase of equities are subject to commission pre-determined with clients plus consumption tax. See company-specific
disclosures as to any applicable disclosures required by Japanese stock exchanges, the Japanese Securities Dealers Association or the Japanese
Securities Finance Company.
Ratings, coverage groups and views and related definitions
Buy (B), Neutral (N), Sell (S) -Analysts recommend stocks as Buys or Sells for inclusion on various regional Investment Lists. Being assigned a Buy
or Sell on an Investment List is determined by a stock's return potential relative to its coverage group as described below. Any stock not assigned
as a Buy or a Sell on an Investment List is deemed Neutral. Each regional Investment Review Committee manages various regional Investment
Lists to a global guideline of 25%-35% of stocks as Buy and 10%-15% of stocks as Sell; however, the distribution of Buys and Sells in any particular
Goldman Sachs Global Investment Research 8
9. October 24, 2011 E Ink Holdings Inc (8069.TWO)
coverage group may vary as determined by the regional Investment Review Committee. Regional Conviction Buy and Sell lists represent
investment recommendations focused on either the size of the potential return or the likelihood of the realization of the return.
Return potential represents the price differential between the current share price and the price target expected during the time horizon associated
with the price target. Price targets are required for all covered stocks. The return potential, price target and associated time horizon are stated in
each report adding or reiterating an Investment List membership.
Coverage groups and views: A list of all stocks in each coverage group is available by primary analyst, stock and coverage group at
http://www.gs.com/research/hedge.html. The analyst assigns one of the following coverage views which represents the analyst's investment
outlook on the coverage group relative to the group's historical fundamentals and/or valuation. Attractive (A). The investment outlook over the
following 12 months is favorable relative to the coverage group's historical fundamentals and/or valuation. Neutral (N). The investment outlook
over the following 12 months is neutral relative to the coverage group's historical fundamentals and/or valuation. Cautious (C). The investment
outlook over the following 12 months is unfavorable relative to the coverage group's historical fundamentals and/or valuation.
Not Rated (NR). The investment rating and target price have been removed pursuant to Goldman Sachs policy when Goldman Sachs is acting in
an advisory capacity in a merger or strategic transaction involving this company and in certain other circumstances. Rating Suspended (RS).
Goldman Sachs Research has suspended the investment rating and price target for this stock, because there is not a sufficient fundamental basis
for determining, or there are legal, regulatory or policy constraints around publishing, an investment rating or target. The previous investment
rating and price target, if any, are no longer in effect for this stock and should not be relied upon. Coverage Suspended (CS). Goldman Sachs has
suspended coverage of this company. Not Covered (NC). Goldman Sachs does not cover this company. Not Available or Not Applicable (NA).
The information is not available for display or is not applicable. Not Meaningful (NM). The information is not meaningful and is therefore excluded.
Global product; distributing entities
The Global Investment Research Division of Goldman Sachs produces and distributes research products for clients of Goldman Sachs, and
pursuant to certain contractual arrangements, on a global basis. Analysts based in Goldman Sachs offices around the world produce equity
research on industries and companies, and research on macroeconomics, currencies, commodities and portfolio strategy. This research is
disseminated in Australia by Goldman Sachs & Partners Australia Pty Ltd (ABN 21 006 797 897) on behalf of Goldman Sachs; in Brazil by Goldman
Sachs do Brasil Banco Múltiplo S.A.; in Canada by Goldman Sachs & Co. regarding Canadian equities and by Goldman Sachs & Co. (all other
research); in Hong Kong by Goldman Sachs (Asia) L.L.C.; in India by Goldman Sachs (India) Securities Private Ltd.; in Japan by Goldman Sachs
Japan Co., Ltd.; in the Republic of Korea by Goldman Sachs (Asia) L.L.C., Seoul Branch; in New Zealand by Goldman Sachs & Partners New
Zealand Limited on behalf of Goldman Sachs; in Russia by OOO Goldman Sachs; in Singapore by Goldman Sachs (Singapore) Pte. (Company
Number: 198602165W); and in the United States of America by Goldman Sachs & Co. Goldman Sachs International has approved this research in
connection with its distribution in the United Kingdom and European Union.
European Union: Goldman Sachs International, authorized and regulated by the Financial Services Authority, has approved this research in
connection with its distribution in the European Union and United Kingdom; Goldman Sachs AG, regulated by the Bundesanstalt für
Finanzdienstleistungsaufsicht, may also distribute research in Germany.
General disclosures
This research is for our clients only. Other than disclosures relating to Goldman Sachs, this research is based on current public information that we
consider reliable, but we do not represent it is accurate or complete, and it should not be relied on as such. We seek to update our research as
appropriate, but various regulations may prevent us from doing so. Other than certain industry reports published on a periodic basis, the large
majority of reports are published at irregular intervals as appropriate in the analyst's judgment.
Goldman Sachs conducts a global full-service, integrated investment banking, investment management, and brokerage business. We have
investment banking and other business relationships with a substantial percentage of the companies covered by our Global Investment Research
Division. Goldman Sachs & Co., the United States broker dealer, is a member of SIPC (http://www.sipc.org).
Our salespeople, traders, and other professionals may provide oral or written market commentary or trading strategies to our clients and our
proprietary trading desks that reflect opinions that are contrary to the opinions expressed in this research. Our asset management area, our
proprietary trading desks and investing businesses may make investment decisions that are inconsistent with the recommendations or views
expressed in this research.
The analysts named in this report may have from time to time discussed with our clients, including Goldman Sachs salespersons and traders, or
may discuss in this report, trading strategies that reference catalysts or events that may have a near-term impact on the market price of the equity
securities discussed in this report, which impact may be directionally counter to the analysts' published price target expectations for such stocks.
Any such trading strategies are distinct from and do not affect the analysts' fundamental equity rating for such stocks, which rating reflects a stock's
return potential relative to its coverage group as described herein.
We and our affiliates, officers, directors, and employees, excluding equity and credit analysts, will from time to time have long or short positions in,
act as principal in, and buy or sell, the securities or derivatives, if any, referred to in this research.
This research is not an offer to sell or the solicitation of an offer to buy any security in any jurisdiction where such an offer or solicitation would be
illegal. It does not constitute a personal recommendation or take into account the particular investment objectives, financial situations, or needs of
individual clients. Clients should consider whether any advice or recommendation in this research is suitable for their particular circumstances and,
if appropriate, seek professional advice, including tax advice. The price and value of investments referred to in this research and the income from
them may fluctuate. Past performance is not a guide to future performance, future returns are not guaranteed, and a loss of original capital may
occur. Fluctuations in exchange rates could have adverse effects on the value or price of, or income derived from, certain investments.
Certain transactions, including those involving futures, options, and other derivatives, give rise to substantial risk and are not suitable for all
investors. Investors should review current options disclosure documents which are available from Goldman Sachs sales representatives or at
http://www.theocc.com/about/publications/character-risks.jsp. Transactions cost may be significant in option strategies calling for multiple purchase
and sales of options such as spreads. Supporting documentation will be supplied upon request.
All research reports are disseminated and available to all clients simultaneously through electronic publication to our internal client websites. Not
all research content is redistributed to our clients or available to third-party aggregators, nor is Goldman Sachs responsible for the redistribution of
our research by third party aggregators. For all research available on a particular stock, please contact your sales representative or go to
http://360.gs.com.
Disclosure information is also available at http://www.gs.com/research/hedge.html or from Research Compliance, 200 West Street, New York, NY
10282.
Copyright 2011 Goldman Sachs.
Goldman Sachs Global Investment Research 9
10. October 24, 2011 E Ink Holdings Inc (8069.TWO)
No part of this material may be (i) copied, photocopied or duplicated in any form by any means or (ii) redistributed without the
prior written consent of The Goldman Sachs Group, Inc.
Goldman Sachs Global Investment Research 10