CO2 Effect on Ultrasonic Flow Measurement for Flare Gas
•
2 gefällt mir•753 views

The objective is to analyze and propose a methodology to manage with the attenuating effect promoted by carbon dioxide - CO2 on the performance of ultrasonic flow meter in gas flaring applications. Such methodology is based on experiments performed in a wind tunnel with a Reynolds number about 10^4 and concentration of CO2 above 60%. The results indicate that the ultrasonic meter exhibited measurement readings failures, especially in stages of abrupt changes in gas concentration, whose contents were above 5%. It is verified, as well, that the approximation of ultrasonic transducers tends to reduce such measurement failures.

Empfohlen
Empfohlen
Weitere ähnliche Inhalte
Was ist angesagt?
Was ist angesagt? (20)
Ähnlich wie CO2 Effect on Ultrasonic Flow Measurement for Flare Gas
Ähnlich wie CO2 Effect on Ultrasonic Flow Measurement for Flare Gas (20)
Kürzlich hochgeladen
Kürzlich hochgeladen (20)
CO2 Effect on Ultrasonic Flow Measurement for Flare Gas
- 1. Proceedings of ENCIT 2016 16th Brazilian Congress of Thermal Sciences and Engineering Copyright © 2012 by ABCM November 07-10th , 2016, Vitória, ES, Brazil ANALYSIS OF THE INDUCED VARIABILITY BY CO2 IN READINGS OF ULTRASONIC FLOW METERS FOR FLARE GAS Weverton Barros, weverton.fb@gmail.com Rogério Ramos, ramosrogerio@hotmail.com Universidade Federal do Espírito Santo – UFES, 29075-910, Vitória, ES, Brazil Abstract. The objective is to analyze and propose a methodology to manage with the attenuating effect promoted by carbon dioxide - CO2 on the performance of ultrasonic flow meter in gas flaring applications. Such methodology is based on experiments performed in a wind tunnel with a Reynolds number about 104 and concentration of CO2 above 60%. The results indicate that the ultrasonic meter exhibited measurement readings failures, especially in stages of abrupt changes in gas concentration, whose contents were above 5%. It is verified, as well, that the approximation of ultrasonic transducers tends to reduce such measurement failures. Keywords: ultrasonic flow meter, gas flare, attenuation, carbon dioxide 1. INTRODUCTION Oil and gas industry production has by being subjected to strict regulations about flow measurement, as highlighted in Brazil by the publication of Portaria Conjunta ANP/INMETRO no. 1 (2000). It is the first document that regulates the conditions and proceedings for operational and fiscal metering of hydrocarbons flows. Recently, this regulation was updated to the Resolução Conjunta ANP/INMETRO no. 1 (2013). In this way, the publication of American Gas Association - AGA report no. 9 (1998), encourages new studies about ultrasonic technologies for natural gas flow measurements. The latest edition of this report (2007) states that high concentrations of CO2 subject ultrasonic meters to an operating condition of high attenuation due to chemical characteristics of that gas. Such warnings were discussed by Markham et. al. (1951), Ejakov et. al. (2002) and Matson et. al. (2010), grounding that the acoustic attenuation in gases is based on the phenomena of classical absorption, as well as the additional effect of molecular relaxation, capable of reducing significantly the intensity of the ultrasonic signal received by the transducers. The preference for such technology for gas flaring applications consider several intrinsic advantages, as: (i) operation in a wide flow range (typically more than 50:1), (ii) tolerance to wet gas, (iii) non-intrusive installation and (iv) no moving parts. An important feature of ultrasonic flow meters - UFM is dealt by the publication of AGA report no. 10 (2003) which allows estimating, at low uncertainty, the speed of sound for natural gas through an virial equation that considers chemical composition and the thermodynamic state of the mixture, serving as reference for the speed of sound measured by UFM. In respect to the effect of sonic attenuating in the meter operation, the exponential Lambert-Beer law for mixed gases describes that acoustic pressure - p, associated to the ultrasonic wave is inversely proportional to the distance between the transducers - L and a coefficient of attenuation - αi, specific to each gaseous component, as presented in Eq. (1). LCC o epp ...)( 2211 ++− = αα (1) In Eq. (1), po is the initial acoustic pressure and Ci is the concentration of i-esime chemical component. Aiming to increase p, some comments can be addressed to the attenuating effect of each variable, by observing Eq. (1): a) Increasing the initial acoustic pressure - p0: this parameter is related to the flow/transducer adherence but it is not a viable practice in a gas flare piping system, although it can be achieved in higher-pressure gas line. To intensify the ultrasonic pulse and p, a straight way suggestion may increment the respective electric power for the transducers excitation, but its value is limited by the intrinsic safety of the equipment; b) Changing composition of natural gas - Ci: is not a viable task, since composition is determined by the gas reservoir; c) Reducing distance between transducers - L: an approach, assessed by Helden et. al. (2009) and Vermeulen et. al. (2013), indicates that approximation the transducers tends to make the readings of UFM more viable, since the intensity of the received signal - p tends to increase as transducers becomes closer to each other. In such case, it should consider changing flow (turbulence, swirl, vortices) near transducers, aim of present work; d) Transducers frequency - w: transducers operating at higher frequencies intensifies the acoustic absorption. However, at lower frequencies, typical noises generated by industrial plants are more intense and may generate insufficient acoustic pressures for large diameter of pipes, as typically occurs in flaring facilities.
- 2. Proceedings of ENCIT 2016 16th Brazilian Congress of Thermal Sciences and Engineering Copyright © 2012 by ABCM November 07-10th , 2016, Vitória, ES, Brazil The present study explores the analysis performed by Barros (2016), where it is experimentally attempted to identify the attenuation promoted by high concentration of CO2 on ultrasonic flow measurement operating in wind tunnel and the respective quality of the flow readings. In order to reduce such attenuation, the effect of transducer approximation is analyzed, as well. 2. TRANSIT TIME ULTRASONIC FLOW METER FUNDAMENTALS Figure 1 show a basic installation for a ultrasonic flow meter of single acoustic path, its typical elements and the main parameters of analysis, usually known. Figure 1. Basic installation of single acoustic path ultrasonic flow meter. At least one pair of ultrasonic transducers, that generates ultrasonic pulses, composes such devices. It is measured the transit time that a launched pulse takes to travel through the flow, on the acoustic path of length L and inclination θ. Due to the flow direction, transit time tAB, for the mechanical wave emitted from transducer A to B, moves faster than time from transducer B to A - tBA, against the flow. The difference between tAB and tBA is proportional to the average speed flow. The respective pulse speeds, transmitted upstream VAB and downstream VBA, can be determined by the Eqs. (2) and (3), when considering the speed of sound c in the medium and a vector projection of flow velocity V, representing the influence of flow velocity field on acoustic path. θcosVc t L V AB AB +== (2) θcosVc t L V BA BA −== (3) The unknowns V and c are obtained by solving the algebraic system composed by the Eqs. (2) and (3), getting explicit solutions as pointed out by Eqs. (4) and (5), respectively. − = BAAB ABBA tt ttD V .2sin θ (4) + = BAAB BAAB tt ttD c .sin2 θ (5) But the knowledge of actual bulk flow velocity is not straight way from Eq. (4). Since velocity V, calculated by Eq. (4), is obtained by ultrasonic pulse traveling on acoustic path, it does not represent the actual flow velocity field. Bulk flow velocity is obtained from a later multiplication of V by a profile factor, proportional to Reynolds number - Re. Despite this adjustment being not included in the scope of this paper, it is important to note that the determination of the volumetric flow in flare lines is not something so simple, once that velocity field is often affected by swirl and asymmetric effects, representing a hard task the adequacy to uncertainties to regulatory criteria. Speed of sound, obtained by Eq. (5), is also a by-product originated from the transit time readings. Thus, changing any of the parameters listed in Eqs. (4) and (5) directly affects the estimation of both: the flow speed and the measurement θ
- 3. Proceedings of ENCIT 2016 16th Brazilian Congress of Thermal Sciences and Engineering Copyright © 2012 by ABCM November 07-10th , 2016, Vitória, ES, Brazil of speed of sound. Transducers approximation reduces the transit times, but involving only a specific core area of the velocity profile. By comparison of measured speed of sound c and estimation through reference AGA 10 (2003), based on chemical composition and thermodynamic state, allows diagnosing whether the transit times are being measured properly. For metering systems exposed to attenuating gaseous mixtures, such as flare pipes, this procedure is especially appealing. 3. WIND TUNNEL CONFIGURATION Experiments were carried out in an open circuit wind tunnel, average internal diameter of 182 mm (∅nominal = 8"), which exhibits hydrodynamic similarity to flare gas flow lines, according to Salgado and Ramos (2009). The internal pressure is slightly below atmospheric pressure, considering aspirated operation of the wind tunnel. An ultrasonic flow meter model GE XGF868i, operational frequency of 100 kHz is installed. As a reference meter, an automated Pitot tube is positioned downstream to the ultrasonic meter. In order to reduce the sonic attenuation by high CO2 concentration, it is proposed a methodology based on approximation of transducers, since the transducer distance is an important parameter in Eq. (1). But first of all, it is necessary to evaluate the effect of insertion of transducers only in the flow measurement readings. So, tests were carried out with only atmospheric air flow, at Re ≈ 105 , approximately. Initially, flow readings are statistically evaluated with transducers aligned to the inner tube wall, subsequently, reducing the acoustic distance down to 70% of the original value. Later, such reduced distance configuration were reproduced for tests at high CO2 concentration, whose Re ≈ 104 , when gas concentrations reaches above 60%. In those experiments, flow parameters, as well as speed of sound and ultrasonic signal strength were registered and evaluated. The occurrences of observed measurement failures were quantified during operation UFM under such conditions and taken into consideration to establish a performance criterion. Such indicator refers to the flow velocity and speed of sound readings, which were carried out within the scope of criteria set out below: – Criterion A: failure by negative flow readings, given that the wind tunnel promotes a flow in one direction only; – Criterion B: failure by unacceptable discrepancy between speed of sound readings and its theoretical estimation through state equation; – Criterion C: failure by signal strength level, as indicated by the meter, due to reduction of the ultrasonic signal perceived by receiving transducer. The quantification of those events was performed by cumulative failure rates: (A), (A+B) and (A+B+C). The latter two criteria are representatives of conjoint analysis of, at least, two other criteria. For comparison of failure criteria application on measured accumulation, the volume of accumulated gas was estimated after filtering the flow readings, according to the established criteria. The authors consider that other indicators could be evaluated. However, it is understood that established criteria: (A), (A+B) and (A+B+C), are based on objective observation, no restrictions to be applied in industrial plants and present the advantage of being performed even in the absence of a reference flow measurement. 4. ANALYSIS AND DISCUSSIONS The evaluation of transducers insertion in pure airflow is dealt in section 4.1, while the analysis of the UFM performance at high CO2 concentration is addressed in section 4.2. 4.1 Effects of transducers approximation in air flow Table 1 shows a comparative analysis of flow readings at two distinct positions of transducers: aligned to inner tube wall and approximating to tube axis (reduced transducer distance). The magnitude Nm3 /h is relative to the adopted state reference (temperature of 20 °C and pressure at 1 atm). Environmental temperature was registered as 27 °C and the relative humidity at 65%, approximately. The samples variability were defined by statistical parameters: arithmetic mean - Q, standard deviation - σ and coefficient of variation - Δ. From Tab. 1, the flow rate registered by UFM was lower in the approximated transducers arrangement. This is due to the fact that, in such configuration, the acoustic path traverses only a portion of the flow at closest region to the tube axis, producing then an underestimated reading. Observing the coefficient of variation, as defined in Tab. 1, it can be deduced that, for the Reynolds range adopted, the insertion of the sensing elements in the flow produces more unstable flow readings. Such behavior is associated to turbulence effects and the increasing amplitude of transducer vibration, which is induced by drag flow. Same behaviors should be considered in the corresponding analysis in high CO2 content, as well.
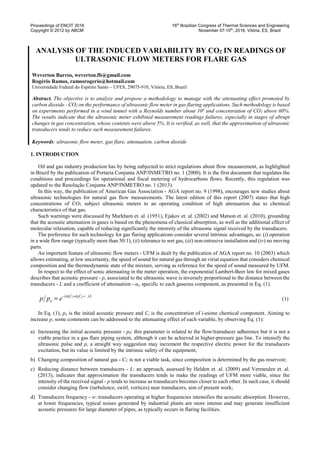
- 4. Proceedings of ENCIT 2016 16th Brazilian Congress of Thermal Sciences and Engineering Copyright © 2012 by ABCM November 07-10th , 2016, Vitória, ES, Brazil Table 1. Effect of ultrasonic transducers insertion on the flow readings. Aligned transducers on inner pipe wall Parameters Re = 1.3x10⁵ Re = 2.3x10⁵ Re = 3.3x10⁵ Pitot UFM Pitot UFM Pitot UFM Q (Nm³/h) 1082.12 1071.34 1789.15 1833.63 2629.74 2756.97 σ (Nm³/h) 26.80 16.91 24.75 32.53 28.83 31.67 Δ (%) 2.48 1.58 1.38 1.77 1.10 1.15 Approximated transducers Parameters Re = 1.3x10⁵ Re = 2.3x10⁵ Re = 3.3x10⁵ Pitot UFM Pitot UFM Pitot UFM Q (Nm³/h) 970.84 1024.29 1587.69 1786.20 2307.81 2628.21 σ (Nm³/h) 26.08 24.35 11.60 44.90 18.73 33.85 Δ (%) 2.69 2.38 0.73 2.51 0.81 1.29 4.2 Variability induced by CO2 The raw data obtained by UFM at high concentration of CO2 can be verified in Figs. (2-4). Figure 2. Readings identified by the flow readings obtained under CO2 variation. Figure 3. Speed of sound - SOS readings obtained under CO2 variation. In Figs. (2-3) it can be seen the occurrence of failures associated to negative flow (criterion A) and discrepancy of the speed of sound (criterion B) as CO2 concentration increases. -400 -300 -200 -100 0 100 200 300 400 0 20 40 60 80 100 0 160 320 480 640 Flowrate(Nm³/h) CO2(%) Readings % CO2 Flow rate 0 100 200 300 400 500 600 700 0 20 40 60 80 100 0 160 320 480 640 Speedofsound(m/s) CO2(%) Readings % CO2 SOS Criterion A Criterion B
- 5. Proceedings of ENCIT 2016 16th Brazilian Congress of Thermal Sciences and Engineering Copyright © 2012 by ABCM November 07-10th , 2016, Vitória, ES, Brazil Figure (4) shows the errors identified by ultrasonic signal strength readings, according to the criterion C (signal strength), whose failures are more frequent in events of highest variation in CO2 concentration. During operation, the environmental temperature was registered at 28 °C and relative humidity at 65%, approximately. Figure 4. Shaded areas highlights warning signals of error from the monitoring interface of ultrasonic meter data. Clearly, it can be seen in the Fig. (4) a relation of proportionality between the reduction of signal strength - SS received by the transducers and the CO2 content in the mixture, indicating the attenuating characteristic of this gas. Reading errors indicated in Figs. (2-4) were accounted for the failure rate, as shown in the Tab. 2. Table 2. Accounted errors after the application of filtering criteria on flow readings. Criterion (A) Criterion (A+B) Criterion (A+B+C) N°. of failures during test 97 185 257 Failure rate (%) 21.1 40.2 55.9 Accumulated volume (Nm³) 6.9 4.5 3.4 Δ Accumulated Vol. (%) - -34.7 -50.3 The present case was performed on 460 flow readings obtained in concentration over 5% of CO2. According to Tab. 2, the methodological purge failures on only one criterion of flow readings history already indicates a considerable percentage of reading errors: 21% for criterion (A) and 40.2% for criterion (A+B). After applying all three criteria, occurrences exceeds 50% in relation to total recorded readings. The removal of such samples produced a significant reduction of accumulated gas volume, which is estimated by the positive area under the flow curve of Fig. (2). So, such flow conditions in flare lines and considering the application of the proposed failure criteria would reduce the measured gas volume by about 50% that was initially estimated by the meter, indicating how inaccurate this technology can be in applications with high CO2 levels. The events for purging readings failures may be better characterized by stratification for levels of CO2 concentrations produced in the experiment, as shown in Tab. 3. Table 3. Failure rate obtained after application of each criterion on the recorded samples. CO2 (%) Samples (%) Accumulated failure rate (%) Criterion (A) Criterion (A+B) Criterion (A+B+C) 05 – 20 14.6 16.4 43.3 43.3 20 – 40 4.1 100.0 100.0 100.0 40 – 60 1.1 100.0 100.0 100.0 60 – 80 35.9 6.1 6.1 22.4 80 – 100 44.3 25.5 59.8 81.9 Table 3 shows that, at concentration of CO2 ranges between 5 and 60%, all failures were identified by criteria (A) and (B). At levels (20-40) and (40-60)%, 100% of readings were removed by only criterion (A). However, at ranges between (60-100)% of CO2, the criterion (C) was dominant in characterizing the reading failure. 55 60 65 70 75 80 85 0 20 40 60 80 100 0 160 320 480 640 SignalStregth CO2(%) Readings % CO2 SS Downstream SS Upstream Criterion C
- 6. Proceedings of ENCIT 2016 16th Brazilian Congress of Thermal Sciences and Engineering Copyright © 2012 by ABCM November 07-10th , 2016, Vitória, ES, Brazil It is necessary to highlight the recorded flow readings in a mixture composition at CO2 levels above 60%, representing 80.2% of all samples produced. At the highest gas concentration level, failures were detected in more than 80% of the measurements, indicating that the attenuating effect tends to be exacerbated for higher concentrations of CO2. Such failure rates listing performs the main purpose to proceed a comparative investigation of reading errors produced in distinct configurations: (i) internal aligned transducers and (ii) approximated transducers, which are presented in the next section. A further analysis deals with the variability of the flow measurements under test conditions. Readings intervals were obtained at relatively stable levels of chemical composition, as seen in Fig. 5. Figure 5. Summary of flow readings recorded at stable CO2 levels. The flow measurements are synchronized at each of five gas concentration levels, whose respective variability can be seen in Tab. 4. Table 4. Variability of the flow readings at Re ≈ 104 . CO2 (%) Q (Nm³/h) σ (Nm³/h) Δ (%) 0.16 14.09 1.07 7.61 34 21.66 2.14 9.89 50 46.93 5.99 12.76 67 72.67 22.33 30.73 80 107.43 32.87 30.59 It is observed that, even under atmospheric conditions (0.16% CO2), the meter exhibited readings with dispersion over 7% around its average. Such behavior is explained by the fact that, at low flow rate, the emitted and received transit times become too close to each other, producing a non-representative difference of pulse transit time, not enough to the transducer resolution, thus generating less stable readings. At higher Reynolds numbers (Re ≈ 105 ), variability is around to just 2%, as seen in Tab. 1. The decision to operate at reduced speeds (Re ≈ 104 ) in CO2 effects tests is due to the need to achieve high concentrations of gas in an open circuit flow wind tunnel. It is understood that the greater variability of readings perceived after the increase in CO2 comes from the reduction of the signal intensity received by transducers, generated by this gas. The attenuation of the ultrasonic beam may provide pulses so weakened in piezoelectric crystal of receiver transducer so as to become farther from the characteristic resonant frequency of the crystal, increasing the measurement uncertainty. The evidence that the UFM remained calibrated throughout the tests was conducted with the study of percentage deviation δ of measured speed of sound in comparison with the reference, that was based on the equation of state provided by AGA 10, according to the Tab. 5. It is noted that the rise of concentration of CO2 produced an increase in deviation, suggesting that higher concentrations of this compound contribute to an additional reduction of the speed of sound measured by the UFM. Despite the meter having remained enabled during the tests, attenuation of the ultrasonic signal promotes, as expected, less accurate estimates of speed of sound. 0 20 40 60 80 100 0 100 200 300 400 500 0 50 100 150 200 250 300 CO2(%) Flowrate(Nm³/h) Readings Flow rate Pitot Flow rate UFM % CO2
- 7. Proceedings of ENCIT 2016 16th Brazilian Congress of Thermal Sciences and Engineering Copyright © 2012 by ABCM November 07-10th , 2016, Vitória, ES, Brazil Table 5. Behavior of the measured speed of sound cUFM in relation to the adopted reference cAGA. CO2 (%) cAGA (m/s) cUFM (m/s) δ (%) 0.62 347.17 344.19 -0.86% 22.70 324.40 318.90 -1.69% 75.00 284.21 273.11 -3.90% 91.60 273.96 261.58 -4.52% 4.3 Effects of transducers approximation at high CO2 concentration In order to reduce the occurrence of failures resulted by the presence of CO2, the acoustic path was reduced, since it is inferred to be a suitable procedure for raising the acoustic pressure received by transducer, as indicated by Eq. (1). The interval in Figs. (6-8) expresses the readings obtained by such new scenario, reducing to 70% the distance between the transducers, seeking to reproduce flow conditions similar to those of inner aligned configuration. Figure 6. Flow readings recorded in approximated transducers configuration. Figure 7. Speed of sound readings recorded in approximated transducers configuration. It can be noted in Figs. (6-7), the occurrence of readings failures associated to negative flow registers, as well as discrepancies in speed of sound. In Fig. (8), shaded area indicate error warning interval, as reported by metering process. As expected, reducing the distance between sensors increases the intensity of received ultrasonic beam, in accordance to Fig. (8). However, the attenuation of this signal that was promoted by injecting CO2 in the wind tunnel was perceived again. -400 -300 -200 -100 0 100 200 300 400 0 20 40 60 80 100 0 250 500 750 1000 1250 Flowrate(Nm³/h) CO2(%) Readings % CO2 Flow rate 0 100 200 300 400 500 600 700 0 20 40 60 80 100 0 250 500 750 1000 1250 Speedofsound(m/s) CO2(%) Readings % CO2 SOS
- 8. Proceedings of ENCIT 2016 16th Brazilian Congress of Thermal Sciences and Engineering Copyright © 2012 by ABCM November 07-10th , 2016, Vitória, ES, Brazil Figure 8. Errors identified by ultrasonic signal strength readings obtained in the approached analysis of transducers. Although the occurrence of failures has not been avoided, it is important to investigate whether this configuration made the meter less sensitive to the attenuation promoted by CO2. Table 6 indicates failure rates applied on flow estimation. Table 6. Accounted errors after the application of filtering criteria on flow readings. Criterion (A) Criterion (A+B) Criterion (A+B+C) N°. of failures during test 165 195 280 Failure rate (%) 14.7 17.3 24.9 Adjusted accumulated volume (Nm³) 8.2 8.0 5.8 Δ Accumulated Vol. (%) - -3.1 -30.2 In this case, criteria application purges about 25% of 1126 recorded flow readings, and this rate is way below to those estimated in aligned configuration. The samples that were not subjected to any criteria exhibited a reduction of the accumulated volume of gas, suggesting that approximating the transducers can reduce uncertainties related to the flare gas measurement and intensified by the presence of CO2. In order to support this premise, it is necessary to compare the failure rates defined in internal aligned and approximated transducers configuration. Table 7 allows concluding this investigation, evaluating the events related to stable gas levels and larger amounts of samples. Table 7. Failure rate by CO2 levels, obtained after the application of each criteria on each recorded sample. CO2 (%) Samples (%) Failure rate (%) Criterion (A) Criterion (A+B) Criterion (A+B+C) 05 – 20 9.3 0.0 19.0 19.0 20 – 40 10.3 34.5 34.5 34.5 40 – 60 18.7 20.4 20.4 20.4 60 – 80 26.6 6.7 6.7 7.3 80 – 100 35.0 15.7 18.3 39.3 It is noticed, by Tab. 7, that 61.6% of recorded flow readings occurred in mixtures with above 60% of CO2 content. The percentage of failures related to these gas levels was significantly reduced after approaching the transducers. Therefore, increasing the power of received ultrasonic signal, which should be promoted by reduction of acoustic path, made the meter less susceptible to errors during operation. Another aspect that also stands out refered to low occurrence of errors in gas concentration between 60 and 80%, since there were less abrupt variations of gas at this level. The performance characterization of the meter is complemented with the analysis of the dispersion of the obtained flow estimates. Again, selected readings were generated at intervals of relatively stable chemical composition, as seen in Fig. 9. 60 70 80 90 100 110 0 20 40 60 80 100 0 250 500 750 1000 1250 SignalStrength CO2(%) Readings % CO2 SS Downstream SS Upstream
- 9. Proceedings of ENCIT 2016 16th Brazilian Congress of Thermal Sciences and Engineering Copyright © 2012 by ABCM November 07-10th , 2016, Vitória, ES, Brazil Figure 9. Summary of the recorded flow readings in stable CO2 levels. The samples variability was based on 4 levels of flow chemical composition, which was statistically evaluated in Tab. 8. Table 8. Variability of the flow readings at Re ≈ 104 . CO2 (%) Q (Nm³/h) σ (Nm³/h) Δ (%) 0.21 3.92 0.82 20.93 39 12.87 1.36 10.54 72 26.55 7.85 29.57 83 41.58 17.61 42.37 It can be seen at highest level of CO2 more unstable results than in inner aligned configuration of sensors (Tab. 4). Similar behavior was observed for initial atmospheric conditions, confirming that insertion of ultrasonic transducer produces an additional increase in readings dispersion, regardless CO2 concentration. 5. CONCLUSIONS The effect of flow readings in transit time ultrasonic meters, when exposed to atmospheres at high CO2 content, was experimentally proven. The reduction in signal strength promoted by injecting gas into the flow induced an increasing of the variability of the flow rate readings, as well as a higher occurrence of errors, thus producing a cumulative unrepresentative volume of gas. It was also observed that these failures occurred in CO2 levels above 5% and more frequent in stages with greater variation of this gas. Nevertheless, no measurement interruptions were recorded. The proposed transducers approximation effectively reduces the occurrence of readings failures, associated to the CO2 presence, showing an interesting alternative for gas flare applications, especially at low flow conditions. However, a reduced acoustic path increased the variability of flow meter readings, and generating underestimated flow results. It is suggested that efforts should be made to reduce the mechanical vibrations, induced by the flow drag in the inserted transducers, allowing the use of an estimated correction of flow, making this proposal even more interesting. 6. ACKNOWLEDGEMENTS The authors would like to express their acknowledgements to the sponsors institutions: CAPES and Petrobras. 7. REFERERENCES Barros, W.F., 2016. “Análise da Variabilidade Induzida pela Concentração de Co2 nas Leituras de Medidores de Vazão Ultrassônicos para Gás de Queima”. M.S. thesis, Universidade Federal do Espírito Santo, Vitória, Brazil. Ejakov, S.G., Phillips, S., Dain, Y., Lueptow, R.M. and Visser, J. H., 2002. “Acoustic Attenuation in Gas Mixtures With Nitrogen: Experimental Data and Calculations”. Journal of the Acoustical Society of America, V. 113. Michigan. pp. 1871-1879. Helden, K., Ehrlich, A., Dietz, T. and Tan, P., 2009. “Examination of Ultrasonic Flow Meter in Co2-rich Applications”. Proceedings of the 8th South East Asia Hydrocarbon Flow Measurement Workshop. 14p. 0 20 40 60 80 100 0 100 200 300 400 500 0 50 100 150 200 250 CO2(%) Flowrate(Nm³/h) Readings Flow rate Pitot Flow rate UFM % CO2
- 10. Proceedings of ENCIT 2016 16th Brazilian Congress of Thermal Sciences and Engineering Copyright © 2012 by ABCM November 07-10th , 2016, Vitória, ES, Brazil Markham, J.J., Beyer, R.T. and Lindsay, R.B., 1951. “Absorption of Sound in Fluids”. Reviews of Modern Physics, V. 23. Maryland. pp. 353-411. Matson, J., Sui, L. and Nguyen, T.H., 2010. “New and Old Challenges of High Velocity and High Co2 Concentration for Flare Gas Flow Measurement are Met With Improved Ultrasonic Flow Meter Capability”. Proceedings of The Americas Workshop. 14p. Portaria Conjunta ANP/INMETRO no. 1, 2000. “Dispõe sobre Medição de Petróleo e Gás Natural”. Diário Oficial da União da República Federativa do Brasil, Brasília. Report AGA no. 9, 1998. “Measurement of Gas by Multipath Ultrasonic Meters”. Ed. American Gas Association, Washington, DC. Report AGA no. 9, 2007. “Measurement of Gas by Multipath Ultrasonic Meters”. Ed. American Gas Association, 2nd edition, Washington, DC. 113p. Report AGA no. 10, 2003. “Speed of Sound in Natural Gas and Other Related Hydrocarbon Gases”. Ed. American Gas Association, Washington, DC. Resolução Conjunta ANP/INMETRO no. 1, 2013. “Dispõe sobre Medição de Petróleo e Gás Natural”. Diário Oficial da União da República Federativa do Brasil, Brasília. Salgado, A.L., Ramos, R., 2009. “Perfect Gas Approach Validation Aiming Estimation of Thermophysical Properties in Flare Flows Considering Operational Data”. Proceedings of the 20th. International Congress of Mechanical Engineering, Brazil. 8p. Vermeulen, M., Drenthen, J., Hollander, H. and Lanoux, P., 2013. “Practical Solution for Ultrasonic Flow Measurement in High Co2 Natural Gas Applications”. Proceedings of the AGA Operations Conference. 16p. 8. RESPONSIBILITY NOTICE The authors are the only responsible for the printed material included in this paper.