SlideShare ist ein Scribd-Unternehmen logo
1 von 15
Downloaden Sie, um offline zu lesen
72
Transportation Research Record: Journal of the Transportation Research Board,
No. 2582, Transportation Research Board, Washington, D.C., 2016, pp. 72–86.
DOI: 10.3141/2582-09
The Traffic Safety Best Practices Matrix is presented. It is a tool to help
U.S. cities to identify the landscape of strategies being used domestically
and internationally to advance Vision Zero, as pioneered by Sweden.
Many cities across the United States have expressed an interest in Vision
Zero, with a growing number passing policies calling for the elimination
of traffic-related fatalities over the next decade. Despite the increase
in interest, little guidance exists around what Vision Zero is and what
actions can be implemented to help realize zero deaths. The matrix
culls together the results of an extensive examination of the measures
that cities and countries are pursuing to reduce traffic-related fatalities
and improve safety. The matrix attempts to bridge the gap by presenting
a framework that cities can use to identify effective strategies, bench-
mark their efforts relative to other jurisdictions, and reach out to cities
and countries pursing Vision Zero policies for additional information.
An analysis of the matrix, focuses on three categories: measures with
widespread adoption, limited implementation, and minimal utilization.
There is discussion of how these findings can inform the next steps for
Vision Zero implementation, with a focus on implications for U.S. cities.
The main recommendations are to develop mechanisms that institution-
alize Vision Zero across sectors, focus education on supporting changes
in organizational practices and policy reform, improve collaboration
across all levels of government, explore technology that meets the unique
needs of cities, and create data systems that facilitate accountability and
encourage public participation.
Vision Zero is a road safety policy that aims to achieve a transpor-
tation system in which there are zero fatalities or serious injuries
for all modes of transportation. Adopted by Sweden in 1997, the
safety platform attempts to create a safe system by taking an ethi-
cal approach to road safety (1). Vision Zero is widely accepted as
an innovative road safety policy and is noted for its departure from
the traditional road safety paradigm with regard to its charge that
the road safety problem to be addressed is the shortcomings in the
design of the transportation system, assertion that transportation
system designers are responsible for road safety, call for road users
to demand safety, and insistence that the ultimate objective of road
safety is zero deaths (2).
Many cities across the United States have expressed an interest
in Vision Zero. As of July 2015, the following cities have passed
a Vision Zero policy, calling for the elimination of traffic-related
fatalities and in some cases serious injuries over the next 10 years:
San Francisco, San Jose, San Mateo, and San Diego, California;
Seattle,Washington; Portland, Oregon; NewYork City;Washington,
D.C.; and Boston, Massachusetts. Despite the increase in interest,
little guidance exists for local transportation planners, policy makers,
public health practitioners, police, and others working as part of this
effort around what Vision Zero is and what actions could be imple-
mented to help realize zero deaths. This paper aims to bridge that
gap by presenting a tool, the Traffic Safety Best Practices Matrix, to
help cities identify the landscape of strategies being used domesti-
cally and internationally to advance Vision Zero. The matrix culls
together the results of an extensive examination of the measures that
cities and countries are pursuing to reduce traffic-related fatalities
and serious injuries.
Byidentifyingthelandscapeofstrategiesbeingusedbycitiespursu-
ing Vision Zero, and specifying strategy efficacy as currently known,
the matrix presents a framework for strategy identification and evalu-
ation, as well as opportunity benchmarking. Analysis of the matrix
focuses on three categories: measures with (a) widespread adoption,
(b) limited implementation, and (c) minimal utilization. Also, the
research offers findings that can inform next steps for Vision Zero
implementation. While the potential for Vision Zero to reduce fatali-
ties and serious injuries is significant based on Sweden’s experience
(3), there is currently a knowledge gap with respect to specific imple-
mentation measures utilized to advance the policy. It is anticipated that
the matrix, in addition to the analysis presented in this paper, will help
cities, especially those considering adopting the policy, to develop
comprehensive strategies, benchmark their efforts, and reach out to
other jurisdictions pursing Vision Zero for additional information.
CALL FOR SAFE SYSTEM APPROACH
TO SAFETY: WHAT IS VISION ZERO?
Vision Zero is based on two premises: people make mistakes, and
there is a critical limit beyond which survival and recovery from
an injury are not possible (4). Vision Zero does not assume that
collisions will not happen—people make mistakes no matter how
well-educated and compliant in obeying traffic laws (5). Rather, the
focus for road safety analysis and planning is on eliminating the risk
of chronic health impairment or death caused by a collision (4). To
do so, Vision Zero focuses on decreasing the likelihood that crashes
will result in serious injury or death by designing the transportation
system in a way that ensures that road users can tolerate the kinetic
energies produced by the collision. It is kinetic energy that kills and
injures the road user—not the collision. The level of physical force
the human body can tolerate thus forms the basic parameter in the
A Vision for Transportation Safety
Framework for Identifying Best Practice
Strategies to Advance Vision Zero
Arielle Fleisher, Megan L. Wier, and Mari Hunter
A. Fleisher and M. Hunter, San Francisco Municipal Transportation Agency,
1 South Van Ness Avenue, San Francisco, CA 94103. M.L. Wier, San Francisco
Department of Public Health, 1390 Market Street, Suite 210, San Francisco,
CA 94102. Corresponding author: A. Fleisher, arielle.fleisher@sfmta.com.
Fleisher, Wier, and Hunter 73
design of the transportation system, the core around which all safety
interventions are to be based (4, 6).
One of the main implications of this is that traffic speeds should
be reduced to prevent injuries (7). If the impact of crash energy
is to be kept below the critical limit, speeds must lowered and set
according to the safety of the road and roadside (4). Vulnerable road
users, including pedestrians, have a 10% chance of surviving if hit
by vehicles traveling at speeds above 45 mph, but this level rises to
90% at speeds of 17 mph (8). Speed management underpins nearly
every consideration in Vision Zero (5).
While Vision Zero places a strong emphasis on reducing speeds, it
does so in the context of the road system in its entirety—referred to
as a safe system approach to road safety (4, 5). The approach encour-
ages countermeasures that address the three key elements of the road
system—roads and roadsides, vehicles and speed—because the
interaction of these elements determines physical force and thus
trauma levels in a crash (4). Considering the inputs in isolation
ignores the power of their interactions. To prevent collisions, the
whole system must be considered and all its parts strengthened (5):
If one part fails, the other parts must be able to offer protection.
Core activities are supported by a range of countermeasures (such
as education, regulation, and enforcement) that encourage alert and
compliant behavior on the part of road users (9).
Vision Zero alters the view on responsibility for road safety. In
the United States, responsibility has been placed on the individual
road user: bad drivers, careless bicyclists, and distracted pedestrians
are the causes of collisions; perfecting human behaviors through
licensing, testing, education, training, and publicity are the appro-
priate solutions (6, 7). Under the Vision Zero framework, actions
and responsibilities are attributed to the system designers who include
engineers, public health professionals, policy makers, and law
enforcement (4, 10). It remains the responsibility of individuals to
abide by laws and regulations, that is, to follow the rules for using
the transportation system set by the system designers. If fatalities do
still occur, or if the rules are not followed, the burden is placed back
on the system designers to take further measures (1).
Although Vision Zero is closely associated with Sweden’s efforts,
the safe system approach on which it is based has also provided the
foundation for Netherland’s Sustainable Safety policy, as well as
the safety platforms of Australia, New Zealand, Denmark, Iceland,
Norway, and London (5). Vision Zero and Sustainable Safety repre-
sent the longest and most well-established safe system approaches
(9). In the United States, state governments are required to develop
strategic highway safety plans that detail the state’s approach to
reducing traffic injuries. Since the early 2000s, many states have
framed this work as Toward Zero Deaths (TZD), an approach that
traces its roots Vision Zero (11). In 2014, FHWA published Toward
Zero Deaths: A National Strategy for Highway Safety, which similarly
frames safety as a systems approach (12).
METHODS
To provide guidance for U.S. cities as they seek to implement Vision
Zero, research was conducted into the measures that cities in the
United States and cities and countries abroad, are, as of May 2015,
pursuing to reduce pedestrian-, bicycle-, or traffic-related injuries
and fatalities. Those data are compiled into the Traffic Safety Best
Practices Matrix.
The safety strategies of eight U.S. cities, one European city, and
three countries were reviewed for the matrix: San Francisco; New
York City; Chicago, Illinois; Portland; Seattle; Washington, D.C.;
Boston; Los Angeles, California; London; Sweden; the Netherlands;
and Australia. The U.S. cities included in the matrix were the early
adopters or early considerers of Vision Zero, either by cities or
departments of transportation. Sweden and the Netherlands are
international leaders in road safety.Australia was selected because it
was one of the first countries to follow Sweden in adopting the safe
system approach; London was selected because it is a large city that
also subscribes to a systems approach to road safety (9, 13). These
locations were also selected because information about their safety
platforms is widely available online and in English. While Norway,
Finland, Iceland, and Denmark have all adopted Vision Zero or
Vision Zero–like policies, these countries were not included in the
review because their safety documents were not readily available (5).
The matrix is divided into nine categories:
1. Supportive infrastructure and planning;
2. Engineering;
3. Education;
4. Enforcement;
5. Monitoring, analysis, and evaluation;
6. Policy;
7. Large vehicles;
8. Vehicle technology; and
9. Taxi services and transportation network company.
Countries and cities received a √ (i.e., checkmark) for a measure
if it was referred to in one of their safety documents, defined as
their city’s safety resource webpage, safety action plan, or bicycle
or pedestrian strategy, as either in practice or as a priority/planned/
in process. Cities and countries received an NA (not applicable)
for measures if implementation was not feasible. For example,
New York City received an NA for “Align state level Towards Zero
Death efforts with local level Vision Zero policy” (6.9) because its
state did not adopt the TZD approach. A total of 106 measures are
included in the matrix. There is no hierarchy to the matrix; rather,
measures are listed alphabetically within subsections. The matrix is
not exhaustive but attempts to provide a full scope of the safety mea-
sures being used by cities and countries. Matrix review did not take
into account prioritization of the measures, scale of implementation
(e.g., one intersection versus routine strategic implementation) or
funding.
The matrix also includes a category that indicates the efficacy
of a measure, defined as capacity to reduce injury, both directly (i.e.,
collision reduction factor) or indirectly (i.e., through creation of the
institutions, structures, and political will that drive or create frame-
works for changes in system design). Measures were given a designa-
tion of proven (P), recommended (R), or unknown (U), as described
in Table 1. This methodology was used by Washington State in its
2013 Washington State Strategic Highway Safety Plan (14), which
is a target zero plan. This plan was chosen as the model of the cur-
rent research not only because of the rigor it applied to the efficacy
assessments, but also because consistency in efficacy methodol-
ogy among plans related to Vision Zero was felt to be a potential
strength. As in Washington State, the researchers relied on three
main sources to make the designations; if an action was not found in
one of these primary sources, the researchers surveyed the academic
literature as well as other countermeasure reference documents. For
supplemental sources, designations were given based on the out-
comes, quality, and breadth of the evaluation. A list of these sources
can be found in Table 2.
74 Transportation Research Record 2582
TABLE 1 Efficacy Definitions and Criteria (14, p. 168)
Strategy
Effectiveness Definition
Countermeasures That Work
(CTW) NCHRP Report 500
Crash Modification
Factors (CMF)
Clearinghouse
Proven (P) Proven to be effective
based on several evalu-
ations with consistent
results
***** Demonstrated to be
effective by several high-
quality evaluations with
consistent results
Proven (P). Those strategies that
have been used in one or more
locations and for which properly
designed evaluations have been
conducted that show them to be
effective.
***** = 14 quality
points
Recommended (R) Generally accepted to
be effective based on
evaluations or other
sources
**** Demonstrated to be
effective in certain situations
or
*** Likely to be effective based
on balance of evidence from
high-quality evaluations or
other sources
Tried (T). Those strategies that
have been implemented in many
locations, and may even be
accepted as standards or standard
approaches, but for which there
have not been found valid
evaluations.
**** = 11–13 quality
points
*** = 7–10 quality
points
Unknown (U) Lower quality rating;
limited evaluation or
evidence; experimental;
outcomes inconsis-
tent and inconclusive
between studies
** Effectiveness still undeter-
mined; different methods of
implementing this counter-
measure produce different
results
or
*Limited or no high-quality
evaluation evidence
Experimental (E). Those strate-
gies represent ideas that have
been suggested, with at least
one agency considering them
sufficiently promising to try them
as an experiment in at least one
location.
** = 3–6 quality
points
TABLE 2 Matrix Sources
Document Link
San Francisco
San Francisco Pedestrian Strategy http://archives.sfmta.com/cms/rpedmast/documents/1-29-13PedestrianStrategy.pdf
SFMTA Bicycle Strategy https://www.sfmta.com/sites/default/files/BicycleStrategyFinal_0.pdf
Vision Zero San Francisco: two-year action strategy http://visionzerosf.org/about/two-year-action-strategy/
Walk First http://walkfirst.sfplanning.org/
New York
Vision Zero Action Plan http://www.nyc.gov/html/visionzero/pdf/nyc-vision-zero-action-plan.pdf
NYC Pedestrian Safety Study and Action Plan http://www.nyc.gov/html/dot/downloads/pdf/nyc_ped_safety_study_action_plan.pdf
Truck Side Guards http://www.nyc.gov/html/dcas/downloads/pdf/fleet/nyc_fleet_newsletter_05_16_2014
.pdf; http://www.volpe.dot.gov/news/engineers-passion-pedestrian-and-bike-safety
-leads-partnership-with-nyc
Chicago
Chicago Forward: Department of Transportation Action
Agenda
http://www.cityofchicago.org/dam/city/depts/cdot/Admin/ChicagoForwardCDOT
ActionAgenda.pdf
Chicago Forward: Department of Transportation Action
Agenda 2013 Update
http://www.cityofchicago.org/content/dam/city/depts/cdot/ChicagoForward
/ChicagoForwardUpdate2013_web-lo.pdf
Chicago Pedestrian Plan http://chicagopedestrianplan.org/pedestrian-plan/
Chicago Streets for Cycling Plan 2020 http://www.cityofchicago.org/content/dam/city/depts/cdot/bike/general
/ChicagoStreetsforCycling2020.pdf
Portland
Portland Bicycle Plan for 2030 http://www.portlandoregon.gov/transportation/article/289122
Portland Bicycle Plan for 2030: One-Year Progress Report http://www.portlandoregon.gov/transportation/article/345419
Real Solutions to Traffic Safety Problems https://www.portlandoregon.gov/transportation/article/299189
Traffic Safety Resources https://www.portlandoregon.gov/transportation/55303
Vision Zero https://www.portlandoregon.gov/transportation/article/518952
Seattle
2012 Action Agenda: Laying the Groundwork http://www.seattle.gov/transportation/docs/SDOTActionAgenda2812.pdf
Action Agenda: 2013 Progress Report http://www.seattle.gov/transportation/docs/SDOTActionAgendatProgRep_2013-01.pdf
Pedestrian Master Plan: Implementation Overview http://www.seattle.gov/transportation/pedestrian_masterplan/pmp_implementation.htm
Vision Zero: Seattle’s Plan to End Traffic Deaths and
Serious Injuries by 2030
http://www.seattle.gov/visionzero
(continued)
Fleisher, Wier, and Hunter 75
TABLE 2 (continued) Matrix Sources
Document Link
Washington, D.C.
District DOT: Safety Programs Overview http://ddot.dc.gov/page/safety-programs
District of Columbia Bicycle Master Plan http://ddot.dc.gov/sites/default/files/dc/sites/ddot/publication/attachments
/bicycle_master_plan_2005_final_document_0.pdf
District of Columbia Pedestrian Master Plan http://ddot.dc.gov/sites/default/files/dc/sites/ddot/publication/attachments
/pedestrianmasterplan_2009.pdf
District of Columbia Strategic Highway Safety Plan http://www.ddot-hso.com/ddot/hso/documents/Publications/SHSP/2014/DDOT%20
SHSP%20-%20October%202014.pdf
Toward Zero Deaths website http://www.towardzerodeathsdc.com/
Boston
Access Boston 2000–2010: Boston’s Citywide Transportation
Plan
http://www.cityofboston.gov/transportation/accessboston/default.asp
Boston Bicycle Plan http://www.cityofboston.gov/transportation/accessboston/pdfs/bicycle_plan.pdf
Boston Bike Network Plan http://www.cityofboston.gov/images_documents/Boston%20Bike%20Network%20
Plan%2C%20Fall%202013_FINAL_tcm3-40525.pdf
Boston Bikes http://www.cityofboston.gov/bikes/
Boston Cyclist Safety Report http://www.cityofboston.gov/images_documents/Crash%20Report%202013%20
FINAL%20reduced%202_tcm3-38304.pdf
City of Boston–Transportation http://www.cityofboston.gov/transportation/
Pedestrian Safety Guidelines For Residential Streets http://www.cityofboston.gov/transportation/accessboston/pdfs/pedestrian_safety
_guidelines.pdf
Update on Safety Efforts in Boston http://www.bostonglobe.com/metro/2013/03/18/boston-launches-traffic-safety-initiative
-along-busy-commonwealth-ave/rpIzq1bJTz8LuxvALlu0UJ/story.html
Los Angeles
2010 Bicycle Plan http://planning.lacity.org/cwd/gnlpln/transelt/NewBikePlan/Txt/LA%20CITY%20
BICYCLE%20PLAN.pdf
Greater Streets for Los Angeles Strategic Plan http://www.smartgrowthamerica.org/documents/cs/impl/ca-losangeles-dot-strategicplan
2014.pdf
LA DOT Bicycle Services http://bicyclela.org/
LA DOT Safety http://www.ladot.lacity.org/WhatWeDo/Safety/index.htm
Traffic Study Policies and Procedures http://ladot.lacity.org/stellent/groups/departments/@ladot_contributor/documents
/contributor_web_content/lacityp_026875.pdf
Watch the Road http://www.watchtheroad.org/
Sweden
Achieving Traffic Safety Goals in the United States: Lessons
from Other Nations
http://onlinepubs.trb.org/onlinepubs/sr/sr300.pdf
An Independent Review of Road Safety in Sweden http://publikationswebbutik.vv.se/upload/4314/2008_109_an_independent_review_of
_road_safety_in_sweden.pdf
International Transport Forum: Road Safety Annual
Report 2014
http://www.internationaltransportforum.org/pub/pdf/14IrtadReport.pdf
Management by Objectives for Road Safety Work Stakeholder
Collaboration Towards New Interim Targets 2020
http://publikationswebbutik.vv.se/upload/4253/89217_management_by_objectives_for
_road_safety_work_stakeholder_collaboration_towards_new_interim_targets_2020
_summary.pdf
Urban Mobility Strategy http://international.stockholm.se/globalassets/ovriga-bilder-och-filer/urban-mobility
-strategy.pdf
The Netherlands
Advancing Sustainable Safety: National Road Safety
Outlook for 2005–2020
http://www.swov.nl/rapport/dmdv/Advancing_sustainable_safety.pdf
Cycling in the Netherlands http://www.fietsberaad.nl/library/repository/bestanden/CyclingintheNetherlands
2009.pdf
International Transport Forum: Road Safety Annual
Report 2014
http://www.internationaltransportforum.org/pub/pdf/14IrtadReport.pdf
Road Safety Strategic Plan: 2008–2020 http://www.fietsberaad.nl/library/repository/bestanden/5a_Philippens_ICSC2012.pdf
Signalized Intersection Safety in Europe http://international.fhwa.dot.gov/pubs/pl03020/pl03020.pdf
Sustainable Safety http://www.fietsberaad.nl/index.cfm?lang=en&section=kennisbank&mode=list&kennis
bankPage=Categorisering+en+fietsen+in+verblijfsgebieden
(continued on next page)
76 Transportation Research Record 2582
London
Intelligent Pedestrian Technology http://www.tfl.gov.uk/info-for/media/press-releases/2014/march/tfl-to-launch-worldleading
-trials-of-intelligent-pedestrian-technology-to-make-crossing-the-road-easier-and-safer
The Mayor’s Vision for Cycling in London http://www.tfl.gov.uk/cdn/static/cms/documents/gla-mayors-cycle-vision-2013.pdf
Lorry Drivers Have No More Excuses When It Comes to
Cycling Blind Spots
http://www.theguardian.com/environment/green-living-blog/2010/aug/02/hgv-lorries
-cycling-campaign
Pedestrian Safety Action Plan http://www.tfl.gov.uk/cdn/static/cms/documents/pedestrian-safety-action-plan.pdf
Plans for New Out-of-Hours Delivery Trials http://www.tfl.gov.uk/info-for/media/news-articles/plans-for-new-outofhours-delivery
-trials
Puffin Crossing Study http://www.trl.co.uk/reports-publications/trl-reports/traffic-management
/report/?reportid=6680
Safe Streets for London: The Road Safety Action Plan for
London 2020
https://www.tfl.gov.uk/cdn/static/cms/documents/safe-streets-for-london.pdf
Safer Lorries Scheme http://www.tfl.gov.uk/info-for/media/press-releases/2014/july/safer-lorries-scheme
-consultation
Trial of Roadside Safety Mirrors for Cycle Visibility https://www.tfl.gov.uk/cdn/static/cms/documents/trial-of-roadside-safety-mirrors-for
-cycle-visibility-report.pdf
Supplemental Efficacy Sources
Section 1. Supportive infrastructure and Planning
1.1 Safety Action Plan (Vision Zero) and Strategy
Health in All Policies: A Guide for State and Local
Governments
Rudolph et al. (22)
Health in All Policies: Taking Stock of Emerging
Practices to Incorporate Health in Decision Making in
the United States
Gase, L.N., R. Pennotti, and K.D. Smith. Health in All Policies: Taking Stock of Emerging
Practices to Incorporate Health in Decision Making in the United States. Journal of
Public Health Management and Practice, Vol. 19, No. 6, 2013, pp. 529–540.
1.2 Vision Zero Policy (or Vision Zero–like policy)
Towards Zero: Ambitious Road Safety Targets and the
Safe System Approach
Organisation for Economic Co-operation and Development/International Transportation
Forum. Towards Zero: Ambitious Road Safety Targets and the Safe System Approach.
OECD Publishing, Paris, 2008.
The Vision Thing: Actors, Decision-Making, and Lock-In
Effects in Swedish Road Safety Policy Since the
1990s
Andersson, F., and T. Pettersson. The Vision Thing: Actors, Decision Making, and
Lock-In Effects in Swedish Road Safety Policy Since the 1990s. Umeå, Sweden,
Umeå Universitetet, 2008.
1.3 Vision Zero Steering Committee
Governance Tools and Framework for Heath in All
Policies
St-Pierre, L. Governance Tools and Framework for Heath in All Policies. National
Collaborating Centre for Healthy Public Policy. http://www.ci.richmond.ca.us
/DocumentCenter/Home/View/9047.
Section 2. Engineering
2.1a Informative signage: advisory or cautionary signs
(e.g., “State law: stop for pedestrians”; “high bicycle
activity zone”)
Evaluation of Pedestrian-Related Roadway Measures:
A Summary of Available Research
Mead, J., C. Zegeer, and M. Bushell. Evaluation of Pedestrian-Related Roadway
Measures: A Summary of Available Research. Pedestrian and Bicycle Information
Center, Chapel Hill, N.C., April 2013.
2.1b Informative signage: dynamic message signs with
safety messaging
Effectiveness of Safety and Public Service Announcement
Messages on Dynamic Message Signs
Federal Highway Administration. Effectiveness of Safety and Public Service Announce-
ment Messages on Dynamic Message Signs. Publication FHWA-HOP-14-015. FHWA,
U.S. Department of Transportation, 2014.
2.2 Perform engineering reviews at all traffic fatality and
high collision locations and at scenes of crashes
Highway Safety Improvement Program Manual Federal Highway Administration. Highway Safety Improvement Program Manual.
Publication FHWA-SA-09-029. FHWA, U.S. Department of Transportation, 2010.
Road Safety as a Shared Responsibility and a Public
Problem in Swedish Road Safety Policy
McAndrews (7).
Presentation at Workshop on Independent and Transparent
Accident Investigation Recommendations
Bergfalk, L. Presentation at Workshop on Independent and Transparent Accident
Investigation Recommendations, Brussels, 2007. http://erso.swov.nl/safetynet/fixed
/WP4/Workshop_3_2007/sn_wp4_Brussels_WSguest4_SwedishTrafficInspectorate
_LB.pdf.
2.3b Restrictions on street access: restrict car access in the
city center
Green Light for Midtown Evaluation Report http://www.nyc.gov/html/dot/downloads/pdf/broadway_report_final2010_web.pdf
Vehicle Restrictions: Limiting Automobile Travel at
Certain Times and Places
http://www.vtpi.org/tdm/tdm33.htm.
TABLE 2 (continued) Matrix Sources
Document Link
(continued)
Fleisher, Wier, and Hunter 77
2.4 Shared-space area for cars, bicyclists, and pedestrians
Lesson 20: Traffic Calming U.S. Department of Transportation. Lesson 20: Traffic Calming. July 2006. http://www
.fhwa.dot.gov/publications/research/safety/pedbike/05085/pdf/lesson20lo.pdf.
2.5b Signal hardware additions: pedestrian countdown signal
2.8h Road design and maintenance: restrict parking near
intersections (aka “daylighting”)
Toolbox of Countermeasures and Their Potential
Effectiveness for Pedestrian Crashes
Federal Highway Administration (17).
2.7b Slow zone: senior slow/safety zones
2.7c Slow zones around schools/local streets
Safe Streets for Seniors http://www.nyc.gov/html/dot/html/pedestrians/safeseniors.shtml.
Neighborhood Slow Zones http://www.nyc.gov/html/dot/html/motorist/slowzones.shtml.
Slow Zones: Their Impact on Mode Choices and Travel
Behaviour
O’Fallon, C., and C. Sullivan. Slow Zones: Their Impact on Mode Choices and Travel
Behaviour. Research Report 438, NZ Transport Agency, 2011.
2.8a Road design and maintenance: Advance stop or
yield lines
2.8c Road design and maintenance: high visibility crosswalk
Achieving Vision Zero: A Data-Driven Investment
Strategy for Eliminating Pedestrian Fatalities on a
Citywide Level
Kronenberg, C., L. Woodard, B. DuBose, and D. Weissman. Achieving Vision Zero: Data-
Driven Investment Strategy to Eliminate Pedestrian Fatalities on a Citywide Level. In
Transportation Research Record: Journal of the Transportation Research Board,
No. 2519, Transportation Research Board, Washington D.C., 2015, pp. 146–156.
2.8b Road design and maintenance: enhanced sharrow
marking
Evaluation of Bicycle-Related Roadway Measures:
A Summary of Available Research
Mead, J., A. McGrane, C. Zegeer, and L. Thomas. Evaluation of Bicycle-Related Road-
way Measures: A Summary of Available Research. Pedestrian and Bicycle Information
Center, Chapel Hill, N.C., February 2014.
Section 3. Education
3.2 Educate state level organizations on city actions and
Vision Zero commitments to broaden understanding of
Vision Zero’s impact on pedestrian/bike/traffic fatalities
and injuries
Road Safety as a Shared Responsibility and a Public
Problem in Swedish Road Safety Policy
McAndrews (7).
Health In All Policies: A Guide for State and Local
Governments
Rudolph et al. (22).
3.3 Engage with community-based organizations and
advocates
Health in All Policies: A Guide For State and Local
Governments
Rudolph et al. (22).
3.10 Training for senior citizens on walking and biking
Safe Routes for Seniors: Improving Walkability for
Seniors in New York City
Shin-pei, T. Safe Routes for Seniors: Improving Walkability for Seniors in New York City.
http://activelivingresearch.org/safe-routes-seniors-improving-walkability-seniors-new
-york-city.
Evaluation of the Walkable Neighborhoods for Seniors
Project in Sacramento County
Hooker, S.P., L.A. Cirill, and A. Geraghty. Evaluation of the Walkable Neighborhoods
for Seniors Project in Sacramento County. Health Promotion Practice, Vol. 10, No. 3,
2011, pp. 402–410.
Section 4. Enforcement
4.1e Automated enforcement: point to point camera
Effects of Average Speed Enforcement on Speed
Compliance and Crashes: A Review of the Literature
Soole, D.W., B.C. Watson, and J.J. Fleiter. Effects of Average Speed Enforcement on
Speed Compliance and Crashes: A Review of the Literature. Accident Analysis and
Prevention, Vol. 51, 2013, pp. 46–56.
Austroads Research Report: Point to Point
Speed Enforcement
Soole, D.W., J. Fleiter, and B. Watson. Austroads Research Report: Point to Point Speed
Enforcement. Publication AP-R415-12. Centre of Accident Research and Road Safety,
Sydney, New South Wales, Australia, 2012.
4.2 Convene regular meetings of transportation leaders and
the police department to review traffic safety performance
and determine strategies for improvement
Road Safety in the Context of Urban Development in
Sweden and California
McAndrews, C. Road Safety in the Context of Urban Development in Sweden and
California. University of California, Berkeley, City and Regional Planning, 2010.
Country Guidelines for the Conduct of Road Safety
Management Capacity Reviews and the Specification
of Lead Agency Reforms
Bliss, T., and J. Breen. Country Guidelines for the Conduct of Road Safety Management
Capacity Reviews and the Specification of Lead Agency Reforms. World Bank Global
Road Safety Facility, Washington, D.C., 2009.
4.6 Investigate crashes that result in fatalities as well as
crashes that result in critical injuries
Independent Review of Road Safety in Sweden Breen, J., E. Howard, and T. Bliss. Independent Review of Road Safety in Sweden, 2008.
Presentation at Workshop on Independent and Transparent
Accident Investigation Recommendations
Bergfalk, L. Presentation at Workshop on Independent and Transparent Accident Investi-
gation Recommendations, Brussels, 2007. http://erso.swov.nl/safetynet/fixed/WP4
/Workshop_3_2007/sn_wp4_Brussels_WSguest4_SwedishTrafficInspectorate_LB.pdf.
TABLE 2 (continued) Matrix Sources
Document Link
(continued on next page)
78 Transportation Research Record 2582
4.7 Random breath testing
A National Examination of Random Breath Testing and
Alcohol-Related Traffic Crash Rates
Ferris, J., L. Mazerolle, M. King, L. Bates, S. Bennett, and M. Devaney. Random Breath
Testing in Queensland and Western Australia: Examination of How the Random Breath
Testing Rate Influences Alcohol Related Traffic Crash Rates. Accident Analysis and
Prevention, Vol. 60, 2013, pp. 181–188.
Random Breath Testing: A Canadian Perspective Solomon, R., E. Chamberlain, M. Abdoullaeva, and B. Tinholt. Random Breath Testing:
A Canadian Perspective. Traffic Injury Prevention, Vol. 12, No. 2, 2011, pp. 111–119.
4.8 Update technology that assists with capturing crash
data and/or speed detection
Data Systems: A Road Safety Manual for Decision-
Makers and Practitioners
World Health Organization. Data Systems: A Road Safety Manual for Decision-Makers
and Practitioners, 2010. http://apps.who.int/iris/bitstream/10665/44256/1
/9789241598965_eng.pdf.
Section 5. Monitoring, analysis, and evaluation
5.1 Comparative data system linking social and
environment factors with injury data
5.6 Publish citywide collision report
Data Systems: A Road Safety Manual for Decision-
Makers and Practitioners
World Health Organization. Data Systems: A Road Safety Manual for Decision-Makers and
Practitioners, 2010. http://apps.who.int/iris/bitstream/10665/44256/1/9789241598965
_eng.pdf.
5.2 Continual, proactive monitoring and feedback gathering
from the community on their safety issues and concerns
Pedestrian Safety: A Road Safety Manual for Decision
Makers and Practitioners.
World Health Organization. Pedestrian Safety: A Road Safety Manual for Decision
Makers and Practitioners. World Health Organization, Geneva, 2013.
5.3 Engage in public health surveillance on traffic-related
hospitalizations and fatalities
Data Systems: A Road Safety Manual for Decision
Makers and Practitioners
World Health Organization. Data Systems: A Road Safety Manual for Decision Makers
and Practitioners, 2010. http://apps.who.int/iris/bitstream/10665/44256/1/9789241598965
_eng.pdf.
Review of Swedish Experiences Concerning Analysis of
People Injured in Traffic Accidents
Howard, C., and A. Linder. Review of Swedish Experiences Concerning Analysis of
People Injured in Traffic Accidents, 2013. https://www.vti.se/en/publications/pdf/review
-of-swedish-experiences-concerning-analysis-of-people-injured-in-traffic-accidents.pdf.
5.4 Independent review/audit of safety program
Independent Review of Road Safety in Sweden Breen, J., E. Howard, and T. Bliss. Independent Review of Road Safety in Sweden, 2008.
Evaluating the Effectiveness of State Toward Zero Deaths
Program
Munnich et al. (11).
NCHRP Synthesis of Highway Practice 336: Road Safety
Audits
Wilson, E.M., and M.E. Lipinski. NCHRP Synthesis of Highway Practice 336: Road
Safety Audits. Transportation Research Board of the National Academies, Washington,
D.C., 2004.
5.5 Interagency sharing of collision and other key data
Road Safety as a Shared Responsibility and a Public
Problem in Swedish Road Safety Policy
McAndrews (7).
Data Systems: A Road Safety Manual for Decision
Makers and Practitioners
World Health Organization. Data Systems: A Road Safety Manual for Decision-Makers and
Practitioners. 2010. http://apps.who.int/iris/bitstream/10665/44256/1/9789241598965
_eng.pdf.
5.7 Routine evaluation of effectiveness of traffic safety
interventions
Presentation at Workshop on Independent and Transparent
Accident Investigation Recommendations
Bergfalk, L. Presentation at Workshop on Independent and Transparent Accident Investi-
gation Recommendations, Brussels, 2007. http://erso.swov.nl/safetynet/fixed/WP4
/Workshop_3_2007/sn_wp4_Brussels_WSguest4_SwedishTrafficInspectorate_LB.pdf.
Road Safety Inspections: Best Practice and
Implementation Plan
European Road Safety Observatory. Road Safety Inspections: Best Practice and Imple-
mentation Plan. http://ec.europa.eu/transport/wcm/road_safety/erso/knowledge/Content
/70_qrst/monitoring_targets.htm.
Policy Instruments for Managing Road Safety on
EU-Roads
Laurinavicius, A., L. Jukneviciute-Zilinskiene, K. Ratkeviciute, I. Lingyte, L. Cygaite,
V. Grigonis, R. Ušpalyté-Vitku–niene˙, D. Antov, T. Metsvahi, Z. Toth-Szabo, and
A. Varhely. Policy Instruments for Managing Road Safety on EU-Roads. Transport,
Vol. 27, No. 4, 2012, pp. 397–404.
5.8 Website with relevant safety data collected in a timely
manner
What Do the Best Government Websites of 2015 Have
in Common?
Wood, C., S. Towns, N. Knell, and J. Mulholland. What Do the Best Government Web-
sites of 2015 Have in Common? Government Technology, September 2015. http://
www.govtech.com/internet/2015-Best-of-the-Web-Award-Winners-Announced.html.
Using Technology to Promote Transparency in City
Government
Pulidindi, J. Using Technology to Promote Transparency in City Government. National
League of Cities, Washington, D.C., 2010.
Section 6. Policy
6.1 Measures to reduce traffic volumes
Traffic Accidents and the London Congestion Charge Green, C.P., J.S. Heywood, and M. Navarro. Traffic Accidents and the London Conges-
tion Charge. Economics Working Paper Series, Lancaster University Management
School, 2014.
TABLE 2 (continued) Matrix Sources
Document Link
(continued)
Fleisher, Wier, and Hunter 79
(continued on next page)
6.5 Pre-pay for morning parking to discourage drinking
and driving
Overnight options Estey, M. Overnight Options. International Parking Institute, November 2015. http://
www.parking.org/media/320165/prepaid%20parking%20in%20seattle.pdf.
Successful Pre-Paid Parking Program Saves Lives http://sdotblog.seattle.gov/2013/03/18/successful-pre-paid-parking-program-saves-lives/.
6.6 Restrict deliveries to off peak hours to remove trucks
from the busiest streets to improve road safety and
ease congestion
Delivering a Road Freight Legacy: Working Together
for Safer, Greener and More Efficient Deliveries in
London
Transport for London. Delivering a Road Freight Legacy: Working Together for Safer,
Greener and More Efficient Deliveries in London. 2013. http://content.tfl.gov.uk
/delivering-a-road-freight-legacy.pdf.
SWOV Fact Sheet: Blind Spot Crashes SWOV Institute for Road Safety. SWOV Fact Sheet: Blind Spot Crashes. https://www
.swov.nl/rapport/Factsheets/UK/FS_Blind_spot_crashes.pdf.
6.7b Policies targeted at protecting vulnerable users:
illegal to harass (threaten verbally or physically)
a vulnerable user
Good Intentions: The Enforcement of Hate Crime
Penalty-Enhancement Statutes.
Franklin, K. Good Intentions: The Enforcement of Hate Crime Penalty-Enhancement
Statutes. American Behavioral Scientist, Vol. 46, No. 1, 2002, pp. 154–172.
Improving Road Safety Through Deterrence-Based
Initiatives: A Review of Research
Davey, J.D., and J.E. Freeman. Improving Road Safety Through Deterrence-Based
Initiatives: A Review of Research. Sultan Qaboos University Medical Journal, Vol. 11,
No. 1, 2011, pp. 29–37.
6.8 Target safety improvements to school areas
Healthy Urban Environments for Children and Young
People: A Systematic Review of Intervention Studies
Audrey, S., and H. Batista-Ferrer. Healthy Urban Environments for Children and Young
People: A Systematic Review of Intervention Studies. Health and Place, Vol. 36, 2015,
pp. 97–117.
Effectiveness of a Safe Routes to School Program in
Preventing School-Aged Pedestrian Injury
DiMaggio, C., and L. Guohua. Effectiveness of a Safe Routes to School Program in
Preventing School-Aged Pedestrian Injury. Pediatrics, Vol. 131, No. 2, 2013, pp. 290–296.
6.11b State level policies targeted at protecting vulnerable
users: mandatory for cars to give at least three
feet of clearance when passing a bicycle in
the same lane (aka “three-foot rule”)
Is the Three-Foot Bicycle Passing Law Working in
Baltimore, Maryland?
Love, D.C., A. Breaud, S. Burns, J. Margulies, M. Romano, and R. Lawrence. Is the
Three-Foot Bicycle Passing Law Working in Baltimore, Maryland? Accident Analysis
and Prevention, Vol. 48, 2012, pp. 451–456.
The 3-ft. Law: Lessons Learned from a National Analysis
of State Policy and Expert Interviews
Brown, C. The 3-ft. Law: Lessons Learned From a National Analysis of State Policy
and Expert Interviews. New Jersey Bicycle and Pedestrian Resource Center. http://
njbikeped.org/wp-content/uploads/2013/04/3-Foot-Final-Report-Draft_V7.pdf.
6.11d State level policies targeted at protecting vulnerable
users: vulnerable user law
Is It Time to Advocate for a Vulnerable Road User
Protection Law in New Zealand?
Weiss, H., and A. Ward. Is it Time to Advocate for a Vulnerable Road User Protection Law
in New Zealand? New Zealand Medical Journal, Vol. 126, No. 1374, 2013, pp. 5–10.
The Deterrent Effect of Increasing Fixed Penalties for
Traffic Offences: The Norwegian Experience
Elvik, R., and P. Christensen. The Deterrent Effect of Increasing Fixed Penalties for
Traffic Offences: The Norwegian Experience. Journal of Safety Research, Vol. 38,
No. 6, 2007, pp. 689–695.
6.14 Lower alcohol limit
Reaching Zero: Actions to Eliminate Alcohol-Impaired
Driving
National Transportation Safety Board. Reaching Zero: Actions to Eliminate Alcohol-
Impaired Driving. Safety Report NTSB/SR-13/01. NTSB, Washington, D.C., 2013.
The Effects of Introducing or Lowering Legal per se
Blood Alcohol Limits For Driving: An International
Review.
Mann, R.E., S. Macdonald, G. Stoduto, S. Bondy, B. Jonah, and A. Shaikh. The Effects
of Introducing or Lowering Legal per se Blood Alcohol Limits for Driving: An Inter-
national Review. Accident Analysis and Prevention, Vol. 33, No. 5, 2001, pp. 569–583.
Section 7. Large vehicles
7.1 Heavy goods and large vehicle task force to suggest
safety improvements and monitor regulations
Industrial HGV task Force Review of First Six Months
of Operations
Transport for London. Industrial HGV Task Force Review of First Six Months of
Operations. http://democracy.cityoflondon.gov.uk/documents/s37699/Road%20
Safety-%20Casualties%20and%20Collisions-%20Appendix.pdf.
7.4 Outfit large vehicles with front and side mirrors to
improve visibility
Truck Mirrors, Fields of View, and Serious Truck Crashes Blower, D.F. Truck Mirrors, Fields of View, and Serious Truck Crashes. Publication
UMTRI-2007-25. University of Michigan Transportation Research Institute,
Ann Arbor, 2007.
7.5 Outfit large vehicles with rear wheel and side guards
Truck Sideguards for Vision Zero: Review and Technical
Recommendations for Safe Fleet Transition Plan Pilot
Deployment
Epstein, A.K., S. Peirce, A. Breck, C. Cooper, and E. Segev. Truck Sideguards for Vision
Zero: Review and Technical Recommendations for Safe Fleet Transition Plan Pilot
Deployment. Publication DOT-VNTSC-DCAS-14-01. U.S. Department of Transportation,
Cambridge, Mass., John A. Volpe National Transportation Systems Center, 2014.
Section 8. Vehicle technology
8.3 Intelligent speed adaption technologies that alert or slow
the vehicle if traveling over the speed limit
Is Intelligent Speed Adaptation Ready for Deployment? Carsten, O. Is Intelligent Speed Adaptation Ready for Deployment? Accident Analysis
and Prevention, Vol. 48, 2012, pp. 1–3.
TABLE 2 (continued) Matrix Sources
Document Link
80 Transportation Research Record 2582
To support accuracy, each city and country that was included in
the matrix reviewed its entries. Cities designated a reviewer, typically
their Vision Zero lead or safety expert. Reviews took place from May
to July 2015, and 11 of 12 cities or countries initially included in the
analysis participated. The representative from Australia opted to not
review the Traffic Safety Best Practices Matrix because he felt there
was too much variation among cities to make an assessment at the
country level. As a result, Australia was removed from the final ver-
sion of the matrix. Reviewers were contacted via email and were sent
a copy of the matrix that included data for their jurisdiction only with
a column titled review and a column titled comments as well as a letter
that explained the purpose of the project. Reviewers were instructed to
indicate if a measure erroneously received a checkmark (i.e., their city
was not in fact pursing or considering the measure) by placing an X in
the review column and to indicate if a measure was missing a check-
mark (i.e., their city was in fact pursuing or considering the measure)
by placing a √ in the review column; to indicate that a measure was
accurate, reviewers were asked to leave the review column blank. The
matrix was then revised to reflect reviewer feedback.
The majority of reviewers corrected some measures and expressed
either an eagerness to use the matrix to further their efforts or were
neutral toward the exercise. One region initially identified is not rep-
resented in the matrix, for the primary contact opted to not participate
because of too much variation between cities to make an assessment
at a regional level; the region was thus removed from the matrix.
DISCUSSION OF RESULTS
The Traffic Safety Best Practices Matrix (Figure 1) lists measures
that cities in the United States and cities and countries abroad are
pursuing as of May 2015 to reduce pedestrian-, bicycle-, and traffic-
related injuries and fatalities. Also included for each measure are
efficacy designations based on existing evidence. Table 2 provides
a list of the sources used for the review.
Big cities across the United States, in adopting Vision Zero, are
leading efforts to reframe the way in which traffic safety is viewed
and managed. While this effort is commendable, and speaks to the
role of cities as catalysts for change, cities are doing so without
much guidance as to what Vision Zero is and what actions could
be implemented to reach zero deaths. The Traffic Safety Best Prac-
tices Matrix attempts to bridge this gap by presenting a framework
for cities to understand and identify potential strategies for Vision
Zero implementation. The discussion details the ways in which
the matrix can assist jurisdictions in identifying the range of tools
available to them to reduce severe and fatal collisions and further
the Vision Zero movement. In addition, the discussion includes an
analysis of the matrix throughout which are recommendations for
implementation that are supported by lessons learned from Vision
Zero implementation abroad, as well as insights from other fields.
Uses of the Matrix
Strategy Identification
To move the needle on Vision Zero further and faster, cities need to
understand the Vision Zero landscape and be able to share best prac-
tices in real time. The matrix can help cities understand the range of
levers available to advance the safety platform. The measures listed
in the matrix, organized by categories, can help cities understand
the breadth of strategies available while also providing a structure
for strategy organization. This aspect of the matrix can be especially
useful for cities considering implementing the policy.
This is not to suggest that there is only one way to implement
Vision Zero. Sweden and the Netherlands, for example, have the lon-
gest and most well-established safe system approach; yet they differ
in how they articulate the safety platform. Sweden’s Vision Zero has
focused on issues of rural transportation safety, while the Netherlands
has focused on pedestrian and bicycle safety in urban areas (15).
Both have achieved great success in their efforts (16). That said,
Sweden, as it is the birthplace of Vision Zero, is looked to as pro-
viding the blueprint for Vision Zero implementation. Nonetheless,
it is inevitable—and appropriate as informed by analysis of safety
issues and crash patterns in specific jurisdictions—that the safety
measures advanced in the United States will deviate from those of
Sweden (and the Netherlands, and other counties that have for some
time pursued a systems approach to road safety).
How Much Benefit Does Intelligent Speed Adaptation
Deliver: An Analysis of Its Potential Contribution to
Safety and Environment.
Lai, F., O. Carsten, and F. Tate. How Much Benefit Does Intelligent Speed Adaptation
Deliver: An Analysis of its Potential Contribution to Safety and Environment. Accident
Analysis and Prevention, Vol. 48, 2012, pp. 63–72.
8.5 Partner with industry groups and vehicle manufacturers
to further the use of technology to achieve safety aims
Vision Zero: Adopting a Target of Zero for Road Traffic
Fatalities and Serious Injuries
Whitelegg and Haq (6).
Road Safety: Impact of New Technologies Organisation for Economic Co-operation and Development. Road Safety: Impact of
New Technologies, 2003. http://www.internationaltransportforum.org/Pub/pdf
/03SRnewTech.pdf.
Section 9. Taxi services and transportation network company
9.2 Black box data recorders in taxis
Vehicle Safety Technology Pilot Program http://www.nyc.gov/html/tlc/html/industry/veh_safety_tech_pilot_program.shtml.
Driver Characteristic Using Driving Monitoring Recorder Ueyama, M.J. Driver Characteristic Using Driving Monitoring Recorder. Proceedings
of the 17th International Technical Conference on the Enhanced Safety of Vehicles
Conference, June 4–7, 2001, Amsterdam, Netherlands. June 2001.
9.3 Increase late-night taxi stand zones
Overnight Options Estey, M. Overnight Options. International Parking Institute, November 2015. http://www
.parking.org/media/320165/prepaid%20parking%20in%20seattle.pdf.
TABLE 2 (continued) Matrix Sources
Document Link
Fleisher, Wier, and Hunter 81
Traffic Safety Best Practices
SF
N
YC
C
hicago
Portland
Seattle
D
C
B
oston
LA
Sw
eden
N
etherlandsLondon
Efficacy
InternationalDomestic
1.1 Safety Action Plan (Vision Zero)/ Strategy R, LIT
1.2 Vision Zero Policy (or VZ like policy) R, LIT
1.3 Vision Zero Steering Committee R, LIT
2.1 Informative signage
a. Advisory/cautionary signs (e.g. "State Law: Stop for Pedestrians”; "High Bicycle
Activity Zone”)
R, LIT
b. Dynamic message signs with safety messaging R, LIT
c. Remove unnecessary and/or confusing signage R, NCHRP
d. Speed indicator signs R, NCHRP
2.2 Perform engineering reviews at all traffic fatality and high collision locations and at scenes
of crashes
R, LIT
a. Pedestrian only streets R, NCHRP
b. Restrict car access in the city center R, LIT
2.4 Shared-space area for cars, bicyclists and pedestrians R, LIT
a. Bicycle signals R, NCHRP
b. Pedestrian countdown signals P, LIT
c. Hawk signal R, CMF
d. Protected turns (turn pockets & signal phasing) R, CMF
e. Puffin Crossing R, CMF
f. Rapid flash beacons R, CMF
a. Leading bike interval R, NCHRP
b. Leading pedestrian interval R, CMF
c. Pedestrian scrambles (exclusive pedestrian phase) U, CMF
a. Arterial slow zones U
b. Senior slow/safety zones P, LIT
c. Slow zones around schools/ local streets P, LIT
a. Advance stop or yield lines R, LIT
b. Enhanced sharrow markings R, LIT
c. High visibility crosswalk (continental crosswalk) P, LIT
d. Increase street lighting to improve visibility in high crash locations R, CMF
e. Lane narrowing R, NCHRP
f. Pedestrian refuge islands and medians R, NCHRP
g. Separated bike lanes R, CMF
h. Restrict parking near intersections (aka "daylighting") P, LIT
i. Road diet P, CTW
j. Roundabouts P, NCHRP
k. Speed humps, chicanes, diagonal parking, bulb outs, raised crosswalks (general traffic
calming measures)
P, NCHRP
3.1 Bike and safety/crosswalk ambassadors U, CTW
3.2 Educate state level organizations on city actions and Vision Zero commitments to broaden
understanding of Vision Zero's impact on pedestrian/bike/traffic fatalities and injuries
NA R, LIT
3.3 Engage with community based organizations and advocates R, LIT
3.4 Helmet focused education U, CTW
3.5 Mass media/communication education campaign focused on pedestrian awareness, bike
safety, and/or speeding
R, NCHRP
3.6 Measures to increase the conspicuousness of bicyclists (e.g. promotion of reflector vests,
lights, etc.)
R, CTW
3.7 Outreach to schools to educate students on bike/pedestrian/traffic safety R, CTW
3.8 Targeted education/outreach to high priority areas R, NCHRP
3.9 Train city staff on Vision Zero safety priorities R, NCHRP
3.10 Trainings for senior citizens on walking and biking R, LIT
3.11 Update officer trainings to reflect new safety priorities and regularly conduct trainings R, NCHRP
3.12 Website dedicated to bike/pedestrian/traffic safety issues and concerns R, LIT
a. Block the box camera U
b. Failure-to-yield crosswalk camera U
c. Illegal turn camera U
d. Oversize vehicle camera U
e. Point to point camera P, LIT
f. Red light camera P, NCHRP
g. Speed camera P, CTW
4.2 Convene regular meetings of transportation leaders and the police department to review
traffic safety performance and determine strategies for improvement
R, LIT
4.3 DUI checkpoints P, NCHRP
4.4 High visibility enforcement P, NCHRP
4.5 Increase enforcement against dangerous moving violations (speeding, failing to yield to
pedestrians, signal violations, improper turns/illegal turns, phoning/texting while driving)
R, CTW
4.6 Investigate crashes that result in fatalities as well as crashes that result in critical injuries R, LIT
4.7 Random breath testing P, LIT
4.8 Update technology that assists with capturing crash data and/or speed detection R, LIT
InternationalDomestic
1. Supportive infrastructure/ Planning
2. Engineering
2.3 Restrictions on street access
2.5 Signal hardware additions
2.6 Signal hardware uses
2.7 Slow Zones
2.8 Road design
3. Education
4. Enforcement
4.1 Automated enforcement
(a)
FIGURE 1 Traffic Safety Best Practices Matrix (SF = San Francisco; NYC = New York City; DC = Washington, D.C.; LA = Los Angeles).
(continued on next page)
82 Transportation Research Record 2582
5. 1 Comparative data system linking social and environment factors with injury data P, LIT
5. 2 Continual, proactive monitoring and feedback gathering from the community on their safety
issues and concerns
R, LIT
5.3 Engage in public health surveillance on traffic-related hospitalizations and fatalities P, LIT
5.4 Independent review/audit of safety program R, LIT
5.5 Interagency sharing of collision and other key data R, LIT
5.6 Publish city-wide collision report R, LIT
5.7 Routine evaluation of effectiveness of traffic safety interventions R, LIT
5.8 Website with relevant safety data collected in a timely manner R, LIT
5. Monitoring, Analysis, and Evaluation
Traffic Safety Best Practices
SF
N
YC
C
hicago
Portland
Seattle
D
C
B
oston
LA
Sw
eden
N
etherlandsLondon
Efficacy
InternationalDomestic InternationalDomestic
a. Congestion pricing R, LIT
a. Implement Complete Streets policy U
b. Transportation Demand Management Program U
6.3 Mandatory helmet law (18+) R, CTW
6.4 No right turn on red (city-wide) R, NCHRP
6.5 Pre-pay for morning parking to discourage drinking and driving R. LIT
6.6 Restrict deliveries to off peak hours to remove trucks from the busiest streets to improve
road safety and ease congestion
R, LIT
a. Classify traffic-related incidents as collisions and not accidents U
b. Illegal to harass (threaten verbally or physically) a vulnerable user U, LIT
6.8 Target safety improvements to school areas R, LIT
6.9 Align state level Towards Zero Death policy with local level Vision Zero policy NA NA NA NA U
a. Change DMV point penalty structure so that dangerous offenses are punished with the
most severe point values
NA NA NA U, CTW
b. Increase penalties for driving with a suspended license NA NA NA R, CTW
c. Increase penalties for leaving the scene of a crash NA NA NA R, CTW
a. Increase consequences (fines, tickets, jail time) for careless driving (e.g. injuring a
pedestrian/bicyclist, failing to stop and give right of way to pedestrians in crosswalks, etc.)
U, CTW
b. Mandatory for cars to give at least three feet of clearance when passing a bicycle in
the same lane (aka "three-foot rule")
U, LIT
c. Ticket and fine motorists who open a door into the path of other traffic, including
bicycles and pedestrians (aka "dooring")
U
d. Vulnerable User law U, LIT
6.12 Variable speed limits via signage R, NCHRP
6.13 Identify opportunities to advance Vision Zero policies, practices and projects in federal
programs with US DOT and Congress
NA NA NA U
6.14 Lower alcohol limit P, LIT
7.1 Heavy Goods/ Large Vehicle Task Force to suggest safety improvements and monitor
regulations R, LIT
7.2 Install blind spot mirrors at the most hazardous intersections to help large vehicle drivers
better see bicyclists
U
7.3 Large vehicle driver education on bike/pedestrian safety R, NCHRP
7.4 Outfit large vehicles with front and side mirrors to improve visibility P, LIT
7.5 Outfit large vehicles with rear wheel and side guards P, LIT
8.1 Alcohol interlocks in government and commercial fleets P, NCHRP
8.2 Driver awareness systems to alert the driver to the presence of pedestrians near the vehicle
cameras, sensors)
R, CMF
8.3 Intelligent speed adaption technologies that alert or slow the vehicle if traveling over the
(speed limit) P, LIT
8.4 Lane departure warning assistance R, CMF
8.5 Partner with industry groups and vehicle manufacturers to further the use of technology to
achieve safety aims
R, LIT
9.1 Automatic meter shut-off in taxis that speed U
9.2 Black box data recorders in taxis U, LIT
9.3 Increase late-night taxi stand zones R, LIT
9.4 Issue tickets to taxi drivers identified by red light cameras R, CTW
9.5 TNC regulations (training, devices, safety equipment) U
9.6 Update taxi education to reflect safety priorities R, NCHRP
9.7 Window stickers warning passengers to not open their door into passing bicyclist R, CTW
7. Large Vehicles
KEY
8. Vehicle Technology
9. Taxi Services and Transportation Network Company
= Planned/
A Priority/
In Process/
In Practice
NA =
Not applicable
P = Proven
R = Recommended
U = Unknown
CTW = Countermeasures that Work
NCHRP = NCHRP 500 Report
CMF = Crash Modification Factors
Clearinghouse
LIT = Literature
6.7 Policies targeted at protecting vulnerable users
State
6. Policy
Local
6.10 State policies targeted at collision reduction
6.11 State level policies targeted at protecting vulnerable users
Federal
6.2 Crosscutting measures to reduce car dependence/ improve transit /promote walking and biking
6.1 Measures to reduce traffic volumes
(b)
FIGURE 1 (continued) Traffic Safety Best Practices Matrix.
Fleisher, Wier, and Hunter 83
Adaptation and implementation of Vision Zero in the United
States should be mindful of the core principle of Vision Zero: to
reduce severe and fatal injuries and shield the human body from
excessive force, speed must be managed. This can best be achieved
by lowering speeds and redesigning streets to support low speeds (4).
Efficacy Assessment and Future Research Needs
By identifying the known efficacy of measures, the matrix can help
cities select evidence-based measures to assist them in their efforts to
reach zero. However, since Vision Zero is so new to the U.S. context,
many measures have yet to be evaluated (or evaluated consistently),
and thus may yet prove to be effective. Several of these measures
are concentrated in the policy section of the matrix. For example,
the change in classification of traffic-related incidents as collisions
and not accidents (6.7a, U) is a recent linguistic shift, and its impact
on road safety has yet been studied. Strategies that promote walk-
ing, biking, and transit (6.2a, U; 6.2b, U) have the potential to affect
safety dependent of the extent to which they include changes in sys-
tem design that have proven safety benefits (i.e., to ensure increases
in active transportation are not accompanied by increases in severe
and fatal injury), beyond encouraging mode shift.
This does not mean these and other U measures should not be
pursued per se; rather, if practitioners pursue a U, they should seek
to also include an evaluation component as part of the project.
Researchers should consider measures designated U as opportuni-
ties for future research. Adoption of Vision Zero by U.S. cities is in
many ways a natural experiment, with notable variation in how U.S.
cities are adopting and implementing the platform. It is anticipated
that there should be ample opportunities for researchers to evalu-
ate the efficacy of individual measures that currently lack sufficient
evaluation—as well as evaluation opportunities for the synergistic
impacts of implementing multiple safety measures, consistent with
the safe system approach.
Benchmarking
The matrix can also be used as a means for cities to benchmark efforts
to advance Vision Zero. Cities can examine the matrix to consider
what additional measures other cities are implementing, toward set-
ting realistic goals for improvement or identify opportunities for new
partnerships to help advance the Vision Zero goal.
Discussion Among Cities
Cities can also use the matrix to facilitate peer city exchange. The
matrix allows cities to become aware of the measures that their peers
are implementing. Thus, cities will know whom to engage to find
out more information and to determine if a measure is appropriate
for their city.
Analysis of Traffic Safety Best Practices Matrix
The researchers analyzed the matrix and arranged their observations
by the themes that emerged: measures with (a) widespread adop-
tion, (b) limited implementation, and (c) minimal utilization. In the
following analysis, there is discussion of how these findings can
inform the next steps for Vision Zero implementation, with a focus
on implications for U.S. cities. The discussion notes the location of
the measure on the matrix as well as the efficacy designation.
Widespread Adoption
In several sections and individual lines in the matrix there is a
clustering of checkmarks, which suggests widespread adoption
of the measures among the cities included in this analysis, includ-
ing implementation or plans for adoption. Clustering for a sec-
tion or line is defined as its having more than 70% of the boxes
checked.
Engineering, the second section, is an area in which one sees
significant clustering of checkmarks. That suggests that this area
has received considerable attention from the cities and countries
included in the review and that many of the countermeasures are
well-used. The engineering countermeasures focus on reducing
speeds and range from reducing speeds limits on local streets and
near schools and senior centers, and on arterials (2.7a, U; 2.7b, P;
2.7c, P); installing electronic signage that indicates speed (2.1d, R);
and geometric changes, in particular pedestrian refuge islands
(2.8f, R) (17); roundabouts (2.8j, P) (17); and speed humps (2.8k, P)
(18). Many of these measures have an on impact road design, which
is a critical way to modify speeds to make roads inherently safe (19).
Engineering measures not well used or selectively used include puf-
fin crossings (2.5e, R); senior slow zones (2.7b, P); in the United
States, specifically, restrictions on street access (2.3a, R; 2.3b, R);
and roundabouts (2.8j, P). Some of these measures are particu-
larly innovative, some may necessitate significant construction,
and some may require enhanced political or community support.
These factors, among others, could explain their paucity in uptake.
Cities leading on these efforts could be sought out for additional
information.
Education, Section 3, is another section where most peer cities
and counties have implemented multiple measures. The main excep-
tion in this section is Sweden, for it is the only location included
in the review not using mass media or communication education
(3.5, R). This is fitting with how Sweden conceptualized Vision
Zero: education was considered capable of maintaining existing
safety levels, but it was unlikely to generate the significant future
improvement needed to achieve the paradigm’s ambitious goals (5).
Indeed, focusing on educating the road user is antithetical to the
idea that grounds Vision Zero: Individuals make mistakes no mat-
ter how well educated (1). Under Sweden’s Vision Zero, road users
are responsible for following the rules, but this expectation runs
parallel to system designers’ efforts at continually making the road
system safer (10). Sweden does not emphasize education per se, but
instead creating more respect for the rules of the road, in particular
with regard to speed limits, seat belt use, and intoxicated driving (6),
a nuanced but important distinction. Education about road safety in
the traditional sense was never emphasized in Sweden because its
planning focus, since the 1960s, was to alter the built environment,
by placing restriction on cars, to achieve safety. In essence, the road
has provided the education (7).
It is not surprising that education is a well-used tool for Vision
Zero implementation in the United States, given that education
and enforcement have since the 1960s assumed a primary role in
safety promotion—equally aligned with the other E: engineering.
Yet these tools have been used in an environment where, unlike
Sweden, the dominance of the car was never challenged so as to
make streets inherently safe (7). Now many U.S. cities are focus-
ing more on changes to the built environment to achieve safety. It
84 Transportation Research Record 2582
will be interesting to see how the emphasis on education shifts over
time as Vision Zero is implemented, particularly if U.S. implemen-
tation maintains Sweden’s focus on system design. U.S. cities could
approach this transition as an opportunity to consider an alterna-
tive approach to education, advanced by the field of public health,
which would be to take a socioecological approach to education
efforts and focus not only on enhancing individual skills, but on
how education can support changes in organizational practices and
policy reform (20). This approach seems more aligned with Vision
Zero principles.
Another area of widespread adoption is supportive infrastruc-
ture and planning, Section 1, which the research suggests is fun-
damental to successful Vision Zero implementation. Here, again,
Sweden is the exception in that it does not use a Vision Zero task
force or steering committee (1.3, R). In this case, that absence
suggests less a fundamental difference in approach (as with educa-
tion) and instead a limitation in implementation (7). While multi-
sectorial thinking informed the development of Vision Zero in
Sweden, this collaboration did not continue into the implemen-
tation phase. Lack of cooperation and consultation among sec-
tors were acknowledged as reasons for which Sweden failed to
reach its 2007 target of a 50% reduction in traffic-related deaths
from 1997 (21). Since then, Sweden has set up structures for col-
laboration: six times a year representatives from municipalities,
the police, occupational health, vehicle industry and insurance
companies meet with representatives from the Swedish Transport
Administration and Agency to discuss safety efforts. Stakeholders
are also engaged at the annual result conferences, where analysis
of road safety performance indicators (such as speed compliance
and seat belt use) is presented (3). In addition, representatives
from different sectors come together to analyze crash data. What
seems to be lacking are ongoing, daily, working relationships
across sectors (7). McAndrews (7) argues that public health,
police, vehicle manufactures, and safety specialists have been left
out of Vision Zero, and that it has concentrated responsibility in
the transportation sector (7). U.S. cities can learn from this short-
coming and concentrate on developing mechanisms that support
the institutionalize Vision Zero in existing institutions beyond the
transportation sector, including public health, police, and other
key implementation partners.
Vision Zero is an example of Health in All Policies (HiAP),
an approach to policy making that has struggled since forming in
the 1980s to engage across sectors and whose experience further
demonstrates how lacking institutions can undermine even best
intentions at collaboration. HiAP calls for incorporating health
considerations into decision-making structures across sectors
and policy areas (22). Like Vision Zero, HiAP has as its origins
in Europe and is a nontraditional approach. It requires leadership
and resources from outside public health and the formation of new
structures and processes that align agency missions and identify
shared agendas to advance health in nonhealth sectors (23, 24).
Yet HiAP has struggled because it has had difficulty creating a
foundation to support its intersectoral work. HiAP experts argue
that the how of shared governance—infrastructures, tools, instru-
ments, and processes that facilitate intersectoral partnerships—is
not well understood, and that, until it is, there will be difficulty
in overcoming the typical, siloed approach to government work
(25). The experience of HiAP suggests the salience of investing
the resources, time and personnel necessary to develop productive
intersectoral collaborations. Done well, Vision Zero cities could
emerge as models for HiAP efforts.
Limited Implementation
Some measures are being used by only a few U.S. cities and only a
few of the international cities and countries included in the review.
The definition of “select” is having, for a section or line, between
40% and 69% of the boxes checked.
As can be seen in the matrix, cities are not seeking opportuni-
ties for collaboration across all levels of government, even though
positioning on traffic safety policy in U.S. at the federal, state, and
local level is more aligned than not. Only a select group of cities
are educating state level organizations on their city’s Vision Zero
commitment (3.2, R), engaging with their state level TZD policy
(6.9, U), or seeking opportunities to advance their efforts at the fed-
eral level (6.13, U). All the U.S. cities included in the review, with
the exception of New York City, have at their state level a TZD pol-
icy. Seattle stands out in that it drafted its Vision Zero strategy to be
in line with the state’s Target Zero plan (J. Curtin, e-mail correspon-
dence, July 6, 2015). TZD is an effective strategy: a 2012 evaluation
of the TZD programs in Idaho, Minnesota, Utah, and Washington
found that fatality rates decreased faster in these states than in states
without TZD programs (11). Efforts at the federal level also have as
their focus the elimination of traffic fatalities, and the government’s
recently published national strategy on highway safety aims to provide
direction for both federal and state level TZD efforts (12).
Federal, state, and local levels of government share the vision of
eliminating traffic fatalities and are all developing strategies that
trace their roots to Vision Zero and the safe system approach. While
the space governed by each agency is different (highway as opposed
to local roads, for example), at the very least, this alignment of goals
suggests an opportunity for collaboration to advance and strengthen
traffic safety efforts and address challenges that lie at the intersec-
tion of federal, state, and local jurisdictions. What can cities learn
from successful TZD efforts? What do city-level Vision Zero efforts
have to offer state and federal TZD efforts? Where do these efforts
meet and diverge? How can these policies be aligned and strength-
ened? These are all questions that cities can consider and pursue as
they implement Vision Zero, and the answers will help practitioners
and researchers better understand if and how this collaboration is
effective.
Minimal Utilization
Many measures are being implemented by less than 40% of the
cities and countries included in the review. This suggests that there
are many areas where U.S. cities could consider placing additional
emphasis as they further efforts to implement Vision Zero.
Vehicle technology, Section 8, is the one with the fewest boxes
checked by the peer cities and counties. So it represents an area
of great opportunity for U.S. cities. Only New York City and San
Francisco indicated that they are considering partnerships with
industry groups and vehicle manufactures (8.5, R) as part of their
approach to Vision Zero. The four technologies highlighted in
the Matrix, alcohol interlocks (8.1, P), driver awareness systems
(8.2, R), intelligent speed adaptation (8.3, P), and lane departure
warning assistance (8.4, R) all have proven safety benefits (26–28).
Vehicle safety, achieved through advances in vehicle technology, is
a strong focus of Vision Zero in Sweden, but this is not surprising,
given that representatives from the automobile industry and experts
on motor vehicle design were involved in the conceptualization of
the safety philosophy (7).
Fleisher, Wier, and Hunter 85
In the United States, vehicle safety is pursued at the federal level
by NHTSA; cities have not historically been designated actors in
this space (29). because vehicle safety is NHTSA’s domain, cities
may be unsure how they fit, or if they should become involved at
all. Cities do have jurisdiction over their bus fleet and may consider
ways to use technology to improve the safety of their buses. For
example, London is piloting intelligent speed adaptation, an inno-
vative technology that ensures that vehicles cannot exceed speed
limits on their buses (30). Perhaps the answer for U.S. cities is to not
involve themselves in vehicle safety outright, but to consider ways
in which private sector partnerships or technology in general can
help them eliminate fatalities and serious injuries from their roads.
Such an approach is consistent with Vision Zero’s emphasis on sys-
tems thinking.Agood example of this is New York City’s request to
Google to change its directions to discourage left turns (31).
Automated enforcement (4.1a–d, U; 4.1e–g, P), actively pursued in
the United States by Washington, D.C., is an area where checkmarks
are scant. This suggests that automated enforcement is not only a key
area for pursuit, but, in addition, an area apt for peer-city information
sharing. Automated enforcement is a highly effective tool for speed
reduction (32). Washington, D.C., uses five types of automated cam-
eras, while the other U.S. cities employ only red light or transit-only
cameras, if they do so at all. Many cities checked the box for speed
cameras (4.1g; P), but for most cities, this is something they are plan-
ning should they be able to get jurisdiction from their state. Other rea-
sons that could explain why some U.S. cities are pursuing efforts while
others are not are timing, funding, and staffing needs.
Publishing a website with relevant safety data (5.8, R)—another
area on the matrix where checkmarks are lacking—is a means
through which cities could help achieve Vision Zero’s core prin-
ciple that road users demand safety improvements—a responsibility
that implies that public participation in transportation decision mak-
ing is central to achieving Vision Zero (7). A website that clearly
articulates the number of severe and fatal injuries, project delivery
status, and relevant enforcement citation data, in addition to other
key indicators, can facilitate transparency and accountability. It
can thus assist the public in monitoring progress toward zero and
allowing cities to achieve this key aim of the safety philosophy. To
ensure this outcome, it is imperative that information on the web-
site be presented in such that it can be easily interpreted by a lay
audience and that analysis be provided where needed. In addition,
staff responsible for the website should be responsive to the pub-
lic’s needs for additions or clarifications. Public participation and
accountability for Vision Zero initiatives were not adequately cap-
tured by the matrix review. Nevertheless, they are important compo-
nents for consideration as Vision Zero is implemented across U.S.
cities, given the political will required to change the status quo with
respect to some of the identified strategies (e.g., automated speed
enforcement), as well as findings that severe and fatal injuries are
often concentrated in areas that are disproportionately low-income,
communities of color, and home to residents including seniors and
people with disabilities reliant on walking or public transit (33).
Additionally, routine evaluation of the effectiveness of traffic
safety initiatives (5.7, R), while standard practice in the interna-
tional regions reviewed, was notably absent among U.S. cities.
Institutionalizing evaluation of the effectiveness of these measures
will help ensure that resources are used most efficiently and can
help inform the state of the practice. However, this requires prioriti-
zation of funding and staff resources to ensure that robust evaluation
can be planned, implemented, and shared to inform local practice.
Development of comprehensive surveillance systems (5.4, R) is
strongly supportive of this effort, as well as the overall data-driven
approach to Vision Zero.
LIMITATIONS
The matrix can be a useful tool for strategy identification, bench-
marking, and facilitating discussion among jurisdictions imple-
menting Vision Zero. However, the matrix is a macrolevel effort
and should be approached as a screening tool. To develop targeted,
efficient, evidence-based strategies, cities should consider analysis
of crash types; priority locations for investments based on severe
and fatal crash densities and predictive factors; funding; staffing
needs; and other area-specific issues.
Two limitations are specific to the matrix. First, comparing cities
with countries has the potential to obscure the analysis. How-
ever, as Vision Zero (and its iterations) in Sweden, the Netherlands,
and Australia is a country-level effort, it was believed appropriate
to look at the country as a whole. Further, it was believed appro-
priate because these countries have led on implementing systems
approaches to traffic safety, and the researchers did not want to
miss out on their insights and lessons. Moreover, there was great
difficulty in finding sufficient city-specific information that would
allow analyzing an individual city in these countries. Second, the
cities and countries included in the review elected whom they wanted
to review the matrix, and the researchers are unaware of the extent
to which they sought corroboration from other members of their
own staff. The assumption was that the checkmarks were accurate,
but this is acknowledged as a limitation.
CONCLUSIONS AND RECOMMENDATIONS
The article presents the Traffic Safety Best Practices Matrix, a tool
to help cities identify the landscape of strategies being used domes-
tically and internationally to advance Vision Zero. There are fours
ways in which cities implementing Vision Zero can use the tool:
1. Identify the range of levers available to advance Vision Zero,
2. Understand the currently known efficacy of the strategies and
identify opportunities for future research,
3. Benchmark efforts to advance Vision Zero, and
4. Engage in peer exchange.
Through an analysis of the matrix, which was supported by les-
sons learned from Vision Zero implementation abroad, as well as
insights from other fields, there was identification of measures
with widespread adoption, limited implementation, and minimal
utilization.
On the basis of matrix analysis, lessons learned from Vision Zero
implementation abroad, as well as insights from other fields, the fol-
lowing recommendations are offered as next steps for Vision Zero
implementation in cities in the United States:
1. Develop mechanisms that institutionalize Vision Zero in exist-
ing institutions needed for its implementation that extend beyond
the transportation sector.
2. Consider approaching education more in line with that of
Sweden, where the focus is on creating respect for the rules of the
road that are being emphasized through system design, for example,
slow speeds. Focus education efforts on how education can support
86 Transportation Research Record 2582
the changes in organizational practices and policy reform that allow
for changes in system design.
3. Seek opportunities to engage with state and federal leaders on
Vision Zero efforts.
4. Explore technology advances that address the unique safety
needs of cities.
5. Pursue automated speed enforcement and other camera tech-
nologies that have proven safety benefits.
6. Facilitate accountability by creating web-based, publicly
accessible spatial data systems that monitor, analyze, and report
fatalities and severe injuries and associated factors, as well as facili-
tate benchmarks on policy progress, to help constituents realize the
magnitude and distribution of transportation injuries and create the
collective consciousness needed to achieve the policy’s aims.
ACKNOWLEDGMENTS
The authors thank Ryan Greene-Roesel, who was instrumental in the
development of the matrix, for her review of this paper. In addition,
the authors thank San Francisco staff and community stakeholders
who provided direction for the creation of the matrix and everyone
from the representative jurisdictions who reviewed the matrix for
accuracy.
REFERENCES
1. Tingvall, C., and N. Haworth. Vision Zero:An EthicalApproach to Safety
and Mobility. In Proceedings of the 6th ITE International Conference on
Road Safety andTraffic Enforcement: Beyond 2000, Melbourne,Australia,
Sept. 6–7, 1999.
2. Belin, M., P. Tillgren, and E. Vedung. Vision Zero—A Road Safety
Policy Innovation. International Journal of Injury Control and Safety
Promotion, Vol. 19, No. 2, 2012, pp. 171–179.
3. Analysis of Road Safety Trends 2013: Management by Objectives
for Road Safety Work Towards the 2020 Interim Targets. Publication
2014:129. Swedish TransportAdministration, Borlänge, Sweden, 2014.
4. Johansson, R. Vision Zero–Implementing a Policy for Traffic Safety.
Safety Science, Vol. 47, No. 2, 2009, pp. 826–831.
5. Organisation for Economic Co-operation and Development–International
Transportation Forum. Towards Zero: Ambitious Road Safety Targets and
the Safe System Approach. OECD Publishing, Paris, 2008.
6. Whitelegg, J., and G. Haq. Vision Zero: Adopting a Target of Zero for
Road Traffic Fatalities and Serious Injuries. Stockholm Environment
Institute, Sweden, 2006.
7. McAndrews, C. Road Safety as a Shared Responsibility and a Public
Problem in Swedish Road Safety Policy. Science,Technology, and Human
Values, Vol. 38, No. 6, 2013, pp. 749–772.
8. Tefft, B.C. Impact Speed and a Pedestrian’s Risk of Severe Injury or
Death. Accident Analysis and Prevention, Vol. 50, 2013, pp. 871–878.
9. Australasian College of Road Safety. Safe System Approach. http://acrs
.org.au/wp-content/uploads/ACRS_Safe-Systems_20100802_FA.pdf.
Accessed Nov. 16, 2014.
10. Elvebakk, B. Vision Zero: Remaking Road Safety. Mobilities, Vol. 2,
No. 3, 2007, pp. 425–441.
11. Munnich,L.W.,F.Douma,X.Qin,J.D.Thorpe,andK.Wang.Evaluating
the Effectiveness of State Toward Zero Deaths Program. Report CTS
12-39T. Center for Excellence in Rural Safety, University of Minnesota,
Minneapolis, 2012.
12. Toward Zero Deaths: A National Strategy on Highway Safety, June
2014. http://www.towardzerodeaths.org/wp-content/uploads/TZD
_Strategy_12_1_2014.pdf. Accessed Nov. 16, 2014.
13. Transport for London. Safe Streets for London: The Road Safety Action
Plan for London 2020. June 2013. https://tfl.gov.uk/cdn/static/cms
/documents/safe-streets-for-london.pdf. Accessed Nov. 16, 2014.
14. Washington State Strategic Highway Safety Plan, Dec. 2013. http://
www.wsdot.wa.gov/NR/rdonlyres/5FC5452D-8217-4F20-B2A9
-080593625C99/0/TargetZeroPlan.pdf. Accessed Nov. 1, 2015.
15. Shahum, L. Five Key Lessons from Europe’s Vision Zero Success.
Streetsblog, June 2015. http://usa.streetsblog.org/2015/06/10/five-key
-lessons-from-europes-vision-zero-success/. Accessed July 11, 2015.
16. Organisation for Economic Co-operation and Development–International
Transportation Forum. Road Safety Annual Report 2014. OECD
Publishing, Paris, 2014.
17. Toolbox of Countermeasures andTheir Potential Effectiveness for Pedes-
trian Crashes. Publication FHWA-SA-014. FHWA, U.S. Department
of Transportation, 2008.
18. Webster, D.C., and R.E. Layfield. Review of 20 mph Zones in London
Boroughs. Published Project Report PPR243. LondonAccidentAnalysis
Unit, Transport for London, 2003.
19. Mackenbach, J., and M. McKee. Successes and Failures of Health
Policy in Europe: Four Decades of Divergent Trends and Converging
Challenges. Maidenhead, McGraw-Hill Education, New York, 2013.
20. Cohen,L.,andS.Swift.TheSpectrumofPrevention:DevelopingaCom-
prehensive Approach to Injury Prevention. Injury Prevention, Vol. 5,
No. 3, 1999, pp. 203–207.
21. Lie, A., and C. Tingvall. Government Status Report from Sweden. ESV
2009. Swedish Road Administration, Borlänge, Sweden, 2009.
22. Rudolph, L., J. Caplan, K. Ben-Moshe, and L. Dillon. Health in All
Policies: A Guide for State and Local Governments. American Public
Health Association and Public Health Institute, Washington, D.C., and
Oakland, Calif., 2013.
23. Greaves, L.J., and L.R. Bialystok. Health in All Policies—All Talk
and Little Action? Canadian Journal of Public Health, Vol. 102, No. 6,
2011, pp. 407–409.
24. Bostic, R.W., R.L.J. Thornton, E.C. Rudd, and M.J. Sternthal. Health
in All Policies: The Role of the U.S. Department of Housing and Urban
Development and Present and Future Challenges. Health Affairs (Proj-
ect Hope), Vol. 31, No. 9, 2012, pp. 2130–2137.
25. Kickbusch, I. Health in All Policies: Where to From Here? Health Pro-
motion International, Vol. 25, No. 3, 2010, pp. 261–264.
26. Voas, R.B. Monitoring Drinking: Alternative to License Suspension to
Control Impaired Drivers? In Transportation Research Record: Jour-
nal of the Transportation Research Board, No. 2182, Transportation
Research Board of the National Academies, Washington, D.C., 2010,
pp. 1–7.
27. Hagiwara, T., H. Hamaoka, M. Hamaguchi, S. Nakabayashi, K. Munehiro,
and R. Sakakima. Dedicated Short-Range Communication System
for Pedestrians and Vehicles During Right Turns. In Transportation
Research Record: Journal of the Transportation Research Board,
No. 2299, Transportation Research Board of the National Academies,
Washington, D.C., 2012, pp. 157–165.
28. Arhin, S.A., A. Eskandarian, J. Blum, P. Delaigue, and D. Soudbakhsh.
Effectiveness and Acceptance of Adaptive Intelligent Speed Adaptation
Systems. In Transportation Research Record: Journal of the Transpor-
tation Research Board, No. 2086, Transportation Research Board of the
National Academies, Washington, D.C., 2008, pp. 133–139.
29. Hakkert, A.S., and V. Gitelman. Thinking About the History of Road
Safety Research: PastAchievements and Future Challenges. Transporta-
tion Research Part F: Traffic Psychology and Behaviour, Vol. 25, Part B,
2014, pp. 137–149.
30. Bus Speed Safety Trial Starts, June 2015. https://tfl.gov.uk/info-for
/media/news-articles/bus-speed-safety-trial-starts. Accessed July 24,
2015.
31. Goodyear, S. New York Wants Google Maps to Discourage Left Turns.
CityLab, July 2015. http://www.citylab.com/commute/2015/07/new
-york-wants-google-maps-to-discourage-left-turns/398114/. Accessed
July 24, 2015.
32. Retting, R.A., and C.M. Farmer. Evaluation of Speed Camera Enforce-
ment in the District of Columbia. In Transportation Research Record:
Journal of the Transportation Research Board, No. 1830, Transporta-
tion Research Board of the National Academies, Washington, D.C.,
2003, pp. 34–37.
33. Vision Zero SFTwo-Year Action Strategy, 2014. http://www.joomag.com
/magazine/vision-zero-san-francisco/0685197001423594455?short.
Accessed July 29, 2015.
The Standing Committee on Transportation Issues in Major Cities peer-reviewed
this paper.

Weitere ähnliche Inhalte

Was ist angesagt?

Vision zero equity Strategies
Vision zero equity StrategiesVision zero equity Strategies
Vision zero equity Strategiesvisionzeronetwork
 
Centering Safety at Metropolitan Planning Organizations
Centering Safety at Metropolitan Planning OrganizationsCentering Safety at Metropolitan Planning Organizations
Centering Safety at Metropolitan Planning OrganizationsKathleen Ferrier
 
Portland Tames Speed for Safety, a Case Study for Vision Zero Cities
Portland Tames Speed for Safety, a Case Study for Vision Zero CitiesPortland Tames Speed for Safety, a Case Study for Vision Zero Cities
Portland Tames Speed for Safety, a Case Study for Vision Zero Citiesvisionzeronetwork
 
Sussex Development Lecture presentation by Ghazala Mansuri and Vijayendra Rao...
Sussex Development Lecture presentation by Ghazala Mansuri and Vijayendra Rao...Sussex Development Lecture presentation by Ghazala Mansuri and Vijayendra Rao...
Sussex Development Lecture presentation by Ghazala Mansuri and Vijayendra Rao...Institute of Development Studies
 
Ten Cities, Four Countries, Five Years: Lessons on the Process of Building Ur...
Ten Cities, Four Countries, Five Years: Lessons on the Process of Building Ur...Ten Cities, Four Countries, Five Years: Lessons on the Process of Building Ur...
Ten Cities, Four Countries, Five Years: Lessons on the Process of Building Ur...The Rockefeller Foundation
 
Environment urbanizationbrief –-26
Environment urbanizationbrief –-26Environment urbanizationbrief –-26
Environment urbanizationbrief –-26Dr Lendy Spires
 
Design and politics understanding global resiliency
Design and politics understanding global resiliencyDesign and politics understanding global resiliency
Design and politics understanding global resiliencyThe Rockefeller Foundation
 

Was ist angesagt? (11)

Vision zero equity Strategies
Vision zero equity StrategiesVision zero equity Strategies
Vision zero equity Strategies
 
Centering Safety at Metropolitan Planning Organizations
Centering Safety at Metropolitan Planning OrganizationsCentering Safety at Metropolitan Planning Organizations
Centering Safety at Metropolitan Planning Organizations
 
Portland Tames Speed for Safety, a Case Study for Vision Zero Cities
Portland Tames Speed for Safety, a Case Study for Vision Zero CitiesPortland Tames Speed for Safety, a Case Study for Vision Zero Cities
Portland Tames Speed for Safety, a Case Study for Vision Zero Cities
 
poster_V11
poster_V11poster_V11
poster_V11
 
Elements of Effective Engagement
Elements of Effective EngagementElements of Effective Engagement
Elements of Effective Engagement
 
Sussex Development Lecture presentation by Ghazala Mansuri and Vijayendra Rao...
Sussex Development Lecture presentation by Ghazala Mansuri and Vijayendra Rao...Sussex Development Lecture presentation by Ghazala Mansuri and Vijayendra Rao...
Sussex Development Lecture presentation by Ghazala Mansuri and Vijayendra Rao...
 
Ten Cities, Four Countries, Five Years: Lessons on the Process of Building Ur...
Ten Cities, Four Countries, Five Years: Lessons on the Process of Building Ur...Ten Cities, Four Countries, Five Years: Lessons on the Process of Building Ur...
Ten Cities, Four Countries, Five Years: Lessons on the Process of Building Ur...
 
Environment urbanizationbrief –-26
Environment urbanizationbrief –-26Environment urbanizationbrief –-26
Environment urbanizationbrief –-26
 
Design and politics understanding global resiliency
Design and politics understanding global resiliencyDesign and politics understanding global resiliency
Design and politics understanding global resiliency
 
InclusionaryZoning_LR
InclusionaryZoning_LRInclusionaryZoning_LR
InclusionaryZoning_LR
 
NRI Overview
NRI OverviewNRI Overview
NRI Overview
 

Ähnlich wie A Vision For Transportation Safety_2016

Toolkit decade of action for road safety 2011 2020 english
Toolkit decade of action for road safety 2011 2020 englishToolkit decade of action for road safety 2011 2020 english
Toolkit decade of action for road safety 2011 2020 englishNETWORKVIAL MEXICO
 
Vision, Strategies, Action: Guidelines for an Effective Vision Zero Action Plan
Vision, Strategies, Action: Guidelines for an Effective Vision Zero Action PlanVision, Strategies, Action: Guidelines for an Effective Vision Zero Action Plan
Vision, Strategies, Action: Guidelines for an Effective Vision Zero Action Planvisionzeronetwork
 
Centering Safety at Metropolitan Planning Organizations
Centering Safety at Metropolitan Planning OrganizationsCentering Safety at Metropolitan Planning Organizations
Centering Safety at Metropolitan Planning Organizationsvisionzeronetwork
 
Global Plan for Road Safety ( 2021-2030)
Global Plan for Road Safety ( 2021-2030)Global Plan for Road Safety ( 2021-2030)
Global Plan for Road Safety ( 2021-2030)Christina Parmionova
 
Does road safety have any lessons for workplace health and safety.docx
Does road safety have any lessons for workplace health and safety.docxDoes road safety have any lessons for workplace health and safety.docx
Does road safety have any lessons for workplace health and safety.docxelinoraudley582231
 
Safety Target Coordination Report
Safety Target Coordination ReportSafety Target Coordination Report
Safety Target Coordination ReportRyan Klitzsch
 
The Urgency of Now
The Urgency of NowThe Urgency of Now
The Urgency of NowGlobal NCAP
 
Vision Zero Network Core Elements
Vision Zero Network Core ElementsVision Zero Network Core Elements
Vision Zero Network Core Elementsvisionzeronetwork
 
IRJET - Road Accident and Emergency Management: A Data Analytics Approach
IRJET - Road Accident and Emergency Management: A Data Analytics ApproachIRJET - Road Accident and Emergency Management: A Data Analytics Approach
IRJET - Road Accident and Emergency Management: A Data Analytics ApproachIRJET Journal
 
Estudio Jessica Dennis Canada
Estudio Jessica Dennis CanadaEstudio Jessica Dennis Canada
Estudio Jessica Dennis CanadaConBici
 
12 part framework to structure safety assessment for autonomous driving
12 part framework to structure safety assessment for autonomous driving12 part framework to structure safety assessment for autonomous driving
12 part framework to structure safety assessment for autonomous drivingZiaullah Mirza
 
The governance of the risks of ridesharing in southeast asia
The governance of the risks of ridesharing in southeast asiaThe governance of the risks of ridesharing in southeast asia
The governance of the risks of ridesharing in southeast asiaAraz Taeihagh
 
Road Safety Audit of Balsamand Hisar Bypass Road MDR 107
Road Safety Audit of Balsamand Hisar Bypass Road MDR 107Road Safety Audit of Balsamand Hisar Bypass Road MDR 107
Road Safety Audit of Balsamand Hisar Bypass Road MDR 107ijtsrd
 
Parte 2 road safety-manual 178p_compressed
Parte 2   road safety-manual 178p_compressedParte 2   road safety-manual 178p_compressed
Parte 2 road safety-manual 178p_compressedFRANCISCOJUSTOSIERRA
 

Ähnlich wie A Vision For Transportation Safety_2016 (20)

Toolkit decade of action for road safety 2011 2020 english
Toolkit decade of action for road safety 2011 2020 englishToolkit decade of action for road safety 2011 2020 english
Toolkit decade of action for road safety 2011 2020 english
 
Vision, Strategies, Action: Guidelines for an Effective Vision Zero Action Plan
Vision, Strategies, Action: Guidelines for an Effective Vision Zero Action PlanVision, Strategies, Action: Guidelines for an Effective Vision Zero Action Plan
Vision, Strategies, Action: Guidelines for an Effective Vision Zero Action Plan
 
2017 MPO safety
2017 MPO safety2017 MPO safety
2017 MPO safety
 
Centering Safety at Metropolitan Planning Organizations
Centering Safety at Metropolitan Planning OrganizationsCentering Safety at Metropolitan Planning Organizations
Centering Safety at Metropolitan Planning Organizations
 
Global Plan for Road Safety ( 2021-2030)
Global Plan for Road Safety ( 2021-2030)Global Plan for Road Safety ( 2021-2030)
Global Plan for Road Safety ( 2021-2030)
 
Does road safety have any lessons for workplace health and safety.docx
Does road safety have any lessons for workplace health and safety.docxDoes road safety have any lessons for workplace health and safety.docx
Does road safety have any lessons for workplace health and safety.docx
 
Safety Target Coordination Report
Safety Target Coordination ReportSafety Target Coordination Report
Safety Target Coordination Report
 
The Urgency of Now
The Urgency of NowThe Urgency of Now
The Urgency of Now
 
The Urgency of Now
The Urgency of NowThe Urgency of Now
The Urgency of Now
 
Vision Zero Network Core Elements
Vision Zero Network Core ElementsVision Zero Network Core Elements
Vision Zero Network Core Elements
 
11.35 En global bild, David Ward
11.35 En global bild, David Ward11.35 En global bild, David Ward
11.35 En global bild, David Ward
 
Lessons from Road Safety
Lessons from Road Safety Lessons from Road Safety
Lessons from Road Safety
 
9 is your-road_forgiving (4)
9   is your-road_forgiving (4)9   is your-road_forgiving (4)
9 is your-road_forgiving (4)
 
IRJET - Road Accident and Emergency Management: A Data Analytics Approach
IRJET - Road Accident and Emergency Management: A Data Analytics ApproachIRJET - Road Accident and Emergency Management: A Data Analytics Approach
IRJET - Road Accident and Emergency Management: A Data Analytics Approach
 
Estudio Jessica Dennis Canada
Estudio Jessica Dennis CanadaEstudio Jessica Dennis Canada
Estudio Jessica Dennis Canada
 
12 part framework to structure safety assessment for autonomous driving
12 part framework to structure safety assessment for autonomous driving12 part framework to structure safety assessment for autonomous driving
12 part framework to structure safety assessment for autonomous driving
 
TCRP-LRD47-ULinkOCIP
TCRP-LRD47-ULinkOCIPTCRP-LRD47-ULinkOCIP
TCRP-LRD47-ULinkOCIP
 
The governance of the risks of ridesharing in southeast asia
The governance of the risks of ridesharing in southeast asiaThe governance of the risks of ridesharing in southeast asia
The governance of the risks of ridesharing in southeast asia
 
Road Safety Audit of Balsamand Hisar Bypass Road MDR 107
Road Safety Audit of Balsamand Hisar Bypass Road MDR 107Road Safety Audit of Balsamand Hisar Bypass Road MDR 107
Road Safety Audit of Balsamand Hisar Bypass Road MDR 107
 
Parte 2 road safety-manual 178p_compressed
Parte 2   road safety-manual 178p_compressedParte 2   road safety-manual 178p_compressed
Parte 2 road safety-manual 178p_compressed
 

Kürzlich hochgeladen

Global debate on climate change and occupational safety and health.
Global debate on climate change and occupational safety and health.Global debate on climate change and occupational safety and health.
Global debate on climate change and occupational safety and health.Christina Parmionova
 
Call Girls Chakan Call Me 7737669865 Budget Friendly No Advance Booking
Call Girls Chakan Call Me 7737669865 Budget Friendly No Advance BookingCall Girls Chakan Call Me 7737669865 Budget Friendly No Advance Booking
Call Girls Chakan Call Me 7737669865 Budget Friendly No Advance Bookingroncy bisnoi
 
Incident Command System xxxxxxxxxxxxxxxxxxxxxxxxx
Incident Command System xxxxxxxxxxxxxxxxxxxxxxxxxIncident Command System xxxxxxxxxxxxxxxxxxxxxxxxx
Incident Command System xxxxxxxxxxxxxxxxxxxxxxxxxPeter Miles
 
Call Girls Nanded City Call Me 7737669865 Budget Friendly No Advance Booking
Call Girls Nanded City Call Me 7737669865 Budget Friendly No Advance BookingCall Girls Nanded City Call Me 7737669865 Budget Friendly No Advance Booking
Call Girls Nanded City Call Me 7737669865 Budget Friendly No Advance Bookingroncy bisnoi
 
VIP Call Girls Bhavnagar 7001035870 Whatsapp Number, 24/07 Booking
VIP Call Girls Bhavnagar 7001035870 Whatsapp Number, 24/07 BookingVIP Call Girls Bhavnagar 7001035870 Whatsapp Number, 24/07 Booking
VIP Call Girls Bhavnagar 7001035870 Whatsapp Number, 24/07 Bookingdharasingh5698
 
Zechariah Boodey Farmstead Collaborative presentation - Humble Beginnings
Zechariah Boodey Farmstead Collaborative presentation -  Humble BeginningsZechariah Boodey Farmstead Collaborative presentation -  Humble Beginnings
Zechariah Boodey Farmstead Collaborative presentation - Humble Beginningsinfo695895
 
PPT Item # 4 - 231 Encino Ave (Significance Only)
PPT Item # 4 - 231 Encino Ave (Significance Only)PPT Item # 4 - 231 Encino Ave (Significance Only)
PPT Item # 4 - 231 Encino Ave (Significance Only)ahcitycouncil
 
The U.S. Budget and Economic Outlook (Presentation)
The U.S. Budget and Economic Outlook (Presentation)The U.S. Budget and Economic Outlook (Presentation)
The U.S. Budget and Economic Outlook (Presentation)Congressional Budget Office
 
Climate change and occupational safety and health.
Climate change and occupational safety and health.Climate change and occupational safety and health.
Climate change and occupational safety and health.Christina Parmionova
 
Get Premium Balaji Nagar Call Girls (8005736733) 24x7 Rate 15999 with A/c Roo...
Get Premium Balaji Nagar Call Girls (8005736733) 24x7 Rate 15999 with A/c Roo...Get Premium Balaji Nagar Call Girls (8005736733) 24x7 Rate 15999 with A/c Roo...
Get Premium Balaji Nagar Call Girls (8005736733) 24x7 Rate 15999 with A/c Roo...MOHANI PANDEY
 
Call On 6297143586 Viman Nagar Call Girls In All Pune 24/7 Provide Call With...
Call On 6297143586  Viman Nagar Call Girls In All Pune 24/7 Provide Call With...Call On 6297143586  Viman Nagar Call Girls In All Pune 24/7 Provide Call With...
Call On 6297143586 Viman Nagar Call Girls In All Pune 24/7 Provide Call With...tanu pandey
 
The Economic and Organised Crime Office (EOCO) has been advised by the Office...
The Economic and Organised Crime Office (EOCO) has been advised by the Office...The Economic and Organised Crime Office (EOCO) has been advised by the Office...
The Economic and Organised Crime Office (EOCO) has been advised by the Office...nservice241
 
↑VVIP celebrity ( Pune ) Serampore Call Girls 8250192130 unlimited shot and a...
↑VVIP celebrity ( Pune ) Serampore Call Girls 8250192130 unlimited shot and a...↑VVIP celebrity ( Pune ) Serampore Call Girls 8250192130 unlimited shot and a...
↑VVIP celebrity ( Pune ) Serampore Call Girls 8250192130 unlimited shot and a...ranjana rawat
 
Expressive clarity oral presentation.pptx
Expressive clarity oral presentation.pptxExpressive clarity oral presentation.pptx
Expressive clarity oral presentation.pptxtsionhagos36
 
Call Girls Sangamwadi Call Me 7737669865 Budget Friendly No Advance Booking
Call Girls Sangamwadi Call Me 7737669865 Budget Friendly No Advance BookingCall Girls Sangamwadi Call Me 7737669865 Budget Friendly No Advance Booking
Call Girls Sangamwadi Call Me 7737669865 Budget Friendly No Advance Bookingroncy bisnoi
 
The Most Attractive Pune Call Girls Handewadi Road 8250192130 Will You Miss T...
The Most Attractive Pune Call Girls Handewadi Road 8250192130 Will You Miss T...The Most Attractive Pune Call Girls Handewadi Road 8250192130 Will You Miss T...
The Most Attractive Pune Call Girls Handewadi Road 8250192130 Will You Miss T...ranjana rawat
 
Call On 6297143586 Yerwada Call Girls In All Pune 24/7 Provide Call With Bes...
Call On 6297143586  Yerwada Call Girls In All Pune 24/7 Provide Call With Bes...Call On 6297143586  Yerwada Call Girls In All Pune 24/7 Provide Call With Bes...
Call On 6297143586 Yerwada Call Girls In All Pune 24/7 Provide Call With Bes...tanu pandey
 
Election 2024 Presiding Duty Keypoints_01.pdf
Election 2024 Presiding Duty Keypoints_01.pdfElection 2024 Presiding Duty Keypoints_01.pdf
Election 2024 Presiding Duty Keypoints_01.pdfSamirsinh Parmar
 
VIP Call Girl Service Ludhiana 7001035870 Enjoy Call Girls With Our Escorts
VIP Call Girl Service Ludhiana 7001035870 Enjoy Call Girls With Our EscortsVIP Call Girl Service Ludhiana 7001035870 Enjoy Call Girls With Our Escorts
VIP Call Girl Service Ludhiana 7001035870 Enjoy Call Girls With Our Escortssonatiwari757
 

Kürzlich hochgeladen (20)

Global debate on climate change and occupational safety and health.
Global debate on climate change and occupational safety and health.Global debate on climate change and occupational safety and health.
Global debate on climate change and occupational safety and health.
 
Call Girls Chakan Call Me 7737669865 Budget Friendly No Advance Booking
Call Girls Chakan Call Me 7737669865 Budget Friendly No Advance BookingCall Girls Chakan Call Me 7737669865 Budget Friendly No Advance Booking
Call Girls Chakan Call Me 7737669865 Budget Friendly No Advance Booking
 
Incident Command System xxxxxxxxxxxxxxxxxxxxxxxxx
Incident Command System xxxxxxxxxxxxxxxxxxxxxxxxxIncident Command System xxxxxxxxxxxxxxxxxxxxxxxxx
Incident Command System xxxxxxxxxxxxxxxxxxxxxxxxx
 
Call Girls Nanded City Call Me 7737669865 Budget Friendly No Advance Booking
Call Girls Nanded City Call Me 7737669865 Budget Friendly No Advance BookingCall Girls Nanded City Call Me 7737669865 Budget Friendly No Advance Booking
Call Girls Nanded City Call Me 7737669865 Budget Friendly No Advance Booking
 
VIP Call Girls Bhavnagar 7001035870 Whatsapp Number, 24/07 Booking
VIP Call Girls Bhavnagar 7001035870 Whatsapp Number, 24/07 BookingVIP Call Girls Bhavnagar 7001035870 Whatsapp Number, 24/07 Booking
VIP Call Girls Bhavnagar 7001035870 Whatsapp Number, 24/07 Booking
 
Zechariah Boodey Farmstead Collaborative presentation - Humble Beginnings
Zechariah Boodey Farmstead Collaborative presentation -  Humble BeginningsZechariah Boodey Farmstead Collaborative presentation -  Humble Beginnings
Zechariah Boodey Farmstead Collaborative presentation - Humble Beginnings
 
PPT Item # 4 - 231 Encino Ave (Significance Only)
PPT Item # 4 - 231 Encino Ave (Significance Only)PPT Item # 4 - 231 Encino Ave (Significance Only)
PPT Item # 4 - 231 Encino Ave (Significance Only)
 
The U.S. Budget and Economic Outlook (Presentation)
The U.S. Budget and Economic Outlook (Presentation)The U.S. Budget and Economic Outlook (Presentation)
The U.S. Budget and Economic Outlook (Presentation)
 
Climate change and occupational safety and health.
Climate change and occupational safety and health.Climate change and occupational safety and health.
Climate change and occupational safety and health.
 
Get Premium Balaji Nagar Call Girls (8005736733) 24x7 Rate 15999 with A/c Roo...
Get Premium Balaji Nagar Call Girls (8005736733) 24x7 Rate 15999 with A/c Roo...Get Premium Balaji Nagar Call Girls (8005736733) 24x7 Rate 15999 with A/c Roo...
Get Premium Balaji Nagar Call Girls (8005736733) 24x7 Rate 15999 with A/c Roo...
 
Call On 6297143586 Viman Nagar Call Girls In All Pune 24/7 Provide Call With...
Call On 6297143586  Viman Nagar Call Girls In All Pune 24/7 Provide Call With...Call On 6297143586  Viman Nagar Call Girls In All Pune 24/7 Provide Call With...
Call On 6297143586 Viman Nagar Call Girls In All Pune 24/7 Provide Call With...
 
The Economic and Organised Crime Office (EOCO) has been advised by the Office...
The Economic and Organised Crime Office (EOCO) has been advised by the Office...The Economic and Organised Crime Office (EOCO) has been advised by the Office...
The Economic and Organised Crime Office (EOCO) has been advised by the Office...
 
Rohini Sector 37 Call Girls Delhi 9999965857 @Sabina Saikh No Advance
Rohini Sector 37 Call Girls Delhi 9999965857 @Sabina Saikh No AdvanceRohini Sector 37 Call Girls Delhi 9999965857 @Sabina Saikh No Advance
Rohini Sector 37 Call Girls Delhi 9999965857 @Sabina Saikh No Advance
 
↑VVIP celebrity ( Pune ) Serampore Call Girls 8250192130 unlimited shot and a...
↑VVIP celebrity ( Pune ) Serampore Call Girls 8250192130 unlimited shot and a...↑VVIP celebrity ( Pune ) Serampore Call Girls 8250192130 unlimited shot and a...
↑VVIP celebrity ( Pune ) Serampore Call Girls 8250192130 unlimited shot and a...
 
Expressive clarity oral presentation.pptx
Expressive clarity oral presentation.pptxExpressive clarity oral presentation.pptx
Expressive clarity oral presentation.pptx
 
Call Girls Sangamwadi Call Me 7737669865 Budget Friendly No Advance Booking
Call Girls Sangamwadi Call Me 7737669865 Budget Friendly No Advance BookingCall Girls Sangamwadi Call Me 7737669865 Budget Friendly No Advance Booking
Call Girls Sangamwadi Call Me 7737669865 Budget Friendly No Advance Booking
 
The Most Attractive Pune Call Girls Handewadi Road 8250192130 Will You Miss T...
The Most Attractive Pune Call Girls Handewadi Road 8250192130 Will You Miss T...The Most Attractive Pune Call Girls Handewadi Road 8250192130 Will You Miss T...
The Most Attractive Pune Call Girls Handewadi Road 8250192130 Will You Miss T...
 
Call On 6297143586 Yerwada Call Girls In All Pune 24/7 Provide Call With Bes...
Call On 6297143586  Yerwada Call Girls In All Pune 24/7 Provide Call With Bes...Call On 6297143586  Yerwada Call Girls In All Pune 24/7 Provide Call With Bes...
Call On 6297143586 Yerwada Call Girls In All Pune 24/7 Provide Call With Bes...
 
Election 2024 Presiding Duty Keypoints_01.pdf
Election 2024 Presiding Duty Keypoints_01.pdfElection 2024 Presiding Duty Keypoints_01.pdf
Election 2024 Presiding Duty Keypoints_01.pdf
 
VIP Call Girl Service Ludhiana 7001035870 Enjoy Call Girls With Our Escorts
VIP Call Girl Service Ludhiana 7001035870 Enjoy Call Girls With Our EscortsVIP Call Girl Service Ludhiana 7001035870 Enjoy Call Girls With Our Escorts
VIP Call Girl Service Ludhiana 7001035870 Enjoy Call Girls With Our Escorts
 

A Vision For Transportation Safety_2016

  • 1. 72 Transportation Research Record: Journal of the Transportation Research Board, No. 2582, Transportation Research Board, Washington, D.C., 2016, pp. 72–86. DOI: 10.3141/2582-09 The Traffic Safety Best Practices Matrix is presented. It is a tool to help U.S. cities to identify the landscape of strategies being used domestically and internationally to advance Vision Zero, as pioneered by Sweden. Many cities across the United States have expressed an interest in Vision Zero, with a growing number passing policies calling for the elimination of traffic-related fatalities over the next decade. Despite the increase in interest, little guidance exists around what Vision Zero is and what actions can be implemented to help realize zero deaths. The matrix culls together the results of an extensive examination of the measures that cities and countries are pursuing to reduce traffic-related fatalities and improve safety. The matrix attempts to bridge the gap by presenting a framework that cities can use to identify effective strategies, bench- mark their efforts relative to other jurisdictions, and reach out to cities and countries pursing Vision Zero policies for additional information. An analysis of the matrix, focuses on three categories: measures with widespread adoption, limited implementation, and minimal utilization. There is discussion of how these findings can inform the next steps for Vision Zero implementation, with a focus on implications for U.S. cities. The main recommendations are to develop mechanisms that institution- alize Vision Zero across sectors, focus education on supporting changes in organizational practices and policy reform, improve collaboration across all levels of government, explore technology that meets the unique needs of cities, and create data systems that facilitate accountability and encourage public participation. Vision Zero is a road safety policy that aims to achieve a transpor- tation system in which there are zero fatalities or serious injuries for all modes of transportation. Adopted by Sweden in 1997, the safety platform attempts to create a safe system by taking an ethi- cal approach to road safety (1). Vision Zero is widely accepted as an innovative road safety policy and is noted for its departure from the traditional road safety paradigm with regard to its charge that the road safety problem to be addressed is the shortcomings in the design of the transportation system, assertion that transportation system designers are responsible for road safety, call for road users to demand safety, and insistence that the ultimate objective of road safety is zero deaths (2). Many cities across the United States have expressed an interest in Vision Zero. As of July 2015, the following cities have passed a Vision Zero policy, calling for the elimination of traffic-related fatalities and in some cases serious injuries over the next 10 years: San Francisco, San Jose, San Mateo, and San Diego, California; Seattle,Washington; Portland, Oregon; NewYork City;Washington, D.C.; and Boston, Massachusetts. Despite the increase in interest, little guidance exists for local transportation planners, policy makers, public health practitioners, police, and others working as part of this effort around what Vision Zero is and what actions could be imple- mented to help realize zero deaths. This paper aims to bridge that gap by presenting a tool, the Traffic Safety Best Practices Matrix, to help cities identify the landscape of strategies being used domesti- cally and internationally to advance Vision Zero. The matrix culls together the results of an extensive examination of the measures that cities and countries are pursuing to reduce traffic-related fatalities and serious injuries. Byidentifyingthelandscapeofstrategiesbeingusedbycitiespursu- ing Vision Zero, and specifying strategy efficacy as currently known, the matrix presents a framework for strategy identification and evalu- ation, as well as opportunity benchmarking. Analysis of the matrix focuses on three categories: measures with (a) widespread adoption, (b) limited implementation, and (c) minimal utilization. Also, the research offers findings that can inform next steps for Vision Zero implementation. While the potential for Vision Zero to reduce fatali- ties and serious injuries is significant based on Sweden’s experience (3), there is currently a knowledge gap with respect to specific imple- mentation measures utilized to advance the policy. It is anticipated that the matrix, in addition to the analysis presented in this paper, will help cities, especially those considering adopting the policy, to develop comprehensive strategies, benchmark their efforts, and reach out to other jurisdictions pursing Vision Zero for additional information. CALL FOR SAFE SYSTEM APPROACH TO SAFETY: WHAT IS VISION ZERO? Vision Zero is based on two premises: people make mistakes, and there is a critical limit beyond which survival and recovery from an injury are not possible (4). Vision Zero does not assume that collisions will not happen—people make mistakes no matter how well-educated and compliant in obeying traffic laws (5). Rather, the focus for road safety analysis and planning is on eliminating the risk of chronic health impairment or death caused by a collision (4). To do so, Vision Zero focuses on decreasing the likelihood that crashes will result in serious injury or death by designing the transportation system in a way that ensures that road users can tolerate the kinetic energies produced by the collision. It is kinetic energy that kills and injures the road user—not the collision. The level of physical force the human body can tolerate thus forms the basic parameter in the A Vision for Transportation Safety Framework for Identifying Best Practice Strategies to Advance Vision Zero Arielle Fleisher, Megan L. Wier, and Mari Hunter A. Fleisher and M. Hunter, San Francisco Municipal Transportation Agency, 1 South Van Ness Avenue, San Francisco, CA 94103. M.L. Wier, San Francisco Department of Public Health, 1390 Market Street, Suite 210, San Francisco, CA 94102. Corresponding author: A. Fleisher, arielle.fleisher@sfmta.com.
  • 2. Fleisher, Wier, and Hunter 73 design of the transportation system, the core around which all safety interventions are to be based (4, 6). One of the main implications of this is that traffic speeds should be reduced to prevent injuries (7). If the impact of crash energy is to be kept below the critical limit, speeds must lowered and set according to the safety of the road and roadside (4). Vulnerable road users, including pedestrians, have a 10% chance of surviving if hit by vehicles traveling at speeds above 45 mph, but this level rises to 90% at speeds of 17 mph (8). Speed management underpins nearly every consideration in Vision Zero (5). While Vision Zero places a strong emphasis on reducing speeds, it does so in the context of the road system in its entirety—referred to as a safe system approach to road safety (4, 5). The approach encour- ages countermeasures that address the three key elements of the road system—roads and roadsides, vehicles and speed—because the interaction of these elements determines physical force and thus trauma levels in a crash (4). Considering the inputs in isolation ignores the power of their interactions. To prevent collisions, the whole system must be considered and all its parts strengthened (5): If one part fails, the other parts must be able to offer protection. Core activities are supported by a range of countermeasures (such as education, regulation, and enforcement) that encourage alert and compliant behavior on the part of road users (9). Vision Zero alters the view on responsibility for road safety. In the United States, responsibility has been placed on the individual road user: bad drivers, careless bicyclists, and distracted pedestrians are the causes of collisions; perfecting human behaviors through licensing, testing, education, training, and publicity are the appro- priate solutions (6, 7). Under the Vision Zero framework, actions and responsibilities are attributed to the system designers who include engineers, public health professionals, policy makers, and law enforcement (4, 10). It remains the responsibility of individuals to abide by laws and regulations, that is, to follow the rules for using the transportation system set by the system designers. If fatalities do still occur, or if the rules are not followed, the burden is placed back on the system designers to take further measures (1). Although Vision Zero is closely associated with Sweden’s efforts, the safe system approach on which it is based has also provided the foundation for Netherland’s Sustainable Safety policy, as well as the safety platforms of Australia, New Zealand, Denmark, Iceland, Norway, and London (5). Vision Zero and Sustainable Safety repre- sent the longest and most well-established safe system approaches (9). In the United States, state governments are required to develop strategic highway safety plans that detail the state’s approach to reducing traffic injuries. Since the early 2000s, many states have framed this work as Toward Zero Deaths (TZD), an approach that traces its roots Vision Zero (11). In 2014, FHWA published Toward Zero Deaths: A National Strategy for Highway Safety, which similarly frames safety as a systems approach (12). METHODS To provide guidance for U.S. cities as they seek to implement Vision Zero, research was conducted into the measures that cities in the United States and cities and countries abroad, are, as of May 2015, pursuing to reduce pedestrian-, bicycle-, or traffic-related injuries and fatalities. Those data are compiled into the Traffic Safety Best Practices Matrix. The safety strategies of eight U.S. cities, one European city, and three countries were reviewed for the matrix: San Francisco; New York City; Chicago, Illinois; Portland; Seattle; Washington, D.C.; Boston; Los Angeles, California; London; Sweden; the Netherlands; and Australia. The U.S. cities included in the matrix were the early adopters or early considerers of Vision Zero, either by cities or departments of transportation. Sweden and the Netherlands are international leaders in road safety.Australia was selected because it was one of the first countries to follow Sweden in adopting the safe system approach; London was selected because it is a large city that also subscribes to a systems approach to road safety (9, 13). These locations were also selected because information about their safety platforms is widely available online and in English. While Norway, Finland, Iceland, and Denmark have all adopted Vision Zero or Vision Zero–like policies, these countries were not included in the review because their safety documents were not readily available (5). The matrix is divided into nine categories: 1. Supportive infrastructure and planning; 2. Engineering; 3. Education; 4. Enforcement; 5. Monitoring, analysis, and evaluation; 6. Policy; 7. Large vehicles; 8. Vehicle technology; and 9. Taxi services and transportation network company. Countries and cities received a √ (i.e., checkmark) for a measure if it was referred to in one of their safety documents, defined as their city’s safety resource webpage, safety action plan, or bicycle or pedestrian strategy, as either in practice or as a priority/planned/ in process. Cities and countries received an NA (not applicable) for measures if implementation was not feasible. For example, New York City received an NA for “Align state level Towards Zero Death efforts with local level Vision Zero policy” (6.9) because its state did not adopt the TZD approach. A total of 106 measures are included in the matrix. There is no hierarchy to the matrix; rather, measures are listed alphabetically within subsections. The matrix is not exhaustive but attempts to provide a full scope of the safety mea- sures being used by cities and countries. Matrix review did not take into account prioritization of the measures, scale of implementation (e.g., one intersection versus routine strategic implementation) or funding. The matrix also includes a category that indicates the efficacy of a measure, defined as capacity to reduce injury, both directly (i.e., collision reduction factor) or indirectly (i.e., through creation of the institutions, structures, and political will that drive or create frame- works for changes in system design). Measures were given a designa- tion of proven (P), recommended (R), or unknown (U), as described in Table 1. This methodology was used by Washington State in its 2013 Washington State Strategic Highway Safety Plan (14), which is a target zero plan. This plan was chosen as the model of the cur- rent research not only because of the rigor it applied to the efficacy assessments, but also because consistency in efficacy methodol- ogy among plans related to Vision Zero was felt to be a potential strength. As in Washington State, the researchers relied on three main sources to make the designations; if an action was not found in one of these primary sources, the researchers surveyed the academic literature as well as other countermeasure reference documents. For supplemental sources, designations were given based on the out- comes, quality, and breadth of the evaluation. A list of these sources can be found in Table 2.
  • 3. 74 Transportation Research Record 2582 TABLE 1 Efficacy Definitions and Criteria (14, p. 168) Strategy Effectiveness Definition Countermeasures That Work (CTW) NCHRP Report 500 Crash Modification Factors (CMF) Clearinghouse Proven (P) Proven to be effective based on several evalu- ations with consistent results ***** Demonstrated to be effective by several high- quality evaluations with consistent results Proven (P). Those strategies that have been used in one or more locations and for which properly designed evaluations have been conducted that show them to be effective. ***** = 14 quality points Recommended (R) Generally accepted to be effective based on evaluations or other sources **** Demonstrated to be effective in certain situations or *** Likely to be effective based on balance of evidence from high-quality evaluations or other sources Tried (T). Those strategies that have been implemented in many locations, and may even be accepted as standards or standard approaches, but for which there have not been found valid evaluations. **** = 11–13 quality points *** = 7–10 quality points Unknown (U) Lower quality rating; limited evaluation or evidence; experimental; outcomes inconsis- tent and inconclusive between studies ** Effectiveness still undeter- mined; different methods of implementing this counter- measure produce different results or *Limited or no high-quality evaluation evidence Experimental (E). Those strate- gies represent ideas that have been suggested, with at least one agency considering them sufficiently promising to try them as an experiment in at least one location. ** = 3–6 quality points TABLE 2 Matrix Sources Document Link San Francisco San Francisco Pedestrian Strategy http://archives.sfmta.com/cms/rpedmast/documents/1-29-13PedestrianStrategy.pdf SFMTA Bicycle Strategy https://www.sfmta.com/sites/default/files/BicycleStrategyFinal_0.pdf Vision Zero San Francisco: two-year action strategy http://visionzerosf.org/about/two-year-action-strategy/ Walk First http://walkfirst.sfplanning.org/ New York Vision Zero Action Plan http://www.nyc.gov/html/visionzero/pdf/nyc-vision-zero-action-plan.pdf NYC Pedestrian Safety Study and Action Plan http://www.nyc.gov/html/dot/downloads/pdf/nyc_ped_safety_study_action_plan.pdf Truck Side Guards http://www.nyc.gov/html/dcas/downloads/pdf/fleet/nyc_fleet_newsletter_05_16_2014 .pdf; http://www.volpe.dot.gov/news/engineers-passion-pedestrian-and-bike-safety -leads-partnership-with-nyc Chicago Chicago Forward: Department of Transportation Action Agenda http://www.cityofchicago.org/dam/city/depts/cdot/Admin/ChicagoForwardCDOT ActionAgenda.pdf Chicago Forward: Department of Transportation Action Agenda 2013 Update http://www.cityofchicago.org/content/dam/city/depts/cdot/ChicagoForward /ChicagoForwardUpdate2013_web-lo.pdf Chicago Pedestrian Plan http://chicagopedestrianplan.org/pedestrian-plan/ Chicago Streets for Cycling Plan 2020 http://www.cityofchicago.org/content/dam/city/depts/cdot/bike/general /ChicagoStreetsforCycling2020.pdf Portland Portland Bicycle Plan for 2030 http://www.portlandoregon.gov/transportation/article/289122 Portland Bicycle Plan for 2030: One-Year Progress Report http://www.portlandoregon.gov/transportation/article/345419 Real Solutions to Traffic Safety Problems https://www.portlandoregon.gov/transportation/article/299189 Traffic Safety Resources https://www.portlandoregon.gov/transportation/55303 Vision Zero https://www.portlandoregon.gov/transportation/article/518952 Seattle 2012 Action Agenda: Laying the Groundwork http://www.seattle.gov/transportation/docs/SDOTActionAgenda2812.pdf Action Agenda: 2013 Progress Report http://www.seattle.gov/transportation/docs/SDOTActionAgendatProgRep_2013-01.pdf Pedestrian Master Plan: Implementation Overview http://www.seattle.gov/transportation/pedestrian_masterplan/pmp_implementation.htm Vision Zero: Seattle’s Plan to End Traffic Deaths and Serious Injuries by 2030 http://www.seattle.gov/visionzero (continued)
  • 4. Fleisher, Wier, and Hunter 75 TABLE 2 (continued) Matrix Sources Document Link Washington, D.C. District DOT: Safety Programs Overview http://ddot.dc.gov/page/safety-programs District of Columbia Bicycle Master Plan http://ddot.dc.gov/sites/default/files/dc/sites/ddot/publication/attachments /bicycle_master_plan_2005_final_document_0.pdf District of Columbia Pedestrian Master Plan http://ddot.dc.gov/sites/default/files/dc/sites/ddot/publication/attachments /pedestrianmasterplan_2009.pdf District of Columbia Strategic Highway Safety Plan http://www.ddot-hso.com/ddot/hso/documents/Publications/SHSP/2014/DDOT%20 SHSP%20-%20October%202014.pdf Toward Zero Deaths website http://www.towardzerodeathsdc.com/ Boston Access Boston 2000–2010: Boston’s Citywide Transportation Plan http://www.cityofboston.gov/transportation/accessboston/default.asp Boston Bicycle Plan http://www.cityofboston.gov/transportation/accessboston/pdfs/bicycle_plan.pdf Boston Bike Network Plan http://www.cityofboston.gov/images_documents/Boston%20Bike%20Network%20 Plan%2C%20Fall%202013_FINAL_tcm3-40525.pdf Boston Bikes http://www.cityofboston.gov/bikes/ Boston Cyclist Safety Report http://www.cityofboston.gov/images_documents/Crash%20Report%202013%20 FINAL%20reduced%202_tcm3-38304.pdf City of Boston–Transportation http://www.cityofboston.gov/transportation/ Pedestrian Safety Guidelines For Residential Streets http://www.cityofboston.gov/transportation/accessboston/pdfs/pedestrian_safety _guidelines.pdf Update on Safety Efforts in Boston http://www.bostonglobe.com/metro/2013/03/18/boston-launches-traffic-safety-initiative -along-busy-commonwealth-ave/rpIzq1bJTz8LuxvALlu0UJ/story.html Los Angeles 2010 Bicycle Plan http://planning.lacity.org/cwd/gnlpln/transelt/NewBikePlan/Txt/LA%20CITY%20 BICYCLE%20PLAN.pdf Greater Streets for Los Angeles Strategic Plan http://www.smartgrowthamerica.org/documents/cs/impl/ca-losangeles-dot-strategicplan 2014.pdf LA DOT Bicycle Services http://bicyclela.org/ LA DOT Safety http://www.ladot.lacity.org/WhatWeDo/Safety/index.htm Traffic Study Policies and Procedures http://ladot.lacity.org/stellent/groups/departments/@ladot_contributor/documents /contributor_web_content/lacityp_026875.pdf Watch the Road http://www.watchtheroad.org/ Sweden Achieving Traffic Safety Goals in the United States: Lessons from Other Nations http://onlinepubs.trb.org/onlinepubs/sr/sr300.pdf An Independent Review of Road Safety in Sweden http://publikationswebbutik.vv.se/upload/4314/2008_109_an_independent_review_of _road_safety_in_sweden.pdf International Transport Forum: Road Safety Annual Report 2014 http://www.internationaltransportforum.org/pub/pdf/14IrtadReport.pdf Management by Objectives for Road Safety Work Stakeholder Collaboration Towards New Interim Targets 2020 http://publikationswebbutik.vv.se/upload/4253/89217_management_by_objectives_for _road_safety_work_stakeholder_collaboration_towards_new_interim_targets_2020 _summary.pdf Urban Mobility Strategy http://international.stockholm.se/globalassets/ovriga-bilder-och-filer/urban-mobility -strategy.pdf The Netherlands Advancing Sustainable Safety: National Road Safety Outlook for 2005–2020 http://www.swov.nl/rapport/dmdv/Advancing_sustainable_safety.pdf Cycling in the Netherlands http://www.fietsberaad.nl/library/repository/bestanden/CyclingintheNetherlands 2009.pdf International Transport Forum: Road Safety Annual Report 2014 http://www.internationaltransportforum.org/pub/pdf/14IrtadReport.pdf Road Safety Strategic Plan: 2008–2020 http://www.fietsberaad.nl/library/repository/bestanden/5a_Philippens_ICSC2012.pdf Signalized Intersection Safety in Europe http://international.fhwa.dot.gov/pubs/pl03020/pl03020.pdf Sustainable Safety http://www.fietsberaad.nl/index.cfm?lang=en&section=kennisbank&mode=list&kennis bankPage=Categorisering+en+fietsen+in+verblijfsgebieden (continued on next page)
  • 5. 76 Transportation Research Record 2582 London Intelligent Pedestrian Technology http://www.tfl.gov.uk/info-for/media/press-releases/2014/march/tfl-to-launch-worldleading -trials-of-intelligent-pedestrian-technology-to-make-crossing-the-road-easier-and-safer The Mayor’s Vision for Cycling in London http://www.tfl.gov.uk/cdn/static/cms/documents/gla-mayors-cycle-vision-2013.pdf Lorry Drivers Have No More Excuses When It Comes to Cycling Blind Spots http://www.theguardian.com/environment/green-living-blog/2010/aug/02/hgv-lorries -cycling-campaign Pedestrian Safety Action Plan http://www.tfl.gov.uk/cdn/static/cms/documents/pedestrian-safety-action-plan.pdf Plans for New Out-of-Hours Delivery Trials http://www.tfl.gov.uk/info-for/media/news-articles/plans-for-new-outofhours-delivery -trials Puffin Crossing Study http://www.trl.co.uk/reports-publications/trl-reports/traffic-management /report/?reportid=6680 Safe Streets for London: The Road Safety Action Plan for London 2020 https://www.tfl.gov.uk/cdn/static/cms/documents/safe-streets-for-london.pdf Safer Lorries Scheme http://www.tfl.gov.uk/info-for/media/press-releases/2014/july/safer-lorries-scheme -consultation Trial of Roadside Safety Mirrors for Cycle Visibility https://www.tfl.gov.uk/cdn/static/cms/documents/trial-of-roadside-safety-mirrors-for -cycle-visibility-report.pdf Supplemental Efficacy Sources Section 1. Supportive infrastructure and Planning 1.1 Safety Action Plan (Vision Zero) and Strategy Health in All Policies: A Guide for State and Local Governments Rudolph et al. (22) Health in All Policies: Taking Stock of Emerging Practices to Incorporate Health in Decision Making in the United States Gase, L.N., R. Pennotti, and K.D. Smith. Health in All Policies: Taking Stock of Emerging Practices to Incorporate Health in Decision Making in the United States. Journal of Public Health Management and Practice, Vol. 19, No. 6, 2013, pp. 529–540. 1.2 Vision Zero Policy (or Vision Zero–like policy) Towards Zero: Ambitious Road Safety Targets and the Safe System Approach Organisation for Economic Co-operation and Development/International Transportation Forum. Towards Zero: Ambitious Road Safety Targets and the Safe System Approach. OECD Publishing, Paris, 2008. The Vision Thing: Actors, Decision-Making, and Lock-In Effects in Swedish Road Safety Policy Since the 1990s Andersson, F., and T. Pettersson. The Vision Thing: Actors, Decision Making, and Lock-In Effects in Swedish Road Safety Policy Since the 1990s. Umeå, Sweden, Umeå Universitetet, 2008. 1.3 Vision Zero Steering Committee Governance Tools and Framework for Heath in All Policies St-Pierre, L. Governance Tools and Framework for Heath in All Policies. National Collaborating Centre for Healthy Public Policy. http://www.ci.richmond.ca.us /DocumentCenter/Home/View/9047. Section 2. Engineering 2.1a Informative signage: advisory or cautionary signs (e.g., “State law: stop for pedestrians”; “high bicycle activity zone”) Evaluation of Pedestrian-Related Roadway Measures: A Summary of Available Research Mead, J., C. Zegeer, and M. Bushell. Evaluation of Pedestrian-Related Roadway Measures: A Summary of Available Research. Pedestrian and Bicycle Information Center, Chapel Hill, N.C., April 2013. 2.1b Informative signage: dynamic message signs with safety messaging Effectiveness of Safety and Public Service Announcement Messages on Dynamic Message Signs Federal Highway Administration. Effectiveness of Safety and Public Service Announce- ment Messages on Dynamic Message Signs. Publication FHWA-HOP-14-015. FHWA, U.S. Department of Transportation, 2014. 2.2 Perform engineering reviews at all traffic fatality and high collision locations and at scenes of crashes Highway Safety Improvement Program Manual Federal Highway Administration. Highway Safety Improvement Program Manual. Publication FHWA-SA-09-029. FHWA, U.S. Department of Transportation, 2010. Road Safety as a Shared Responsibility and a Public Problem in Swedish Road Safety Policy McAndrews (7). Presentation at Workshop on Independent and Transparent Accident Investigation Recommendations Bergfalk, L. Presentation at Workshop on Independent and Transparent Accident Investigation Recommendations, Brussels, 2007. http://erso.swov.nl/safetynet/fixed /WP4/Workshop_3_2007/sn_wp4_Brussels_WSguest4_SwedishTrafficInspectorate _LB.pdf. 2.3b Restrictions on street access: restrict car access in the city center Green Light for Midtown Evaluation Report http://www.nyc.gov/html/dot/downloads/pdf/broadway_report_final2010_web.pdf Vehicle Restrictions: Limiting Automobile Travel at Certain Times and Places http://www.vtpi.org/tdm/tdm33.htm. TABLE 2 (continued) Matrix Sources Document Link (continued)
  • 6. Fleisher, Wier, and Hunter 77 2.4 Shared-space area for cars, bicyclists, and pedestrians Lesson 20: Traffic Calming U.S. Department of Transportation. Lesson 20: Traffic Calming. July 2006. http://www .fhwa.dot.gov/publications/research/safety/pedbike/05085/pdf/lesson20lo.pdf. 2.5b Signal hardware additions: pedestrian countdown signal 2.8h Road design and maintenance: restrict parking near intersections (aka “daylighting”) Toolbox of Countermeasures and Their Potential Effectiveness for Pedestrian Crashes Federal Highway Administration (17). 2.7b Slow zone: senior slow/safety zones 2.7c Slow zones around schools/local streets Safe Streets for Seniors http://www.nyc.gov/html/dot/html/pedestrians/safeseniors.shtml. Neighborhood Slow Zones http://www.nyc.gov/html/dot/html/motorist/slowzones.shtml. Slow Zones: Their Impact on Mode Choices and Travel Behaviour O’Fallon, C., and C. Sullivan. Slow Zones: Their Impact on Mode Choices and Travel Behaviour. Research Report 438, NZ Transport Agency, 2011. 2.8a Road design and maintenance: Advance stop or yield lines 2.8c Road design and maintenance: high visibility crosswalk Achieving Vision Zero: A Data-Driven Investment Strategy for Eliminating Pedestrian Fatalities on a Citywide Level Kronenberg, C., L. Woodard, B. DuBose, and D. Weissman. Achieving Vision Zero: Data- Driven Investment Strategy to Eliminate Pedestrian Fatalities on a Citywide Level. In Transportation Research Record: Journal of the Transportation Research Board, No. 2519, Transportation Research Board, Washington D.C., 2015, pp. 146–156. 2.8b Road design and maintenance: enhanced sharrow marking Evaluation of Bicycle-Related Roadway Measures: A Summary of Available Research Mead, J., A. McGrane, C. Zegeer, and L. Thomas. Evaluation of Bicycle-Related Road- way Measures: A Summary of Available Research. Pedestrian and Bicycle Information Center, Chapel Hill, N.C., February 2014. Section 3. Education 3.2 Educate state level organizations on city actions and Vision Zero commitments to broaden understanding of Vision Zero’s impact on pedestrian/bike/traffic fatalities and injuries Road Safety as a Shared Responsibility and a Public Problem in Swedish Road Safety Policy McAndrews (7). Health In All Policies: A Guide for State and Local Governments Rudolph et al. (22). 3.3 Engage with community-based organizations and advocates Health in All Policies: A Guide For State and Local Governments Rudolph et al. (22). 3.10 Training for senior citizens on walking and biking Safe Routes for Seniors: Improving Walkability for Seniors in New York City Shin-pei, T. Safe Routes for Seniors: Improving Walkability for Seniors in New York City. http://activelivingresearch.org/safe-routes-seniors-improving-walkability-seniors-new -york-city. Evaluation of the Walkable Neighborhoods for Seniors Project in Sacramento County Hooker, S.P., L.A. Cirill, and A. Geraghty. Evaluation of the Walkable Neighborhoods for Seniors Project in Sacramento County. Health Promotion Practice, Vol. 10, No. 3, 2011, pp. 402–410. Section 4. Enforcement 4.1e Automated enforcement: point to point camera Effects of Average Speed Enforcement on Speed Compliance and Crashes: A Review of the Literature Soole, D.W., B.C. Watson, and J.J. Fleiter. Effects of Average Speed Enforcement on Speed Compliance and Crashes: A Review of the Literature. Accident Analysis and Prevention, Vol. 51, 2013, pp. 46–56. Austroads Research Report: Point to Point Speed Enforcement Soole, D.W., J. Fleiter, and B. Watson. Austroads Research Report: Point to Point Speed Enforcement. Publication AP-R415-12. Centre of Accident Research and Road Safety, Sydney, New South Wales, Australia, 2012. 4.2 Convene regular meetings of transportation leaders and the police department to review traffic safety performance and determine strategies for improvement Road Safety in the Context of Urban Development in Sweden and California McAndrews, C. Road Safety in the Context of Urban Development in Sweden and California. University of California, Berkeley, City and Regional Planning, 2010. Country Guidelines for the Conduct of Road Safety Management Capacity Reviews and the Specification of Lead Agency Reforms Bliss, T., and J. Breen. Country Guidelines for the Conduct of Road Safety Management Capacity Reviews and the Specification of Lead Agency Reforms. World Bank Global Road Safety Facility, Washington, D.C., 2009. 4.6 Investigate crashes that result in fatalities as well as crashes that result in critical injuries Independent Review of Road Safety in Sweden Breen, J., E. Howard, and T. Bliss. Independent Review of Road Safety in Sweden, 2008. Presentation at Workshop on Independent and Transparent Accident Investigation Recommendations Bergfalk, L. Presentation at Workshop on Independent and Transparent Accident Investi- gation Recommendations, Brussels, 2007. http://erso.swov.nl/safetynet/fixed/WP4 /Workshop_3_2007/sn_wp4_Brussels_WSguest4_SwedishTrafficInspectorate_LB.pdf. TABLE 2 (continued) Matrix Sources Document Link (continued on next page)
  • 7. 78 Transportation Research Record 2582 4.7 Random breath testing A National Examination of Random Breath Testing and Alcohol-Related Traffic Crash Rates Ferris, J., L. Mazerolle, M. King, L. Bates, S. Bennett, and M. Devaney. Random Breath Testing in Queensland and Western Australia: Examination of How the Random Breath Testing Rate Influences Alcohol Related Traffic Crash Rates. Accident Analysis and Prevention, Vol. 60, 2013, pp. 181–188. Random Breath Testing: A Canadian Perspective Solomon, R., E. Chamberlain, M. Abdoullaeva, and B. Tinholt. Random Breath Testing: A Canadian Perspective. Traffic Injury Prevention, Vol. 12, No. 2, 2011, pp. 111–119. 4.8 Update technology that assists with capturing crash data and/or speed detection Data Systems: A Road Safety Manual for Decision- Makers and Practitioners World Health Organization. Data Systems: A Road Safety Manual for Decision-Makers and Practitioners, 2010. http://apps.who.int/iris/bitstream/10665/44256/1 /9789241598965_eng.pdf. Section 5. Monitoring, analysis, and evaluation 5.1 Comparative data system linking social and environment factors with injury data 5.6 Publish citywide collision report Data Systems: A Road Safety Manual for Decision- Makers and Practitioners World Health Organization. Data Systems: A Road Safety Manual for Decision-Makers and Practitioners, 2010. http://apps.who.int/iris/bitstream/10665/44256/1/9789241598965 _eng.pdf. 5.2 Continual, proactive monitoring and feedback gathering from the community on their safety issues and concerns Pedestrian Safety: A Road Safety Manual for Decision Makers and Practitioners. World Health Organization. Pedestrian Safety: A Road Safety Manual for Decision Makers and Practitioners. World Health Organization, Geneva, 2013. 5.3 Engage in public health surveillance on traffic-related hospitalizations and fatalities Data Systems: A Road Safety Manual for Decision Makers and Practitioners World Health Organization. Data Systems: A Road Safety Manual for Decision Makers and Practitioners, 2010. http://apps.who.int/iris/bitstream/10665/44256/1/9789241598965 _eng.pdf. Review of Swedish Experiences Concerning Analysis of People Injured in Traffic Accidents Howard, C., and A. Linder. Review of Swedish Experiences Concerning Analysis of People Injured in Traffic Accidents, 2013. https://www.vti.se/en/publications/pdf/review -of-swedish-experiences-concerning-analysis-of-people-injured-in-traffic-accidents.pdf. 5.4 Independent review/audit of safety program Independent Review of Road Safety in Sweden Breen, J., E. Howard, and T. Bliss. Independent Review of Road Safety in Sweden, 2008. Evaluating the Effectiveness of State Toward Zero Deaths Program Munnich et al. (11). NCHRP Synthesis of Highway Practice 336: Road Safety Audits Wilson, E.M., and M.E. Lipinski. NCHRP Synthesis of Highway Practice 336: Road Safety Audits. Transportation Research Board of the National Academies, Washington, D.C., 2004. 5.5 Interagency sharing of collision and other key data Road Safety as a Shared Responsibility and a Public Problem in Swedish Road Safety Policy McAndrews (7). Data Systems: A Road Safety Manual for Decision Makers and Practitioners World Health Organization. Data Systems: A Road Safety Manual for Decision-Makers and Practitioners. 2010. http://apps.who.int/iris/bitstream/10665/44256/1/9789241598965 _eng.pdf. 5.7 Routine evaluation of effectiveness of traffic safety interventions Presentation at Workshop on Independent and Transparent Accident Investigation Recommendations Bergfalk, L. Presentation at Workshop on Independent and Transparent Accident Investi- gation Recommendations, Brussels, 2007. http://erso.swov.nl/safetynet/fixed/WP4 /Workshop_3_2007/sn_wp4_Brussels_WSguest4_SwedishTrafficInspectorate_LB.pdf. Road Safety Inspections: Best Practice and Implementation Plan European Road Safety Observatory. Road Safety Inspections: Best Practice and Imple- mentation Plan. http://ec.europa.eu/transport/wcm/road_safety/erso/knowledge/Content /70_qrst/monitoring_targets.htm. Policy Instruments for Managing Road Safety on EU-Roads Laurinavicius, A., L. Jukneviciute-Zilinskiene, K. Ratkeviciute, I. Lingyte, L. Cygaite, V. Grigonis, R. Ušpalyté-Vitku–niene˙, D. Antov, T. Metsvahi, Z. Toth-Szabo, and A. Varhely. Policy Instruments for Managing Road Safety on EU-Roads. Transport, Vol. 27, No. 4, 2012, pp. 397–404. 5.8 Website with relevant safety data collected in a timely manner What Do the Best Government Websites of 2015 Have in Common? Wood, C., S. Towns, N. Knell, and J. Mulholland. What Do the Best Government Web- sites of 2015 Have in Common? Government Technology, September 2015. http:// www.govtech.com/internet/2015-Best-of-the-Web-Award-Winners-Announced.html. Using Technology to Promote Transparency in City Government Pulidindi, J. Using Technology to Promote Transparency in City Government. National League of Cities, Washington, D.C., 2010. Section 6. Policy 6.1 Measures to reduce traffic volumes Traffic Accidents and the London Congestion Charge Green, C.P., J.S. Heywood, and M. Navarro. Traffic Accidents and the London Conges- tion Charge. Economics Working Paper Series, Lancaster University Management School, 2014. TABLE 2 (continued) Matrix Sources Document Link (continued)
  • 8. Fleisher, Wier, and Hunter 79 (continued on next page) 6.5 Pre-pay for morning parking to discourage drinking and driving Overnight options Estey, M. Overnight Options. International Parking Institute, November 2015. http:// www.parking.org/media/320165/prepaid%20parking%20in%20seattle.pdf. Successful Pre-Paid Parking Program Saves Lives http://sdotblog.seattle.gov/2013/03/18/successful-pre-paid-parking-program-saves-lives/. 6.6 Restrict deliveries to off peak hours to remove trucks from the busiest streets to improve road safety and ease congestion Delivering a Road Freight Legacy: Working Together for Safer, Greener and More Efficient Deliveries in London Transport for London. Delivering a Road Freight Legacy: Working Together for Safer, Greener and More Efficient Deliveries in London. 2013. http://content.tfl.gov.uk /delivering-a-road-freight-legacy.pdf. SWOV Fact Sheet: Blind Spot Crashes SWOV Institute for Road Safety. SWOV Fact Sheet: Blind Spot Crashes. https://www .swov.nl/rapport/Factsheets/UK/FS_Blind_spot_crashes.pdf. 6.7b Policies targeted at protecting vulnerable users: illegal to harass (threaten verbally or physically) a vulnerable user Good Intentions: The Enforcement of Hate Crime Penalty-Enhancement Statutes. Franklin, K. Good Intentions: The Enforcement of Hate Crime Penalty-Enhancement Statutes. American Behavioral Scientist, Vol. 46, No. 1, 2002, pp. 154–172. Improving Road Safety Through Deterrence-Based Initiatives: A Review of Research Davey, J.D., and J.E. Freeman. Improving Road Safety Through Deterrence-Based Initiatives: A Review of Research. Sultan Qaboos University Medical Journal, Vol. 11, No. 1, 2011, pp. 29–37. 6.8 Target safety improvements to school areas Healthy Urban Environments for Children and Young People: A Systematic Review of Intervention Studies Audrey, S., and H. Batista-Ferrer. Healthy Urban Environments for Children and Young People: A Systematic Review of Intervention Studies. Health and Place, Vol. 36, 2015, pp. 97–117. Effectiveness of a Safe Routes to School Program in Preventing School-Aged Pedestrian Injury DiMaggio, C., and L. Guohua. Effectiveness of a Safe Routes to School Program in Preventing School-Aged Pedestrian Injury. Pediatrics, Vol. 131, No. 2, 2013, pp. 290–296. 6.11b State level policies targeted at protecting vulnerable users: mandatory for cars to give at least three feet of clearance when passing a bicycle in the same lane (aka “three-foot rule”) Is the Three-Foot Bicycle Passing Law Working in Baltimore, Maryland? Love, D.C., A. Breaud, S. Burns, J. Margulies, M. Romano, and R. Lawrence. Is the Three-Foot Bicycle Passing Law Working in Baltimore, Maryland? Accident Analysis and Prevention, Vol. 48, 2012, pp. 451–456. The 3-ft. Law: Lessons Learned from a National Analysis of State Policy and Expert Interviews Brown, C. The 3-ft. Law: Lessons Learned From a National Analysis of State Policy and Expert Interviews. New Jersey Bicycle and Pedestrian Resource Center. http:// njbikeped.org/wp-content/uploads/2013/04/3-Foot-Final-Report-Draft_V7.pdf. 6.11d State level policies targeted at protecting vulnerable users: vulnerable user law Is It Time to Advocate for a Vulnerable Road User Protection Law in New Zealand? Weiss, H., and A. Ward. Is it Time to Advocate for a Vulnerable Road User Protection Law in New Zealand? New Zealand Medical Journal, Vol. 126, No. 1374, 2013, pp. 5–10. The Deterrent Effect of Increasing Fixed Penalties for Traffic Offences: The Norwegian Experience Elvik, R., and P. Christensen. The Deterrent Effect of Increasing Fixed Penalties for Traffic Offences: The Norwegian Experience. Journal of Safety Research, Vol. 38, No. 6, 2007, pp. 689–695. 6.14 Lower alcohol limit Reaching Zero: Actions to Eliminate Alcohol-Impaired Driving National Transportation Safety Board. Reaching Zero: Actions to Eliminate Alcohol- Impaired Driving. Safety Report NTSB/SR-13/01. NTSB, Washington, D.C., 2013. The Effects of Introducing or Lowering Legal per se Blood Alcohol Limits For Driving: An International Review. Mann, R.E., S. Macdonald, G. Stoduto, S. Bondy, B. Jonah, and A. Shaikh. The Effects of Introducing or Lowering Legal per se Blood Alcohol Limits for Driving: An Inter- national Review. Accident Analysis and Prevention, Vol. 33, No. 5, 2001, pp. 569–583. Section 7. Large vehicles 7.1 Heavy goods and large vehicle task force to suggest safety improvements and monitor regulations Industrial HGV task Force Review of First Six Months of Operations Transport for London. Industrial HGV Task Force Review of First Six Months of Operations. http://democracy.cityoflondon.gov.uk/documents/s37699/Road%20 Safety-%20Casualties%20and%20Collisions-%20Appendix.pdf. 7.4 Outfit large vehicles with front and side mirrors to improve visibility Truck Mirrors, Fields of View, and Serious Truck Crashes Blower, D.F. Truck Mirrors, Fields of View, and Serious Truck Crashes. Publication UMTRI-2007-25. University of Michigan Transportation Research Institute, Ann Arbor, 2007. 7.5 Outfit large vehicles with rear wheel and side guards Truck Sideguards for Vision Zero: Review and Technical Recommendations for Safe Fleet Transition Plan Pilot Deployment Epstein, A.K., S. Peirce, A. Breck, C. Cooper, and E. Segev. Truck Sideguards for Vision Zero: Review and Technical Recommendations for Safe Fleet Transition Plan Pilot Deployment. Publication DOT-VNTSC-DCAS-14-01. U.S. Department of Transportation, Cambridge, Mass., John A. Volpe National Transportation Systems Center, 2014. Section 8. Vehicle technology 8.3 Intelligent speed adaption technologies that alert or slow the vehicle if traveling over the speed limit Is Intelligent Speed Adaptation Ready for Deployment? Carsten, O. Is Intelligent Speed Adaptation Ready for Deployment? Accident Analysis and Prevention, Vol. 48, 2012, pp. 1–3. TABLE 2 (continued) Matrix Sources Document Link
  • 9. 80 Transportation Research Record 2582 To support accuracy, each city and country that was included in the matrix reviewed its entries. Cities designated a reviewer, typically their Vision Zero lead or safety expert. Reviews took place from May to July 2015, and 11 of 12 cities or countries initially included in the analysis participated. The representative from Australia opted to not review the Traffic Safety Best Practices Matrix because he felt there was too much variation among cities to make an assessment at the country level. As a result, Australia was removed from the final ver- sion of the matrix. Reviewers were contacted via email and were sent a copy of the matrix that included data for their jurisdiction only with a column titled review and a column titled comments as well as a letter that explained the purpose of the project. Reviewers were instructed to indicate if a measure erroneously received a checkmark (i.e., their city was not in fact pursing or considering the measure) by placing an X in the review column and to indicate if a measure was missing a check- mark (i.e., their city was in fact pursuing or considering the measure) by placing a √ in the review column; to indicate that a measure was accurate, reviewers were asked to leave the review column blank. The matrix was then revised to reflect reviewer feedback. The majority of reviewers corrected some measures and expressed either an eagerness to use the matrix to further their efforts or were neutral toward the exercise. One region initially identified is not rep- resented in the matrix, for the primary contact opted to not participate because of too much variation between cities to make an assessment at a regional level; the region was thus removed from the matrix. DISCUSSION OF RESULTS The Traffic Safety Best Practices Matrix (Figure 1) lists measures that cities in the United States and cities and countries abroad are pursuing as of May 2015 to reduce pedestrian-, bicycle-, and traffic- related injuries and fatalities. Also included for each measure are efficacy designations based on existing evidence. Table 2 provides a list of the sources used for the review. Big cities across the United States, in adopting Vision Zero, are leading efforts to reframe the way in which traffic safety is viewed and managed. While this effort is commendable, and speaks to the role of cities as catalysts for change, cities are doing so without much guidance as to what Vision Zero is and what actions could be implemented to reach zero deaths. The Traffic Safety Best Prac- tices Matrix attempts to bridge this gap by presenting a framework for cities to understand and identify potential strategies for Vision Zero implementation. The discussion details the ways in which the matrix can assist jurisdictions in identifying the range of tools available to them to reduce severe and fatal collisions and further the Vision Zero movement. In addition, the discussion includes an analysis of the matrix throughout which are recommendations for implementation that are supported by lessons learned from Vision Zero implementation abroad, as well as insights from other fields. Uses of the Matrix Strategy Identification To move the needle on Vision Zero further and faster, cities need to understand the Vision Zero landscape and be able to share best prac- tices in real time. The matrix can help cities understand the range of levers available to advance the safety platform. The measures listed in the matrix, organized by categories, can help cities understand the breadth of strategies available while also providing a structure for strategy organization. This aspect of the matrix can be especially useful for cities considering implementing the policy. This is not to suggest that there is only one way to implement Vision Zero. Sweden and the Netherlands, for example, have the lon- gest and most well-established safe system approach; yet they differ in how they articulate the safety platform. Sweden’s Vision Zero has focused on issues of rural transportation safety, while the Netherlands has focused on pedestrian and bicycle safety in urban areas (15). Both have achieved great success in their efforts (16). That said, Sweden, as it is the birthplace of Vision Zero, is looked to as pro- viding the blueprint for Vision Zero implementation. Nonetheless, it is inevitable—and appropriate as informed by analysis of safety issues and crash patterns in specific jurisdictions—that the safety measures advanced in the United States will deviate from those of Sweden (and the Netherlands, and other counties that have for some time pursued a systems approach to road safety). How Much Benefit Does Intelligent Speed Adaptation Deliver: An Analysis of Its Potential Contribution to Safety and Environment. Lai, F., O. Carsten, and F. Tate. How Much Benefit Does Intelligent Speed Adaptation Deliver: An Analysis of its Potential Contribution to Safety and Environment. Accident Analysis and Prevention, Vol. 48, 2012, pp. 63–72. 8.5 Partner with industry groups and vehicle manufacturers to further the use of technology to achieve safety aims Vision Zero: Adopting a Target of Zero for Road Traffic Fatalities and Serious Injuries Whitelegg and Haq (6). Road Safety: Impact of New Technologies Organisation for Economic Co-operation and Development. Road Safety: Impact of New Technologies, 2003. http://www.internationaltransportforum.org/Pub/pdf /03SRnewTech.pdf. Section 9. Taxi services and transportation network company 9.2 Black box data recorders in taxis Vehicle Safety Technology Pilot Program http://www.nyc.gov/html/tlc/html/industry/veh_safety_tech_pilot_program.shtml. Driver Characteristic Using Driving Monitoring Recorder Ueyama, M.J. Driver Characteristic Using Driving Monitoring Recorder. Proceedings of the 17th International Technical Conference on the Enhanced Safety of Vehicles Conference, June 4–7, 2001, Amsterdam, Netherlands. June 2001. 9.3 Increase late-night taxi stand zones Overnight Options Estey, M. Overnight Options. International Parking Institute, November 2015. http://www .parking.org/media/320165/prepaid%20parking%20in%20seattle.pdf. TABLE 2 (continued) Matrix Sources Document Link
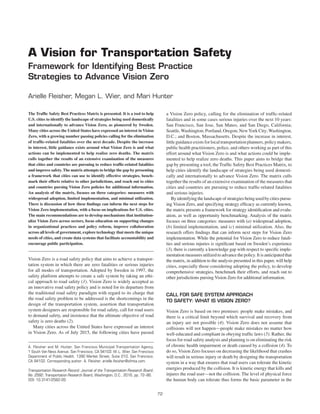
  • 10. Fleisher, Wier, and Hunter 81 Traffic Safety Best Practices SF N YC C hicago Portland Seattle D C B oston LA Sw eden N etherlandsLondon Efficacy InternationalDomestic 1.1 Safety Action Plan (Vision Zero)/ Strategy R, LIT 1.2 Vision Zero Policy (or VZ like policy) R, LIT 1.3 Vision Zero Steering Committee R, LIT 2.1 Informative signage a. Advisory/cautionary signs (e.g. "State Law: Stop for Pedestrians”; "High Bicycle Activity Zone”) R, LIT b. Dynamic message signs with safety messaging R, LIT c. Remove unnecessary and/or confusing signage R, NCHRP d. Speed indicator signs R, NCHRP 2.2 Perform engineering reviews at all traffic fatality and high collision locations and at scenes of crashes R, LIT a. Pedestrian only streets R, NCHRP b. Restrict car access in the city center R, LIT 2.4 Shared-space area for cars, bicyclists and pedestrians R, LIT a. Bicycle signals R, NCHRP b. Pedestrian countdown signals P, LIT c. Hawk signal R, CMF d. Protected turns (turn pockets & signal phasing) R, CMF e. Puffin Crossing R, CMF f. Rapid flash beacons R, CMF a. Leading bike interval R, NCHRP b. Leading pedestrian interval R, CMF c. Pedestrian scrambles (exclusive pedestrian phase) U, CMF a. Arterial slow zones U b. Senior slow/safety zones P, LIT c. Slow zones around schools/ local streets P, LIT a. Advance stop or yield lines R, LIT b. Enhanced sharrow markings R, LIT c. High visibility crosswalk (continental crosswalk) P, LIT d. Increase street lighting to improve visibility in high crash locations R, CMF e. Lane narrowing R, NCHRP f. Pedestrian refuge islands and medians R, NCHRP g. Separated bike lanes R, CMF h. Restrict parking near intersections (aka "daylighting") P, LIT i. Road diet P, CTW j. Roundabouts P, NCHRP k. Speed humps, chicanes, diagonal parking, bulb outs, raised crosswalks (general traffic calming measures) P, NCHRP 3.1 Bike and safety/crosswalk ambassadors U, CTW 3.2 Educate state level organizations on city actions and Vision Zero commitments to broaden understanding of Vision Zero's impact on pedestrian/bike/traffic fatalities and injuries NA R, LIT 3.3 Engage with community based organizations and advocates R, LIT 3.4 Helmet focused education U, CTW 3.5 Mass media/communication education campaign focused on pedestrian awareness, bike safety, and/or speeding R, NCHRP 3.6 Measures to increase the conspicuousness of bicyclists (e.g. promotion of reflector vests, lights, etc.) R, CTW 3.7 Outreach to schools to educate students on bike/pedestrian/traffic safety R, CTW 3.8 Targeted education/outreach to high priority areas R, NCHRP 3.9 Train city staff on Vision Zero safety priorities R, NCHRP 3.10 Trainings for senior citizens on walking and biking R, LIT 3.11 Update officer trainings to reflect new safety priorities and regularly conduct trainings R, NCHRP 3.12 Website dedicated to bike/pedestrian/traffic safety issues and concerns R, LIT a. Block the box camera U b. Failure-to-yield crosswalk camera U c. Illegal turn camera U d. Oversize vehicle camera U e. Point to point camera P, LIT f. Red light camera P, NCHRP g. Speed camera P, CTW 4.2 Convene regular meetings of transportation leaders and the police department to review traffic safety performance and determine strategies for improvement R, LIT 4.3 DUI checkpoints P, NCHRP 4.4 High visibility enforcement P, NCHRP 4.5 Increase enforcement against dangerous moving violations (speeding, failing to yield to pedestrians, signal violations, improper turns/illegal turns, phoning/texting while driving) R, CTW 4.6 Investigate crashes that result in fatalities as well as crashes that result in critical injuries R, LIT 4.7 Random breath testing P, LIT 4.8 Update technology that assists with capturing crash data and/or speed detection R, LIT InternationalDomestic 1. Supportive infrastructure/ Planning 2. Engineering 2.3 Restrictions on street access 2.5 Signal hardware additions 2.6 Signal hardware uses 2.7 Slow Zones 2.8 Road design 3. Education 4. Enforcement 4.1 Automated enforcement (a) FIGURE 1 Traffic Safety Best Practices Matrix (SF = San Francisco; NYC = New York City; DC = Washington, D.C.; LA = Los Angeles). (continued on next page)
  • 11. 82 Transportation Research Record 2582 5. 1 Comparative data system linking social and environment factors with injury data P, LIT 5. 2 Continual, proactive monitoring and feedback gathering from the community on their safety issues and concerns R, LIT 5.3 Engage in public health surveillance on traffic-related hospitalizations and fatalities P, LIT 5.4 Independent review/audit of safety program R, LIT 5.5 Interagency sharing of collision and other key data R, LIT 5.6 Publish city-wide collision report R, LIT 5.7 Routine evaluation of effectiveness of traffic safety interventions R, LIT 5.8 Website with relevant safety data collected in a timely manner R, LIT 5. Monitoring, Analysis, and Evaluation Traffic Safety Best Practices SF N YC C hicago Portland Seattle D C B oston LA Sw eden N etherlandsLondon Efficacy InternationalDomestic InternationalDomestic a. Congestion pricing R, LIT a. Implement Complete Streets policy U b. Transportation Demand Management Program U 6.3 Mandatory helmet law (18+) R, CTW 6.4 No right turn on red (city-wide) R, NCHRP 6.5 Pre-pay for morning parking to discourage drinking and driving R. LIT 6.6 Restrict deliveries to off peak hours to remove trucks from the busiest streets to improve road safety and ease congestion R, LIT a. Classify traffic-related incidents as collisions and not accidents U b. Illegal to harass (threaten verbally or physically) a vulnerable user U, LIT 6.8 Target safety improvements to school areas R, LIT 6.9 Align state level Towards Zero Death policy with local level Vision Zero policy NA NA NA NA U a. Change DMV point penalty structure so that dangerous offenses are punished with the most severe point values NA NA NA U, CTW b. Increase penalties for driving with a suspended license NA NA NA R, CTW c. Increase penalties for leaving the scene of a crash NA NA NA R, CTW a. Increase consequences (fines, tickets, jail time) for careless driving (e.g. injuring a pedestrian/bicyclist, failing to stop and give right of way to pedestrians in crosswalks, etc.) U, CTW b. Mandatory for cars to give at least three feet of clearance when passing a bicycle in the same lane (aka "three-foot rule") U, LIT c. Ticket and fine motorists who open a door into the path of other traffic, including bicycles and pedestrians (aka "dooring") U d. Vulnerable User law U, LIT 6.12 Variable speed limits via signage R, NCHRP 6.13 Identify opportunities to advance Vision Zero policies, practices and projects in federal programs with US DOT and Congress NA NA NA U 6.14 Lower alcohol limit P, LIT 7.1 Heavy Goods/ Large Vehicle Task Force to suggest safety improvements and monitor regulations R, LIT 7.2 Install blind spot mirrors at the most hazardous intersections to help large vehicle drivers better see bicyclists U 7.3 Large vehicle driver education on bike/pedestrian safety R, NCHRP 7.4 Outfit large vehicles with front and side mirrors to improve visibility P, LIT 7.5 Outfit large vehicles with rear wheel and side guards P, LIT 8.1 Alcohol interlocks in government and commercial fleets P, NCHRP 8.2 Driver awareness systems to alert the driver to the presence of pedestrians near the vehicle cameras, sensors) R, CMF 8.3 Intelligent speed adaption technologies that alert or slow the vehicle if traveling over the (speed limit) P, LIT 8.4 Lane departure warning assistance R, CMF 8.5 Partner with industry groups and vehicle manufacturers to further the use of technology to achieve safety aims R, LIT 9.1 Automatic meter shut-off in taxis that speed U 9.2 Black box data recorders in taxis U, LIT 9.3 Increase late-night taxi stand zones R, LIT 9.4 Issue tickets to taxi drivers identified by red light cameras R, CTW 9.5 TNC regulations (training, devices, safety equipment) U 9.6 Update taxi education to reflect safety priorities R, NCHRP 9.7 Window stickers warning passengers to not open their door into passing bicyclist R, CTW 7. Large Vehicles KEY 8. Vehicle Technology 9. Taxi Services and Transportation Network Company = Planned/ A Priority/ In Process/ In Practice NA = Not applicable P = Proven R = Recommended U = Unknown CTW = Countermeasures that Work NCHRP = NCHRP 500 Report CMF = Crash Modification Factors Clearinghouse LIT = Literature 6.7 Policies targeted at protecting vulnerable users State 6. Policy Local 6.10 State policies targeted at collision reduction 6.11 State level policies targeted at protecting vulnerable users Federal 6.2 Crosscutting measures to reduce car dependence/ improve transit /promote walking and biking 6.1 Measures to reduce traffic volumes (b) FIGURE 1 (continued) Traffic Safety Best Practices Matrix.
  • 12. Fleisher, Wier, and Hunter 83 Adaptation and implementation of Vision Zero in the United States should be mindful of the core principle of Vision Zero: to reduce severe and fatal injuries and shield the human body from excessive force, speed must be managed. This can best be achieved by lowering speeds and redesigning streets to support low speeds (4). Efficacy Assessment and Future Research Needs By identifying the known efficacy of measures, the matrix can help cities select evidence-based measures to assist them in their efforts to reach zero. However, since Vision Zero is so new to the U.S. context, many measures have yet to be evaluated (or evaluated consistently), and thus may yet prove to be effective. Several of these measures are concentrated in the policy section of the matrix. For example, the change in classification of traffic-related incidents as collisions and not accidents (6.7a, U) is a recent linguistic shift, and its impact on road safety has yet been studied. Strategies that promote walk- ing, biking, and transit (6.2a, U; 6.2b, U) have the potential to affect safety dependent of the extent to which they include changes in sys- tem design that have proven safety benefits (i.e., to ensure increases in active transportation are not accompanied by increases in severe and fatal injury), beyond encouraging mode shift. This does not mean these and other U measures should not be pursued per se; rather, if practitioners pursue a U, they should seek to also include an evaluation component as part of the project. Researchers should consider measures designated U as opportuni- ties for future research. Adoption of Vision Zero by U.S. cities is in many ways a natural experiment, with notable variation in how U.S. cities are adopting and implementing the platform. It is anticipated that there should be ample opportunities for researchers to evalu- ate the efficacy of individual measures that currently lack sufficient evaluation—as well as evaluation opportunities for the synergistic impacts of implementing multiple safety measures, consistent with the safe system approach. Benchmarking The matrix can also be used as a means for cities to benchmark efforts to advance Vision Zero. Cities can examine the matrix to consider what additional measures other cities are implementing, toward set- ting realistic goals for improvement or identify opportunities for new partnerships to help advance the Vision Zero goal. Discussion Among Cities Cities can also use the matrix to facilitate peer city exchange. The matrix allows cities to become aware of the measures that their peers are implementing. Thus, cities will know whom to engage to find out more information and to determine if a measure is appropriate for their city. Analysis of Traffic Safety Best Practices Matrix The researchers analyzed the matrix and arranged their observations by the themes that emerged: measures with (a) widespread adop- tion, (b) limited implementation, and (c) minimal utilization. In the following analysis, there is discussion of how these findings can inform the next steps for Vision Zero implementation, with a focus on implications for U.S. cities. The discussion notes the location of the measure on the matrix as well as the efficacy designation. Widespread Adoption In several sections and individual lines in the matrix there is a clustering of checkmarks, which suggests widespread adoption of the measures among the cities included in this analysis, includ- ing implementation or plans for adoption. Clustering for a sec- tion or line is defined as its having more than 70% of the boxes checked. Engineering, the second section, is an area in which one sees significant clustering of checkmarks. That suggests that this area has received considerable attention from the cities and countries included in the review and that many of the countermeasures are well-used. The engineering countermeasures focus on reducing speeds and range from reducing speeds limits on local streets and near schools and senior centers, and on arterials (2.7a, U; 2.7b, P; 2.7c, P); installing electronic signage that indicates speed (2.1d, R); and geometric changes, in particular pedestrian refuge islands (2.8f, R) (17); roundabouts (2.8j, P) (17); and speed humps (2.8k, P) (18). Many of these measures have an on impact road design, which is a critical way to modify speeds to make roads inherently safe (19). Engineering measures not well used or selectively used include puf- fin crossings (2.5e, R); senior slow zones (2.7b, P); in the United States, specifically, restrictions on street access (2.3a, R; 2.3b, R); and roundabouts (2.8j, P). Some of these measures are particu- larly innovative, some may necessitate significant construction, and some may require enhanced political or community support. These factors, among others, could explain their paucity in uptake. Cities leading on these efforts could be sought out for additional information. Education, Section 3, is another section where most peer cities and counties have implemented multiple measures. The main excep- tion in this section is Sweden, for it is the only location included in the review not using mass media or communication education (3.5, R). This is fitting with how Sweden conceptualized Vision Zero: education was considered capable of maintaining existing safety levels, but it was unlikely to generate the significant future improvement needed to achieve the paradigm’s ambitious goals (5). Indeed, focusing on educating the road user is antithetical to the idea that grounds Vision Zero: Individuals make mistakes no mat- ter how well educated (1). Under Sweden’s Vision Zero, road users are responsible for following the rules, but this expectation runs parallel to system designers’ efforts at continually making the road system safer (10). Sweden does not emphasize education per se, but instead creating more respect for the rules of the road, in particular with regard to speed limits, seat belt use, and intoxicated driving (6), a nuanced but important distinction. Education about road safety in the traditional sense was never emphasized in Sweden because its planning focus, since the 1960s, was to alter the built environment, by placing restriction on cars, to achieve safety. In essence, the road has provided the education (7). It is not surprising that education is a well-used tool for Vision Zero implementation in the United States, given that education and enforcement have since the 1960s assumed a primary role in safety promotion—equally aligned with the other E: engineering. Yet these tools have been used in an environment where, unlike Sweden, the dominance of the car was never challenged so as to make streets inherently safe (7). Now many U.S. cities are focus- ing more on changes to the built environment to achieve safety. It
  • 13. 84 Transportation Research Record 2582 will be interesting to see how the emphasis on education shifts over time as Vision Zero is implemented, particularly if U.S. implemen- tation maintains Sweden’s focus on system design. U.S. cities could approach this transition as an opportunity to consider an alterna- tive approach to education, advanced by the field of public health, which would be to take a socioecological approach to education efforts and focus not only on enhancing individual skills, but on how education can support changes in organizational practices and policy reform (20). This approach seems more aligned with Vision Zero principles. Another area of widespread adoption is supportive infrastruc- ture and planning, Section 1, which the research suggests is fun- damental to successful Vision Zero implementation. Here, again, Sweden is the exception in that it does not use a Vision Zero task force or steering committee (1.3, R). In this case, that absence suggests less a fundamental difference in approach (as with educa- tion) and instead a limitation in implementation (7). While multi- sectorial thinking informed the development of Vision Zero in Sweden, this collaboration did not continue into the implemen- tation phase. Lack of cooperation and consultation among sec- tors were acknowledged as reasons for which Sweden failed to reach its 2007 target of a 50% reduction in traffic-related deaths from 1997 (21). Since then, Sweden has set up structures for col- laboration: six times a year representatives from municipalities, the police, occupational health, vehicle industry and insurance companies meet with representatives from the Swedish Transport Administration and Agency to discuss safety efforts. Stakeholders are also engaged at the annual result conferences, where analysis of road safety performance indicators (such as speed compliance and seat belt use) is presented (3). In addition, representatives from different sectors come together to analyze crash data. What seems to be lacking are ongoing, daily, working relationships across sectors (7). McAndrews (7) argues that public health, police, vehicle manufactures, and safety specialists have been left out of Vision Zero, and that it has concentrated responsibility in the transportation sector (7). U.S. cities can learn from this short- coming and concentrate on developing mechanisms that support the institutionalize Vision Zero in existing institutions beyond the transportation sector, including public health, police, and other key implementation partners. Vision Zero is an example of Health in All Policies (HiAP), an approach to policy making that has struggled since forming in the 1980s to engage across sectors and whose experience further demonstrates how lacking institutions can undermine even best intentions at collaboration. HiAP calls for incorporating health considerations into decision-making structures across sectors and policy areas (22). Like Vision Zero, HiAP has as its origins in Europe and is a nontraditional approach. It requires leadership and resources from outside public health and the formation of new structures and processes that align agency missions and identify shared agendas to advance health in nonhealth sectors (23, 24). Yet HiAP has struggled because it has had difficulty creating a foundation to support its intersectoral work. HiAP experts argue that the how of shared governance—infrastructures, tools, instru- ments, and processes that facilitate intersectoral partnerships—is not well understood, and that, until it is, there will be difficulty in overcoming the typical, siloed approach to government work (25). The experience of HiAP suggests the salience of investing the resources, time and personnel necessary to develop productive intersectoral collaborations. Done well, Vision Zero cities could emerge as models for HiAP efforts. Limited Implementation Some measures are being used by only a few U.S. cities and only a few of the international cities and countries included in the review. The definition of “select” is having, for a section or line, between 40% and 69% of the boxes checked. As can be seen in the matrix, cities are not seeking opportuni- ties for collaboration across all levels of government, even though positioning on traffic safety policy in U.S. at the federal, state, and local level is more aligned than not. Only a select group of cities are educating state level organizations on their city’s Vision Zero commitment (3.2, R), engaging with their state level TZD policy (6.9, U), or seeking opportunities to advance their efforts at the fed- eral level (6.13, U). All the U.S. cities included in the review, with the exception of New York City, have at their state level a TZD pol- icy. Seattle stands out in that it drafted its Vision Zero strategy to be in line with the state’s Target Zero plan (J. Curtin, e-mail correspon- dence, July 6, 2015). TZD is an effective strategy: a 2012 evaluation of the TZD programs in Idaho, Minnesota, Utah, and Washington found that fatality rates decreased faster in these states than in states without TZD programs (11). Efforts at the federal level also have as their focus the elimination of traffic fatalities, and the government’s recently published national strategy on highway safety aims to provide direction for both federal and state level TZD efforts (12). Federal, state, and local levels of government share the vision of eliminating traffic fatalities and are all developing strategies that trace their roots to Vision Zero and the safe system approach. While the space governed by each agency is different (highway as opposed to local roads, for example), at the very least, this alignment of goals suggests an opportunity for collaboration to advance and strengthen traffic safety efforts and address challenges that lie at the intersec- tion of federal, state, and local jurisdictions. What can cities learn from successful TZD efforts? What do city-level Vision Zero efforts have to offer state and federal TZD efforts? Where do these efforts meet and diverge? How can these policies be aligned and strength- ened? These are all questions that cities can consider and pursue as they implement Vision Zero, and the answers will help practitioners and researchers better understand if and how this collaboration is effective. Minimal Utilization Many measures are being implemented by less than 40% of the cities and countries included in the review. This suggests that there are many areas where U.S. cities could consider placing additional emphasis as they further efforts to implement Vision Zero. Vehicle technology, Section 8, is the one with the fewest boxes checked by the peer cities and counties. So it represents an area of great opportunity for U.S. cities. Only New York City and San Francisco indicated that they are considering partnerships with industry groups and vehicle manufactures (8.5, R) as part of their approach to Vision Zero. The four technologies highlighted in the Matrix, alcohol interlocks (8.1, P), driver awareness systems (8.2, R), intelligent speed adaptation (8.3, P), and lane departure warning assistance (8.4, R) all have proven safety benefits (26–28). Vehicle safety, achieved through advances in vehicle technology, is a strong focus of Vision Zero in Sweden, but this is not surprising, given that representatives from the automobile industry and experts on motor vehicle design were involved in the conceptualization of the safety philosophy (7).
  • 14. Fleisher, Wier, and Hunter 85 In the United States, vehicle safety is pursued at the federal level by NHTSA; cities have not historically been designated actors in this space (29). because vehicle safety is NHTSA’s domain, cities may be unsure how they fit, or if they should become involved at all. Cities do have jurisdiction over their bus fleet and may consider ways to use technology to improve the safety of their buses. For example, London is piloting intelligent speed adaptation, an inno- vative technology that ensures that vehicles cannot exceed speed limits on their buses (30). Perhaps the answer for U.S. cities is to not involve themselves in vehicle safety outright, but to consider ways in which private sector partnerships or technology in general can help them eliminate fatalities and serious injuries from their roads. Such an approach is consistent with Vision Zero’s emphasis on sys- tems thinking.Agood example of this is New York City’s request to Google to change its directions to discourage left turns (31). Automated enforcement (4.1a–d, U; 4.1e–g, P), actively pursued in the United States by Washington, D.C., is an area where checkmarks are scant. This suggests that automated enforcement is not only a key area for pursuit, but, in addition, an area apt for peer-city information sharing. Automated enforcement is a highly effective tool for speed reduction (32). Washington, D.C., uses five types of automated cam- eras, while the other U.S. cities employ only red light or transit-only cameras, if they do so at all. Many cities checked the box for speed cameras (4.1g; P), but for most cities, this is something they are plan- ning should they be able to get jurisdiction from their state. Other rea- sons that could explain why some U.S. cities are pursuing efforts while others are not are timing, funding, and staffing needs. Publishing a website with relevant safety data (5.8, R)—another area on the matrix where checkmarks are lacking—is a means through which cities could help achieve Vision Zero’s core prin- ciple that road users demand safety improvements—a responsibility that implies that public participation in transportation decision mak- ing is central to achieving Vision Zero (7). A website that clearly articulates the number of severe and fatal injuries, project delivery status, and relevant enforcement citation data, in addition to other key indicators, can facilitate transparency and accountability. It can thus assist the public in monitoring progress toward zero and allowing cities to achieve this key aim of the safety philosophy. To ensure this outcome, it is imperative that information on the web- site be presented in such that it can be easily interpreted by a lay audience and that analysis be provided where needed. In addition, staff responsible for the website should be responsive to the pub- lic’s needs for additions or clarifications. Public participation and accountability for Vision Zero initiatives were not adequately cap- tured by the matrix review. Nevertheless, they are important compo- nents for consideration as Vision Zero is implemented across U.S. cities, given the political will required to change the status quo with respect to some of the identified strategies (e.g., automated speed enforcement), as well as findings that severe and fatal injuries are often concentrated in areas that are disproportionately low-income, communities of color, and home to residents including seniors and people with disabilities reliant on walking or public transit (33). Additionally, routine evaluation of the effectiveness of traffic safety initiatives (5.7, R), while standard practice in the interna- tional regions reviewed, was notably absent among U.S. cities. Institutionalizing evaluation of the effectiveness of these measures will help ensure that resources are used most efficiently and can help inform the state of the practice. However, this requires prioriti- zation of funding and staff resources to ensure that robust evaluation can be planned, implemented, and shared to inform local practice. Development of comprehensive surveillance systems (5.4, R) is strongly supportive of this effort, as well as the overall data-driven approach to Vision Zero. LIMITATIONS The matrix can be a useful tool for strategy identification, bench- marking, and facilitating discussion among jurisdictions imple- menting Vision Zero. However, the matrix is a macrolevel effort and should be approached as a screening tool. To develop targeted, efficient, evidence-based strategies, cities should consider analysis of crash types; priority locations for investments based on severe and fatal crash densities and predictive factors; funding; staffing needs; and other area-specific issues. Two limitations are specific to the matrix. First, comparing cities with countries has the potential to obscure the analysis. How- ever, as Vision Zero (and its iterations) in Sweden, the Netherlands, and Australia is a country-level effort, it was believed appropriate to look at the country as a whole. Further, it was believed appro- priate because these countries have led on implementing systems approaches to traffic safety, and the researchers did not want to miss out on their insights and lessons. Moreover, there was great difficulty in finding sufficient city-specific information that would allow analyzing an individual city in these countries. Second, the cities and countries included in the review elected whom they wanted to review the matrix, and the researchers are unaware of the extent to which they sought corroboration from other members of their own staff. The assumption was that the checkmarks were accurate, but this is acknowledged as a limitation. CONCLUSIONS AND RECOMMENDATIONS The article presents the Traffic Safety Best Practices Matrix, a tool to help cities identify the landscape of strategies being used domes- tically and internationally to advance Vision Zero. There are fours ways in which cities implementing Vision Zero can use the tool: 1. Identify the range of levers available to advance Vision Zero, 2. Understand the currently known efficacy of the strategies and identify opportunities for future research, 3. Benchmark efforts to advance Vision Zero, and 4. Engage in peer exchange. Through an analysis of the matrix, which was supported by les- sons learned from Vision Zero implementation abroad, as well as insights from other fields, there was identification of measures with widespread adoption, limited implementation, and minimal utilization. On the basis of matrix analysis, lessons learned from Vision Zero implementation abroad, as well as insights from other fields, the fol- lowing recommendations are offered as next steps for Vision Zero implementation in cities in the United States: 1. Develop mechanisms that institutionalize Vision Zero in exist- ing institutions needed for its implementation that extend beyond the transportation sector. 2. Consider approaching education more in line with that of Sweden, where the focus is on creating respect for the rules of the road that are being emphasized through system design, for example, slow speeds. Focus education efforts on how education can support
  • 15. 86 Transportation Research Record 2582 the changes in organizational practices and policy reform that allow for changes in system design. 3. Seek opportunities to engage with state and federal leaders on Vision Zero efforts. 4. Explore technology advances that address the unique safety needs of cities. 5. Pursue automated speed enforcement and other camera tech- nologies that have proven safety benefits. 6. Facilitate accountability by creating web-based, publicly accessible spatial data systems that monitor, analyze, and report fatalities and severe injuries and associated factors, as well as facili- tate benchmarks on policy progress, to help constituents realize the magnitude and distribution of transportation injuries and create the collective consciousness needed to achieve the policy’s aims. ACKNOWLEDGMENTS The authors thank Ryan Greene-Roesel, who was instrumental in the development of the matrix, for her review of this paper. In addition, the authors thank San Francisco staff and community stakeholders who provided direction for the creation of the matrix and everyone from the representative jurisdictions who reviewed the matrix for accuracy. REFERENCES 1. Tingvall, C., and N. Haworth. Vision Zero:An EthicalApproach to Safety and Mobility. In Proceedings of the 6th ITE International Conference on Road Safety andTraffic Enforcement: Beyond 2000, Melbourne,Australia, Sept. 6–7, 1999. 2. Belin, M., P. Tillgren, and E. Vedung. Vision Zero—A Road Safety Policy Innovation. International Journal of Injury Control and Safety Promotion, Vol. 19, No. 2, 2012, pp. 171–179. 3. Analysis of Road Safety Trends 2013: Management by Objectives for Road Safety Work Towards the 2020 Interim Targets. Publication 2014:129. Swedish TransportAdministration, Borlänge, Sweden, 2014. 4. Johansson, R. Vision Zero–Implementing a Policy for Traffic Safety. Safety Science, Vol. 47, No. 2, 2009, pp. 826–831. 5. Organisation for Economic Co-operation and Development–International Transportation Forum. Towards Zero: Ambitious Road Safety Targets and the Safe System Approach. OECD Publishing, Paris, 2008. 6. Whitelegg, J., and G. Haq. Vision Zero: Adopting a Target of Zero for Road Traffic Fatalities and Serious Injuries. Stockholm Environment Institute, Sweden, 2006. 7. McAndrews, C. Road Safety as a Shared Responsibility and a Public Problem in Swedish Road Safety Policy. Science,Technology, and Human Values, Vol. 38, No. 6, 2013, pp. 749–772. 8. Tefft, B.C. Impact Speed and a Pedestrian’s Risk of Severe Injury or Death. Accident Analysis and Prevention, Vol. 50, 2013, pp. 871–878. 9. Australasian College of Road Safety. Safe System Approach. http://acrs .org.au/wp-content/uploads/ACRS_Safe-Systems_20100802_FA.pdf. Accessed Nov. 16, 2014. 10. Elvebakk, B. Vision Zero: Remaking Road Safety. Mobilities, Vol. 2, No. 3, 2007, pp. 425–441. 11. Munnich,L.W.,F.Douma,X.Qin,J.D.Thorpe,andK.Wang.Evaluating the Effectiveness of State Toward Zero Deaths Program. Report CTS 12-39T. Center for Excellence in Rural Safety, University of Minnesota, Minneapolis, 2012. 12. Toward Zero Deaths: A National Strategy on Highway Safety, June 2014. http://www.towardzerodeaths.org/wp-content/uploads/TZD _Strategy_12_1_2014.pdf. Accessed Nov. 16, 2014. 13. Transport for London. Safe Streets for London: The Road Safety Action Plan for London 2020. June 2013. https://tfl.gov.uk/cdn/static/cms /documents/safe-streets-for-london.pdf. Accessed Nov. 16, 2014. 14. Washington State Strategic Highway Safety Plan, Dec. 2013. http:// www.wsdot.wa.gov/NR/rdonlyres/5FC5452D-8217-4F20-B2A9 -080593625C99/0/TargetZeroPlan.pdf. Accessed Nov. 1, 2015. 15. Shahum, L. Five Key Lessons from Europe’s Vision Zero Success. Streetsblog, June 2015. http://usa.streetsblog.org/2015/06/10/five-key -lessons-from-europes-vision-zero-success/. Accessed July 11, 2015. 16. Organisation for Economic Co-operation and Development–International Transportation Forum. Road Safety Annual Report 2014. OECD Publishing, Paris, 2014. 17. Toolbox of Countermeasures andTheir Potential Effectiveness for Pedes- trian Crashes. Publication FHWA-SA-014. FHWA, U.S. Department of Transportation, 2008. 18. Webster, D.C., and R.E. Layfield. Review of 20 mph Zones in London Boroughs. Published Project Report PPR243. LondonAccidentAnalysis Unit, Transport for London, 2003. 19. Mackenbach, J., and M. McKee. Successes and Failures of Health Policy in Europe: Four Decades of Divergent Trends and Converging Challenges. Maidenhead, McGraw-Hill Education, New York, 2013. 20. Cohen,L.,andS.Swift.TheSpectrumofPrevention:DevelopingaCom- prehensive Approach to Injury Prevention. Injury Prevention, Vol. 5, No. 3, 1999, pp. 203–207. 21. Lie, A., and C. Tingvall. Government Status Report from Sweden. ESV 2009. Swedish Road Administration, Borlänge, Sweden, 2009. 22. Rudolph, L., J. Caplan, K. Ben-Moshe, and L. Dillon. Health in All Policies: A Guide for State and Local Governments. American Public Health Association and Public Health Institute, Washington, D.C., and Oakland, Calif., 2013. 23. Greaves, L.J., and L.R. Bialystok. Health in All Policies—All Talk and Little Action? Canadian Journal of Public Health, Vol. 102, No. 6, 2011, pp. 407–409. 24. Bostic, R.W., R.L.J. Thornton, E.C. Rudd, and M.J. Sternthal. Health in All Policies: The Role of the U.S. Department of Housing and Urban Development and Present and Future Challenges. Health Affairs (Proj- ect Hope), Vol. 31, No. 9, 2012, pp. 2130–2137. 25. Kickbusch, I. Health in All Policies: Where to From Here? Health Pro- motion International, Vol. 25, No. 3, 2010, pp. 261–264. 26. Voas, R.B. Monitoring Drinking: Alternative to License Suspension to Control Impaired Drivers? In Transportation Research Record: Jour- nal of the Transportation Research Board, No. 2182, Transportation Research Board of the National Academies, Washington, D.C., 2010, pp. 1–7. 27. Hagiwara, T., H. Hamaoka, M. Hamaguchi, S. Nakabayashi, K. Munehiro, and R. Sakakima. Dedicated Short-Range Communication System for Pedestrians and Vehicles During Right Turns. In Transportation Research Record: Journal of the Transportation Research Board, No. 2299, Transportation Research Board of the National Academies, Washington, D.C., 2012, pp. 157–165. 28. Arhin, S.A., A. Eskandarian, J. Blum, P. Delaigue, and D. Soudbakhsh. Effectiveness and Acceptance of Adaptive Intelligent Speed Adaptation Systems. In Transportation Research Record: Journal of the Transpor- tation Research Board, No. 2086, Transportation Research Board of the National Academies, Washington, D.C., 2008, pp. 133–139. 29. Hakkert, A.S., and V. Gitelman. Thinking About the History of Road Safety Research: PastAchievements and Future Challenges. Transporta- tion Research Part F: Traffic Psychology and Behaviour, Vol. 25, Part B, 2014, pp. 137–149. 30. Bus Speed Safety Trial Starts, June 2015. https://tfl.gov.uk/info-for /media/news-articles/bus-speed-safety-trial-starts. Accessed July 24, 2015. 31. Goodyear, S. New York Wants Google Maps to Discourage Left Turns. CityLab, July 2015. http://www.citylab.com/commute/2015/07/new -york-wants-google-maps-to-discourage-left-turns/398114/. Accessed July 24, 2015. 32. Retting, R.A., and C.M. Farmer. Evaluation of Speed Camera Enforce- ment in the District of Columbia. In Transportation Research Record: Journal of the Transportation Research Board, No. 1830, Transporta- tion Research Board of the National Academies, Washington, D.C., 2003, pp. 34–37. 33. Vision Zero SFTwo-Year Action Strategy, 2014. http://www.joomag.com /magazine/vision-zero-san-francisco/0685197001423594455?short. Accessed July 29, 2015. The Standing Committee on Transportation Issues in Major Cities peer-reviewed this paper.