SlideShare ist ein Scribd-Unternehmen logo
1 von 4
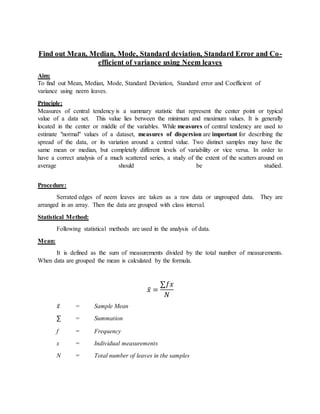
Find out Mean, Median, Mode, Standard deviation, Standard Error and Co-
efficient of variance using Neem leaves
Aim:
To find out Mean, Median, Mode, Standard Deviation, Standard error and Coefficient of
variance using neem leaves.
Principle:
Measures of central tendency is a summary statistic that represent the center point or typical
value of a data set. This value lies between the minimum and maximum values. It is generally
located in the center or middle of the variables. While measures of central tendency are used to
estimate "normal" values of a dataset, measures of dispersion are important for describing the
spread of the data, or its variation around a central value. Two distinct samples may have the
same mean or median, but completely different levels of variability or vice versa. In order to
have a correct analysis of a much scattered series, a study of the extent of the scatters around on
average should be studied.
Procedure:
Serrated edges of neem leaves are taken as a raw data or ungrouped data. They are
arranged in an array. Then the data are grouped with class interval.
Statistical Method:
Following statistical methods are used in the analysis of data.
Mean:
It is defined as the sum of measurements divided by the total number of measurements.
When data are grouped the mean is calculated by the formula.
𝑥̅ =
∑𝑓𝑥
𝑁
𝑥̅ = Sample Mean
∑ = Summation
f = Frequency
x = Individual measurements
N = Total number of leaves in the samples
Mean for grouped data with class interval is calculated by the formula.
𝑥̅ =
∑𝑓𝑚
𝑁
∑ = Sum
f = Frequency
m = Midvalues
N = Total number
Median:
Median of a sample is the middle number in a array when the number of observation is
odd.
Median is = Value of (
𝑁+1 𝑡ℎ
2
) items
Median for grouped data with class interval is calculated by the formula.
Median = 𝐿 + (
𝑁
2
−𝑐𝑓
𝑓
) × 𝑐
L = Lower limit of median class
N = Total frequency
Cf = Cumulative frequency prior to median class
C = Class interval of the median class
F = Frequency of the median class
Mode:
It is defined as the value of variable which occurs most frequency in a distribution mode
for grouped data with class interval is calculated by the formula.
Mode = 𝐿 + [
∆1
∆1+∆2
] × 𝐶
L = Lower limit of the mode class
∆1 = The difference between the frequency of modal class (f1) and the
frequency proceeding modal class (f0):∆1 = f1 – f0
∆2 = The difference between the frequency of the modal class (f1) and the
frequency of succeeding modal class (f2): ∆2 = f1 – f2.
C = Class interval of modal class.
F1 = Frequency of modal class
F0 = Frequency of proceeding modal class
F2 = Frequency of succeeding modal class
Standard Deviation:
It is defined as the positive square root of mean of the squares of deviation from the mean
standard deviation for a grouped data can be calculated by the formula
SD =
√∑𝑓(𝑥−𝑥̅)2
∑𝑓
SD for the data with class interval can be calculated by the formula.
SD =
√∑𝑓(𝑚−𝑥̅)2
∑𝑓
Co-efficient of variation:
The measure is obtained by dividing standard deviation by mean and multiplied by 100.
CV =
𝑆𝐷
𝑀𝑒𝑎𝑛
× 100
Standard Error:
Standard error is the ratio of standard deviation of the sample divided by square root of
the total number of deviation.
Standard error =
𝑆𝐷
√ 𝑁
Raw data:
Systematic data:
Result:
Mean =
Median =
Mode =
Standard deviation =
Standard error =
Co-efficient of variation =
Classes
(x)
Mid value
(m)
Frequency(f) fm 𝒅 = (𝒎 − 𝒙̅) 𝒅 𝟐
𝒇 × 𝒅 𝟐

Weitere ähnliche Inhalte

Was ist angesagt?

Was ist angesagt? (20)

Two sample t-test
Two sample t-testTwo sample t-test
Two sample t-test
 
Measures of Dispersion
Measures of DispersionMeasures of Dispersion
Measures of Dispersion
 
Two way analysis of variance (anova)
Two way analysis of variance (anova)Two way analysis of variance (anova)
Two way analysis of variance (anova)
 
Skewness and kurtosis
Skewness and kurtosisSkewness and kurtosis
Skewness and kurtosis
 
Measures of central tendency and dispersion
Measures of central tendency and dispersionMeasures of central tendency and dispersion
Measures of central tendency and dispersion
 
Introduction to kurtosis
Introduction to kurtosisIntroduction to kurtosis
Introduction to kurtosis
 
Contingency table
Contingency tableContingency table
Contingency table
 
Skewness.ppt
Skewness.pptSkewness.ppt
Skewness.ppt
 
comparison of CRD, RBD and LSD
comparison of CRD, RBD and LSDcomparison of CRD, RBD and LSD
comparison of CRD, RBD and LSD
 
Normal distribution
Normal distributionNormal distribution
Normal distribution
 
Moments in statistics
Moments in statisticsMoments in statistics
Moments in statistics
 
Measures of central tendancy
Measures of central tendancy Measures of central tendancy
Measures of central tendancy
 
Measure of Central Tendency
Measure of Central TendencyMeasure of Central Tendency
Measure of Central Tendency
 
Inferential statictis ready go
Inferential statictis ready goInferential statictis ready go
Inferential statictis ready go
 
Measure of Dispersion in statistics
Measure of Dispersion in statisticsMeasure of Dispersion in statistics
Measure of Dispersion in statistics
 
Measures of Dispersion
Measures of DispersionMeasures of Dispersion
Measures of Dispersion
 
F test and ANOVA
F test and ANOVAF test and ANOVA
F test and ANOVA
 
Meaning of statistics
Meaning of statisticsMeaning of statistics
Meaning of statistics
 
Measures of central tendency
Measures of central tendencyMeasures of central tendency
Measures of central tendency
 
Correlation analysis
Correlation analysis Correlation analysis
Correlation analysis
 

Ähnlich wie Find out Mean, Median, Mode, Standard deviation, Standard Error and Co-efficient of variance using Neem leaves

A. measure of central tendency
A. measure of central tendencyA. measure of central tendency
A. measure of central tendency
Ankita Darji
 
Bio statistics
Bio statisticsBio statistics
Bio statistics
Nc Das
 
CABT Math 8 measures of central tendency and dispersion
CABT Math 8   measures of central tendency and dispersionCABT Math 8   measures of central tendency and dispersion
CABT Math 8 measures of central tendency and dispersion
Gilbert Joseph Abueg
 
Measures of central tendency
Measures of central tendencyMeasures of central tendency
Measures of central tendency
kreshajay
 
Averages and Variability.pdf
Averages and Variability.pdfAverages and Variability.pdf
Averages and Variability.pdf
TamilarasiP13
 
Measure of central tendency (2)
Measure of central tendency (2)Measure of central tendency (2)
Measure of central tendency (2)
AndresBrutas
 

Ähnlich wie Find out Mean, Median, Mode, Standard deviation, Standard Error and Co-efficient of variance using Neem leaves (20)

A. measure of central tendency
A. measure of central tendencyA. measure of central tendency
A. measure of central tendency
 
I. central tendency
I. central tendencyI. central tendency
I. central tendency
 
Measures of Central Tendency, Variability and Shapes
Measures of Central Tendency, Variability and ShapesMeasures of Central Tendency, Variability and Shapes
Measures of Central Tendency, Variability and Shapes
 
Bio statistics
Bio statisticsBio statistics
Bio statistics
 
CABT Math 8 measures of central tendency and dispersion
CABT Math 8   measures of central tendency and dispersionCABT Math 8   measures of central tendency and dispersion
CABT Math 8 measures of central tendency and dispersion
 
Measures of central tendency
Measures of central tendencyMeasures of central tendency
Measures of central tendency
 
QT1 - 03 - Measures of Central Tendency
QT1 - 03 - Measures of Central TendencyQT1 - 03 - Measures of Central Tendency
QT1 - 03 - Measures of Central Tendency
 
QT1 - 03 - Measures of Central Tendency
QT1 - 03 - Measures of Central TendencyQT1 - 03 - Measures of Central Tendency
QT1 - 03 - Measures of Central Tendency
 
Stat11t chapter3
Stat11t chapter3Stat11t chapter3
Stat11t chapter3
 
Statistics
StatisticsStatistics
Statistics
 
Averages and Variability.pdf
Averages and Variability.pdfAverages and Variability.pdf
Averages and Variability.pdf
 
Normal distribuation curve[1]
Normal distribuation curve[1]Normal distribuation curve[1]
Normal distribuation curve[1]
 
Biostat.
Biostat.Biostat.
Biostat.
 
Measures of central tendency median mode
Measures of central tendency median modeMeasures of central tendency median mode
Measures of central tendency median mode
 
MEASURESOF CENTRAL TENDENCY
MEASURESOF CENTRAL TENDENCYMEASURESOF CENTRAL TENDENCY
MEASURESOF CENTRAL TENDENCY
 
G7-quantitative
G7-quantitativeG7-quantitative
G7-quantitative
 
central tendency.pptx
central tendency.pptxcentral tendency.pptx
central tendency.pptx
 
Measures of central tendency 2.pptx
Measures of central tendency 2.pptxMeasures of central tendency 2.pptx
Measures of central tendency 2.pptx
 
Measure of central tendency
Measure of central tendencyMeasure of central tendency
Measure of central tendency
 
Measure of central tendency (2)
Measure of central tendency (2)Measure of central tendency (2)
Measure of central tendency (2)
 

Mehr von Vidya Kalaivani Rajkumar

Mehr von Vidya Kalaivani Rajkumar (20)

Recombinant vaccines-Peptide Vaccines
Recombinant vaccines-Peptide Vaccines Recombinant vaccines-Peptide Vaccines
Recombinant vaccines-Peptide Vaccines
 
Transgenic plants- Abiotic stress tolerance
Transgenic plants- Abiotic stress toleranceTransgenic plants- Abiotic stress tolerance
Transgenic plants- Abiotic stress tolerance
 
Bioreactors in tissue engineering
Bioreactors in tissue engineeringBioreactors in tissue engineering
Bioreactors in tissue engineering
 
Tissue assembly in microgravity
Tissue assembly in microgravityTissue assembly in microgravity
Tissue assembly in microgravity
 
In vivo synthesis of tissues and organs
In vivo synthesis of tissues and organsIn vivo synthesis of tissues and organs
In vivo synthesis of tissues and organs
 
Bioartificial pancreas
Bioartificial pancreasBioartificial pancreas
Bioartificial pancreas
 
Biomaterials for tissue engineering
Biomaterials for tissue engineeringBiomaterials for tissue engineering
Biomaterials for tissue engineering
 
Haematopoietic system
Haematopoietic systemHaematopoietic system
Haematopoietic system
 
Fasta
FastaFasta
Fasta
 
Water vascular system of star fish
Water vascular system of star fishWater vascular system of star fish
Water vascular system of star fish
 
Cephalopodes are advance molluscs
Cephalopodes are advance molluscsCephalopodes are advance molluscs
Cephalopodes are advance molluscs
 
Beat air pollution
Beat air pollution Beat air pollution
Beat air pollution
 
Birth control methods
Birth control methodsBirth control methods
Birth control methods
 
Future of human evolution
Future of human evolutionFuture of human evolution
Future of human evolution
 
Sequence alignment
Sequence alignmentSequence alignment
Sequence alignment
 
Assignment on developmental zoology
Assignment on developmental zoologyAssignment on developmental zoology
Assignment on developmental zoology
 
Development of chick
Development of chickDevelopment of chick
Development of chick
 
Major biological nucleotide databases
Major biological nucleotide databasesMajor biological nucleotide databases
Major biological nucleotide databases
 
Protein structure visualization tools-RASMOL
Protein structure visualization tools-RASMOLProtein structure visualization tools-RASMOL
Protein structure visualization tools-RASMOL
 
Swiss pdb viewer
Swiss pdb viewerSwiss pdb viewer
Swiss pdb viewer
 

Kürzlich hochgeladen

The Mariana Trench remarkable geological features on Earth.pptx
The Mariana Trench remarkable geological features on Earth.pptxThe Mariana Trench remarkable geological features on Earth.pptx
The Mariana Trench remarkable geological features on Earth.pptx
seri bangash
 
Reboulia: features, anatomy, morphology etc.
Reboulia: features, anatomy, morphology etc.Reboulia: features, anatomy, morphology etc.
Reboulia: features, anatomy, morphology etc.
Silpa
 
CYTOGENETIC MAP................ ppt.pptx
CYTOGENETIC MAP................ ppt.pptxCYTOGENETIC MAP................ ppt.pptx
CYTOGENETIC MAP................ ppt.pptx
Silpa
 
development of diagnostic enzyme assay to detect leuser virus
development of diagnostic enzyme assay to detect leuser virusdevelopment of diagnostic enzyme assay to detect leuser virus
development of diagnostic enzyme assay to detect leuser virus
NazaninKarimi6
 
Biogenic Sulfur Gases as Biosignatures on Temperate Sub-Neptune Waterworlds
Biogenic Sulfur Gases as Biosignatures on Temperate Sub-Neptune WaterworldsBiogenic Sulfur Gases as Biosignatures on Temperate Sub-Neptune Waterworlds
Biogenic Sulfur Gases as Biosignatures on Temperate Sub-Neptune Waterworlds
Sérgio Sacani
 
THE ROLE OF BIOTECHNOLOGY IN THE ECONOMIC UPLIFT.pptx
THE ROLE OF BIOTECHNOLOGY IN THE ECONOMIC UPLIFT.pptxTHE ROLE OF BIOTECHNOLOGY IN THE ECONOMIC UPLIFT.pptx
THE ROLE OF BIOTECHNOLOGY IN THE ECONOMIC UPLIFT.pptx
ANSARKHAN96
 
Porella : features, morphology, anatomy, reproduction etc.
Porella : features, morphology, anatomy, reproduction etc.Porella : features, morphology, anatomy, reproduction etc.
Porella : features, morphology, anatomy, reproduction etc.
Silpa
 

Kürzlich hochgeladen (20)

The Mariana Trench remarkable geological features on Earth.pptx
The Mariana Trench remarkable geological features on Earth.pptxThe Mariana Trench remarkable geological features on Earth.pptx
The Mariana Trench remarkable geological features on Earth.pptx
 
CURRENT SCENARIO OF POULTRY PRODUCTION IN INDIA
CURRENT SCENARIO OF POULTRY PRODUCTION IN INDIACURRENT SCENARIO OF POULTRY PRODUCTION IN INDIA
CURRENT SCENARIO OF POULTRY PRODUCTION IN INDIA
 
Reboulia: features, anatomy, morphology etc.
Reboulia: features, anatomy, morphology etc.Reboulia: features, anatomy, morphology etc.
Reboulia: features, anatomy, morphology etc.
 
Proteomics: types, protein profiling steps etc.
Proteomics: types, protein profiling steps etc.Proteomics: types, protein profiling steps etc.
Proteomics: types, protein profiling steps etc.
 
Call Girls Ahmedabad +917728919243 call me Independent Escort Service
Call Girls Ahmedabad +917728919243 call me Independent Escort ServiceCall Girls Ahmedabad +917728919243 call me Independent Escort Service
Call Girls Ahmedabad +917728919243 call me Independent Escort Service
 
FAIRSpectra - Enabling the FAIRification of Analytical Science
FAIRSpectra - Enabling the FAIRification of Analytical ScienceFAIRSpectra - Enabling the FAIRification of Analytical Science
FAIRSpectra - Enabling the FAIRification of Analytical Science
 
Gwalior ❤CALL GIRL 84099*07087 ❤CALL GIRLS IN Gwalior ESCORT SERVICE❤CALL GIRL
Gwalior ❤CALL GIRL 84099*07087 ❤CALL GIRLS IN Gwalior ESCORT SERVICE❤CALL GIRLGwalior ❤CALL GIRL 84099*07087 ❤CALL GIRLS IN Gwalior ESCORT SERVICE❤CALL GIRL
Gwalior ❤CALL GIRL 84099*07087 ❤CALL GIRLS IN Gwalior ESCORT SERVICE❤CALL GIRL
 
CYTOGENETIC MAP................ ppt.pptx
CYTOGENETIC MAP................ ppt.pptxCYTOGENETIC MAP................ ppt.pptx
CYTOGENETIC MAP................ ppt.pptx
 
development of diagnostic enzyme assay to detect leuser virus
development of diagnostic enzyme assay to detect leuser virusdevelopment of diagnostic enzyme assay to detect leuser virus
development of diagnostic enzyme assay to detect leuser virus
 
Atp synthase , Atp synthase complex 1 to 4.
Atp synthase , Atp synthase complex 1 to 4.Atp synthase , Atp synthase complex 1 to 4.
Atp synthase , Atp synthase complex 1 to 4.
 
Clean In Place(CIP).pptx .
Clean In Place(CIP).pptx                 .Clean In Place(CIP).pptx                 .
Clean In Place(CIP).pptx .
 
Biogenic Sulfur Gases as Biosignatures on Temperate Sub-Neptune Waterworlds
Biogenic Sulfur Gases as Biosignatures on Temperate Sub-Neptune WaterworldsBiogenic Sulfur Gases as Biosignatures on Temperate Sub-Neptune Waterworlds
Biogenic Sulfur Gases as Biosignatures on Temperate Sub-Neptune Waterworlds
 
FAIRSpectra - Enabling the FAIRification of Spectroscopy and Spectrometry
FAIRSpectra - Enabling the FAIRification of Spectroscopy and SpectrometryFAIRSpectra - Enabling the FAIRification of Spectroscopy and Spectrometry
FAIRSpectra - Enabling the FAIRification of Spectroscopy and Spectrometry
 
Site Acceptance Test .
Site Acceptance Test                    .Site Acceptance Test                    .
Site Acceptance Test .
 
Grade 7 - Lesson 1 - Microscope and Its Functions
Grade 7 - Lesson 1 - Microscope and Its FunctionsGrade 7 - Lesson 1 - Microscope and Its Functions
Grade 7 - Lesson 1 - Microscope and Its Functions
 
THE ROLE OF BIOTECHNOLOGY IN THE ECONOMIC UPLIFT.pptx
THE ROLE OF BIOTECHNOLOGY IN THE ECONOMIC UPLIFT.pptxTHE ROLE OF BIOTECHNOLOGY IN THE ECONOMIC UPLIFT.pptx
THE ROLE OF BIOTECHNOLOGY IN THE ECONOMIC UPLIFT.pptx
 
Porella : features, morphology, anatomy, reproduction etc.
Porella : features, morphology, anatomy, reproduction etc.Porella : features, morphology, anatomy, reproduction etc.
Porella : features, morphology, anatomy, reproduction etc.
 
Thyroid Physiology_Dr.E. Muralinath_ Associate Professor
Thyroid Physiology_Dr.E. Muralinath_ Associate ProfessorThyroid Physiology_Dr.E. Muralinath_ Associate Professor
Thyroid Physiology_Dr.E. Muralinath_ Associate Professor
 
PATNA CALL GIRLS 8617370543 LOW PRICE ESCORT SERVICE
PATNA CALL GIRLS 8617370543 LOW PRICE ESCORT SERVICEPATNA CALL GIRLS 8617370543 LOW PRICE ESCORT SERVICE
PATNA CALL GIRLS 8617370543 LOW PRICE ESCORT SERVICE
 
Molecular markers- RFLP, RAPD, AFLP, SNP etc.
Molecular markers- RFLP, RAPD, AFLP, SNP etc.Molecular markers- RFLP, RAPD, AFLP, SNP etc.
Molecular markers- RFLP, RAPD, AFLP, SNP etc.
 

Find out Mean, Median, Mode, Standard deviation, Standard Error and Co-efficient of variance using Neem leaves

  • 1. Find out Mean, Median, Mode, Standard deviation, Standard Error and Co- efficient of variance using Neem leaves Aim: To find out Mean, Median, Mode, Standard Deviation, Standard error and Coefficient of variance using neem leaves. Principle: Measures of central tendency is a summary statistic that represent the center point or typical value of a data set. This value lies between the minimum and maximum values. It is generally located in the center or middle of the variables. While measures of central tendency are used to estimate "normal" values of a dataset, measures of dispersion are important for describing the spread of the data, or its variation around a central value. Two distinct samples may have the same mean or median, but completely different levels of variability or vice versa. In order to have a correct analysis of a much scattered series, a study of the extent of the scatters around on average should be studied. Procedure: Serrated edges of neem leaves are taken as a raw data or ungrouped data. They are arranged in an array. Then the data are grouped with class interval. Statistical Method: Following statistical methods are used in the analysis of data. Mean: It is defined as the sum of measurements divided by the total number of measurements. When data are grouped the mean is calculated by the formula. 𝑥̅ = ∑𝑓𝑥 𝑁 𝑥̅ = Sample Mean ∑ = Summation f = Frequency x = Individual measurements N = Total number of leaves in the samples
  • 2. Mean for grouped data with class interval is calculated by the formula. 𝑥̅ = ∑𝑓𝑚 𝑁 ∑ = Sum f = Frequency m = Midvalues N = Total number Median: Median of a sample is the middle number in a array when the number of observation is odd. Median is = Value of ( 𝑁+1 𝑡ℎ 2 ) items Median for grouped data with class interval is calculated by the formula. Median = 𝐿 + ( 𝑁 2 −𝑐𝑓 𝑓 ) × 𝑐 L = Lower limit of median class N = Total frequency Cf = Cumulative frequency prior to median class C = Class interval of the median class F = Frequency of the median class Mode: It is defined as the value of variable which occurs most frequency in a distribution mode for grouped data with class interval is calculated by the formula. Mode = 𝐿 + [ ∆1 ∆1+∆2 ] × 𝐶 L = Lower limit of the mode class ∆1 = The difference between the frequency of modal class (f1) and the frequency proceeding modal class (f0):∆1 = f1 – f0 ∆2 = The difference between the frequency of the modal class (f1) and the frequency of succeeding modal class (f2): ∆2 = f1 – f2.
  • 3. C = Class interval of modal class. F1 = Frequency of modal class F0 = Frequency of proceeding modal class F2 = Frequency of succeeding modal class Standard Deviation: It is defined as the positive square root of mean of the squares of deviation from the mean standard deviation for a grouped data can be calculated by the formula SD = √∑𝑓(𝑥−𝑥̅)2 ∑𝑓 SD for the data with class interval can be calculated by the formula. SD = √∑𝑓(𝑚−𝑥̅)2 ∑𝑓 Co-efficient of variation: The measure is obtained by dividing standard deviation by mean and multiplied by 100. CV = 𝑆𝐷 𝑀𝑒𝑎𝑛 × 100 Standard Error: Standard error is the ratio of standard deviation of the sample divided by square root of the total number of deviation. Standard error = 𝑆𝐷 √ 𝑁 Raw data:
  • 4. Systematic data: Result: Mean = Median = Mode = Standard deviation = Standard error = Co-efficient of variation = Classes (x) Mid value (m) Frequency(f) fm 𝒅 = (𝒎 − 𝒙̅) 𝒅 𝟐 𝒇 × 𝒅 𝟐