SlideShare ist ein Scribd-Unternehmen logo
1 von 240
Downloaden Sie, um offline zu lesen
 
Mitacs Accelerate Project
Final Report
Comparative assessment of NH3 production and utilization in transportation
systems for Ontario
Period:
May-November 2015
Submission Date:
November 23, 2015
Supervisor:
Prof. Dr. Ibrahim Dincer
Intern:
Yusuf Bicer
Partner Organization:
Hydrofuel Inc.
Application Ref: IT05701
Funding Request Ref: FR11885
Invoice Ref: 1516-10898
Mitacs File: ON – IRDI
1 
 
TABLE OF CONTENTS
Table of Contents...........................................................................................................................1
Acknowledgment............................................................................................................................2
Summary.........................................................................................................................................3
I. Feasibility Analysis.....................................................................................................................4
1. Feasibility analysis of high-pressure electrolysis based ammonia production............................4
1.1 Economic analysis of high pressure PEM electrolyzer based hydrogen and ammonia
production ......................................................................................................................................17
2. Feasibility analysis of cryogenic air separation for nitrogen production in ammonia synthesis
........................................................................................................................................................19
2.1 Air separation unit cost analysis ..............................................................................................20
3. Feasibility analysis of Haber-Bosch ammonia synthesis loop...................................................22
4. Feasibility analysis of electrolyzers in hydrogen production process .......................................26
II. Case Studies.............................................................................................................................29
Conclusions...................................................................................................................................47
Nomenclature ...............................................................................................................................48
References.....................................................................................................................................49
Appendix 1: Progress Report 1 (May-August 2015).................................................................52
Appendix 2: Progress Report 2 (August-October 2015) ..........................................................96
2 
 
ACKNOWLEDGEMENT
The principal investigator and intern acknowledge the financial support provided by the Mitacs
and Hydrofuel Inc.
3 
 
SUMMARY
In this final project report, detailed cost and feasibility analyses of selected cases are conducted.
The case studies included in this report are as follows: (i) high pressure electrolysis using low cost
hydropower electricity and Haber-Bosch based ammonia production; (ii) high pressure electrolysis
using low cost hydropower electricity, liquefied nitrogen pumping and no main compressor Haber-
Bosch based ammonia production; (iii) ammonia production using high pressure electrolysis via
low cost hydropower electricity, liquefied nitrogen pumping, liquid nitrogen vaporization using
Haber-Bosch excess heat without compressors; (iv) ammonia production using thermal plasma
disassociation of methane and vaporization of high pressure liquid nitrogen via excess heat in
Haber-Bosch process; (v) comparison of pumped hydro storage and ammonia production using
excess power; (vi) wind based electrolysis based hydrogen production with Haber-Bosch process;
(vii) nuclear high temperature electrolysis based ammonia production options.
The results of this project report indicates that the compression cost of hydrogen to about
20 bar corresponds to 1.03 $/kg H2 which constitutes approximately 15% of the overall hydrogen
production cost. Therefore, high pressure water electrolysis system is an alternative option for
reducing the required power of ammonia synthesis process by eliminating the main compressors
in the ammonia synthesis process. Utilizing high pressure PEM electrolyzers have the capability
to reduce hydrogen production cost about 0.40 $/kg compared to mechanical compression. Using
pressurized water require less power than using hydrogen compressor which decreases the required
power. The lowest cost of high pressure electrolysis based ammonia production is calculated to be
0.76 US $/kg for 3.5 US cent/kWh electricity price.
Thermal plasma disassociation of methane is an alternative option for ammonia production
which brings approximately 20% less power input. When carbon black sales are considered, the
cost of ammonia can decrease down to 0.42 $/kg which is quite lower than other methods.
However, the process of liquefied natural gas production and the effect of high pressure need to
be analyzed in detail in order to assess the overall performance.
At present, the average ammonia selling price is about 770 US$/ton in the USA. In the case
where the ammonia production cost was achieved under 700 US$/ton, the pumped hydro storage
plant yearly profit would be nearly same with a 300 ton/day ammonia production plant profit with
a power requirement of 145 MW. However, the capital installation cost of pumped storage hydro
plant becomes nearly twice of ammonia plant.
Nuclear based ammonia production options are cost competitive than other methods
however the initial investment costs are much higher. The high capital costs are the major
disadvantage of nuclear powered ammonia production however, by enabling smaller and
standardized modular reactors, it could reduce the capital costs, construction cost and time,
licensing cost and time. Developed Haber-Bosch technology would be optimized using liquid
pumping instead of feed gases compression, high pressure electrolysis and liquid nitrogen and
LNG vaporization via excess heat of Haber-Bosch reactor.
Furthermore, the previously completed progress reports are appended to this current report.
4 
 
I. FEASIBILITY ANALYSIS
In this section, the feasibility analysis of high pressure electrolysis, Haber-Bosch process,
cryogenic air separation, ammonia synthesis loop are conducted and the total investment costs are
comparatively assessed.
1. Feasibility analysis of high-pressure electrolysis based ammonia production
In high temperature electrolysis process, the modification to a normal proton exchange membrane
electrolyzer is that instead of having an atmospheric pressure hydrogen as end product, compressed
hydrogen is produced between 120–200 bar at 70°C-120°C. Therefore, by pressurizing the
hydrogen in the electrolyzer instead of pressurizing in the compressor, the necessity for an external
hydrogen compressor is eliminated. The advantages and disadvantages of high pressure PEM
electrolysis can be listed as in Table 1.
Table 1. The advantages and disadvantages of high pressure PEM electrolysis
Advantages Disadvantages
Elimination of multiple stage
mechanical compression.
Loss of stack seals and membrane
extrusion into fluid ports
Decrease in complexity of the system.
Need of improved strength without
effecting conductivity
Lower drying requirement
Increasing membrane degradation with
operating pressure
Less maintenance requirement
Important growth in chemical degradation
rate under high pressure operation
No moving parts
Low resistance because of thin
membranes, allowing efficient operation
at high current densities.
No contaminants
Similar faradaic losses in PEM fuel cells
and electrochemical hydrogen
compressors under same operating
conditions and membrane selection
Flexibility of hydrogen production at
end user site
High back diffusion
Source: Data from Ref. [1].
Although there are some drawbacks of high pressure PEM electrolysis systems, together with the
improvements, the advantages in cost reduction makes this technology promising for the near
future hydrogen production options.
5 
 
Fig. 1. Electrolysis based hydrogen production and delivery cost contribution from different
processes in $/kg (data from Ref. [1])
As it can be seen in Fig. 1, delivery cost of hydrogen after production constitutes approximately
38 % of the overall cost. Delivery does not only include transmission but also compression of the
hydrogen after production at standard pressures. The detailed cost distribution of delivery process
for hydrogen is illustrated in Fig. 2. The compression cost of hydrogen to about 20 bar is 1.03$/kg
which corresponds to 15% of the overall cost. The DOE Forecourt H2A Model (Ver. 3.0) was used
to project the cost of hydrogen production with the high pressure electrolysis technology.
Tradeoffs of operating pressure, system efficiency and capital costs were conducted using a
standard set of assumptions and cost parameters. The cost of electricity is considered as
US$0.061/kWh [1, 2].
Fig. 2. Hydrogen compression and delivery cost contribution from different sub-processes in
$/kg (data from Ref. [1])
$0.10 $0.30
$0.70
$2.50
$3.00
Variable Costs
Fixed O&M
Capital Costs
Compression,Storage and
Dispensing
Feedstock Costs
$1.03
$1.04
$0.10
$0.16 $0.14
Compression
Storage
Dispenser
Refrigiration
Remainder of Station
6 
 
Fig. 3. Cost of compression in high pressure PEM electrolyzer (data from Ref. [1])
Fig. 3 and Table 2 show that if high pressure electrolyzer is used at 432 bar, the compression cost
decreases to 0.31 US$/kg but feedstock cost increase becomes 0.31 US$/kg. The cost of electricity
is considered as US$0.061/kWh. As mentioned previously, The DOE Forecourt H2A Model was
used for the cost calculations.
Table 2. Cost comparison of using compressors or high pressure electrolyzers
Pressure
(bar)
Compression Cost
($/kg)
Additional Feedstock Cost
($/kg)
Total Cost
($/kg)
21 1.03 0 1.03
431 0.31 0.31 0.62
874 0.12 0.49 0.61
Source: Data from Ref. [1]
The cost of electricity is considered as US$0.061/kWh for this comparison. As seen in
above Fig. 3 and Table 2, there is about US$0.40 (40%) cost reduction compared to mechanical
compression when high pressure PEM electrolyzer is utilized.
A differential pressure PEM electrolysis system consists of a number of bipolar cells
stacked in electrical series, with each cell containing a membrane-electrode assembly (MEA)
formed by bonding anode and cathode electrodes to opposing sides of the membrane. The MEA
is in contact with electrically conductive anode and cathode support structures located in the
oxygen and hydrogen chambers, respectively. An electrically conductive cell separator is located
between the anode and cathode chambers of adjacent cells. In the process, high-purity water is
pumped to the anode, where it is electrochemically decomposed to oxygen gas, hydrogen ions and
electrons. The hydrogen ions move through the PEM and the electrons move through the external
circuit to the cathode, where they recombine to form hydrogen. An excess of water is supplied to
1.03
0.31
0.12
1.03
0.62 0.61
0
0.2
0.4
0.6
0.8
1
1.2
21 bar 431 bar 874 bar
Hydrogen compression cost ($/kg)
PRESSURE
Compression Cost ($/kg) Total Cost ($/kg)
7 
 
the oxygen side of the cell and is recirculated to remove waste heat from the MEA. A portion of
the excess water is electro-osmotically transported across the PEM with the hydrogen ions. The
electrochemically-transported water is separated from the product hydrogen and returned to the
water stream. PEM cells operate efficiently at current densities of 2000 to 3000 mA/cm2
, compared
to alkaline electrolyzers that typically operate at less than 300 mA/cm2
. At this current density, the
alkaline cell voltage is typically 1.9 V or higher. The operating cell voltage of the currently
analyzed 15-kW PEM electrolyzer is lower, 1.85 V, at a current density nearly an order of
magnitude higher, 2000 mA/cm2
at 300 psig (2170 kPa) H2. In the study, the electrolyzer
demonstrated a PEM electrolysis cell based on an advanced membrane that operates at 1.7 V at
2000 mA/cm2
. Since the cost of electricity is the major contributor to the cost of hydrogen
produced by electrolysis, efficient operation is a key to low-cost hydrogen production for large
applications. Although the capital cost of PEM electrolyzer stacks is higher than that of alkaline
stacks on an area basis, the much higher current density of PEM cells allows the stacks to be
smaller by a factor of 5 to 10, while achieving high efficiency. Thus, in large-scale production,
and with development of lower-cost materials and manufacturing methods for key components,
the capital cost of a PEM stack is expected to be competitive with alkaline stacks, while the
electricity consumption of the PEM stack will be significantly lower than that of the alkaline stack.
Another key advantage of the PEM technology is the ability to operate the stack at a high
differential pressure, allowing hydrogen to be produced at high pressure, while oxygen is
produced, and the reactant water is supplied, at near atmospheric pressure. Production of hydrogen
in the electrolyzer at elevated pressure provides some system advantages, decreasing the number
of stages of mechanical compression required to store the product hydrogen at greater than 5000
psig (34.6 MPa) [2].
The price for electrolyzer with electrochemical and mechanical compression seems to be
similar at large scale production [3]. Price advantage for electrochemical compression may be
obtained at decentralized energy supply for < 1 MW [3]. High pressure hydrogen electrolysis at
present time may be efficient or reasonable from economic point of view up to operating pressure
200-300 bar [3]. Electrochemical compression of hydrogen creates problems with gas purity,
current efficiency, platinum metals loading and life-time mainly at often turn off - turn on cycles
[3]. The change in current efficiency with varying pressure values in PEM electrolyzer are given
in Fig. 4. If the pressure increases, current efficiency tends to decrease. The conditions in the Fig.
4 were: current density is 1000 mA/cm2
, operating voltage is 1.70-1.73 V and operating
temperature is 80 °C with a modified membrane of 250 micrometers.
Fig. 4. Pressure vs current efficiency in PEM electrolyzer under given conditions (data from Ref.
[3])
99
96
93
90
84
86
88
90
92
94
96
98
100
1 30 130 300
Current efficiency (%)
Pressure (bar)
8 
 
High pressure hydrogen could be generated by using compressor which will deliver
hydrogen from 1 atm to higher pressure, or using pump to supply pressurized water. Using pump
instead of compressor requires less power than compressor [4]. Therefore, the current industry
trend is to greatly pressurized electrolyzers to abolish classical mechanical compressors for
efficiency enhancement. When the efficiency of the compressor and the pump are assumed to be
50%, it is realized that hydrogen produced by using pressurized water require less power than
using hydrogen compressor. The required power difference is about 15% which is a significant
amount. The advantage of using pressurized water via pump instead of power consuming
compressor was demonstrated as seen in Figs. 5 and 6.
Fig. 5. Comparison of high pressure electrolysis and atmospheric electrolysis required work
inputs (data from Ref. [5])
Fig. 6. Energy use of a solid polymer electrolyzer at different temperature and pressure values
(data from Ref. [5])
260
262
264
265
266
267
267.5
284
297
307
314
321
326
331
100 200 300 400 500 600 700
Required work rate (kW)
Pressure (bar)
Electrolyzer and Pump Work (kW) Electrolyzer and Compressor Work (kW)
Linear (Electrolyzer and Pump Work (kW)) Linear (Electrolyzer and Compressor Work (kW))
0
5
10
15
20
25
30
35
40
45
50
1 50 100 500 700
Energy use (kWh/kg H2)
Pressure (bar)
320 K 373 K 523 K Linear (320 K)
9 
 
Fig. 6 represents the increase in power consumption of a PEM electrolyzer when the
pressure increases. However, rising temperature has positive effect on efficiency yielding lower
power consumption. The electrolyzer consumes about 46 kWh/kg H2 energy at 100 bar and 320 K
while the energy consumption goes down to about 38 kWh/kg H2 at same temperature and 523 K.
Therefore, rising the temperature positively affect the electrolysis efficiency where high
temperature and high pressure electrolysis can be combined.
The following assumption are made for the cost calculations of electrolysis, transportation,
storage and production systems in the next section as given in Ref. [6, 7]:
 The H2A Distributed Production Model 3.0 used alkaline electrolysis parameters to generate
the values.
 The H2A Distributed Production Model 3.0 was used with the standard economic assumptions:
all values are in 2007 dollars, 1.9% inflation rate, 10% after tax real internal rate of return,
100% equity financing, 20-year analysis period, 38.9% overall tax rate, and 1% working
capital. The plant design capacity is 1,500 kg/day of hydrogen. It is assumed that Design for
Manufacture and Assembly (DFMA) would be employed and that production would have
realized economies of scale.
 The plant production equipment availability is 98% including both planned and unplanned
outages; four unplanned outages of 14h duration per year; 1 planned outage of 5 days duration
per year. The plant usage factor is defined as the actual yearly production/equipment design
production capacity and is 90% based on over sizing of the production equipment to
accommodate a summer surge in demand of 10% above the yearly average demand.
 The levelized cost is equivalent to the minimum required selling price to achieve a 10% annual
rate of return over the life of the plant.
 Electrolyzer cells capital replacement is 25% of total purchased capital every 7 years
 The 2015 status of transmission pressure is based on the maximum operating pressure of
hydrogen pipelines as of March 2015. The 2020 target is set to lower compression requirements
at the forecourt.
 Hydrogen leakage is hydrogen that permeates or leaks from fittings, etc., as a percent of the
amount of hydrogen carried by the pipeline. The 2015 status and future targets are based on
industry consultation, along with the assumption that leak rates from hydrogen pipelines will
be no higher than those from current natural gas pipeline infrastructure.
 Pipeline lifetime refers to the minimum time period that the pipeline must remain in service to
justify the capital cost of its installation. The 2020 and ultimate targets are intended to be at
least equivalent to that of natural gas pipeline infrastructure. The actual life of a pipeline can
exceed its design life.
 The leak rate refers to hydrogen losses through the pipeline material and/or fittings. The current
status and future targets are based on the use of fiber-reinforced composite piping (FRP).
 Tube trailer terminals large enough to serve a mature market (~ 70,000 kg/day) do not presently
exist. Such terminals would likely be located near production plants and require storage
capacity (at about 100 bar) to buffer differences between production rates and rates of trailer
filling. The compressors in 2015 do not seem to have sufficient capacity to meet the needs of
a terminal in a mature market. The 2020 target is based on the capacity that would be necessary
to satisfy the truck refueling needs of a terminal in a mature market with about 20 compressors
in parallel and 5 redundant compressors.
10 
 
Fig. 7. Pipeline, terminal and geologic compressors based hydrogen transportation (adapted from
Ref. [6])
In general, geological storage is typically employed to store a large amount of gas in the
field of infrastructure for supplying natural gas 150-200 bar pressure medium. In order to reduce
the gas loss, usually salt domes are used forming a cavity. One has been operating for several
years, two more are recently built in Texas, the United States of America, Lake Jackson, Texas, as
a salt cave site hydrogen storage. Demand for road transport fuel will be significantly higher in
summer than in winter. In the summer the cost of the ban, there is the potential to meet this growing
demand, by hydrogen storage capacity of hydrogen in the fuel system. Geological type storage is
very cost-effective way, and the effective use of natural gas is also possible [6].
Note that the compression process may vary according to the capacity and use of
pressurization. Transport pipelines, high flow rate of at least 10 MPa, at a relatively low pressure
and compression ratio (10: 1) are required. On the other hand, at fueling stations, flow compressors
5-100 kg/h and the pressure can be as high as 100 MPa. Installation of terminals tend to have
temporary needs. High flow rate of reciprocating compressors are often used to transport pipelines
and terminals used for excitation of the hydrogen cell pressure vessel installation and high-pressure
diaphragm compressors. The pipeline, terminal and geologic compressors based hydrogen
transportation and the related cost analysis are given in Fig. 7 and Table 3.
Table 3. Hydrogen delivery components cost analysis for pipeline, terminal and geologic
compressors for 200,000 kg/day hydrogen capacity and 20 bar inlet pressure (estimated)
Category 2015 2020
Compressor specific energy (kWh/kg) 0.82 0.82
Discharge pressure (bar) 100 100
Uninstalled capital cost (million $) 5.5 3.6
Availability 85% 90%
Annual maintenance cost (% of installed capital cost) 6% 4%
Source: Data from Ref. [6]
The pipeline capital costs are from HDSAM (Hydrogen delivery scenario analysis model)
V2.3 prepared by US DOE. The model assumes that a hydrogen pipeline costs 10% more to
construct than a natural gas pipeline of the same diameter and length. The assumption of a 10%
premium for hydrogen lines was based on discussions with industrial gas companies that build and
operate the current system of hydrogen pipelines in the U.S [6, 7]. The 2015 status and future
targets are based on distribution pipelines being built out of fiber-reinforced composite material.
The 2015 distribution pressure is based on the current rating of fiber-reinforced composite pipe.
11 
 
The ultimate target has been set to enable the pipeline delivery pathway to meet its ultimate cost
target.
Fig. 8. Tube trailer based hydrogen transportation system (adapted from Ref. [6])
Pipelines carrying large volumes for hydrogen perceived cost-effective way. Because of
the high capital investment for pipelines, however, there must be a steady, high-volume gas
demand to justify the investment cost. Distribution line pressure of 1-5 MPa (10-50 bar), while the
transmission line pressures are generally in the range of 3-15 MPa (30-150 bar) are available.
Materials are soft and low carbon steels. Embrittlement concerns for these materials are far less
than for higher strength steels and are further mitigated by proper pipeline design. Long pipelines
for liquid hydrogen are currently cost prohibitive.
The compressor specific energy is calculated by energy consumption for every unit of
hydrogen compressed (kWh/kg) at the specified inlet pressures, discharge pressures, and
capacities. The current metric characterizes the isentropic efficiency, losses, motor efficiency, and
motor size of a large compressor. Large compressor capital costs were derived from cost data
supplied by various vendors for two- and three-stage reciprocating compressors. HDSAM V2.3
had been used to estimate the motor power that a reciprocating compressor of the specified size
(200,000 kg/day from 20 bar to 100 bar) would require, and to then estimate the compressor cost
corresponding to that power. The 2015 status is instead based on cost projections for an existing
centrifugal design, which is likely to be preferable to reciprocating compression because of better
reliability. The 2020 and ultimate targets are based on cost reductions. Hydrogen can leak through
compressor seals. The 2015 status of leak rate was based on typical ratings of hydrogen compressor
seals. Future targets are set to ensure leak rates do not exceed the current status. Annual
maintenance cost status was derived from a reliability analysis completed by Concepts NREC for
the 240,000 kg/day centrifugal compressor which is about $0.005/kWh. HDSAM V2.3 was used
to determine the kWh the compressor would consume in a year [6, 7].
Table 4. Tube trailer terminal truck refueling compressors cost analysis for 300 kg/h hydrogen
capacity and 100 bar inlet pressure (estimated)
Category 2015 2020
Compressor specific energy (kWh/kg) 1.1 1.1
Capacity (kg/h) 40 300
Discharge pressure (bar) 550 550
Uninstalled capital cost ($) 250,000 450,000
Availability 90% 90%
Annual maintenance cost (% of installed capital cost) 10% 2%
Source: Data from Ref. [6]
12 
 
The tube trailer based hydrogen transportation system and their cost analysis are given in Table 4
and Fig.8. The individual component targets for 2020 have been set such that the tube trailer
delivery pathway meets the cost target of $2.00/gge of hydrogen. The ultimate targets have been
set such that the pipeline delivery and liquid hydrogen delivery pathways both achieve a cost of
<$2.00/gge. Ultimate targets were not set for the tube trailer pathway because it is expected that
gaseous hydrogen will be delivered primarily by pipelines in a mature, high-volume market. The
most common pressure vessel construction is the Type 1 steel tube. These are capable with a
storage capacity of gaseous hydrogen under a pressure of 13.5 41 MPa (135-410 bar) and bonded
together to increase the overall storage capacity. Storage pressure vessels, ships carrying container
depends on the size and construction design is based on the regulations. Current carrying capacity
of steel pipe trailer (~ 18 MPa or 180 bar) hydrogen is limited. Because of the limited amount of
hydrogen that can be transported by steel tube trailer, this transport approach is economically
constrained to a radius of ~300 km from the point of production. Hydrogen gas delivery can be
with the railway or may be provided with vessels and barges. Composite pressure vessels are also
available. Typically these cost more than steel vessels of equivalent size, but generally will store
hydrogen at higher pressures and capacity, and storage costs on per kg of hydrogen stored basis
are often lower [6, 7].
Table 5. Costs of stationary hydrogen gas storage tanks (estimated)
Stationary hydrogen gas storage tanks
2015
($/kg hydrogen
stored)
2020
($/kg hydrogen
stored)
Purchased capital cost for low pressure 160 bar 850 500
Purchased capital cost for moderate pressure 430 bar 1,100 600
Purchased capital cost for high pressure 925 bar 2,000 600
Source: Data from Ref. [6]
If the hydrogen is produced at the required purity specifications, then design of the delivery
infrastructure must either guard against contamination or provide for a final purification step just
prior to dispensing. Alternatively, hydrogen could be produced at lower purity levels and purified
to specification further downstream along the delivery pathway prior to dispensing. Purchased
capital costs of stationary hydrogen gas storage tanks are given in Table 5.
Table 6. Distributed forecourt water electrolysis hydrogen production (estimated)
Characteristics 2015 2020
Hydrogen Levelized Cost (Production Only) ($/kg) 3.9 2.3
Electrolyzer System Capital Cost ($/kg) 0.5 0.5
System Energy Efficiency (%) 72 75
System Energy Consumption (kWh/kg) 46 44
Stack Energy Efficiency (%) 76 77
Stack Energy Consumption (kWh/kg) 44 43
Source: Data from Ref. [6]
13 
 
These individual targets were based on the current status of the technology and the potential for
technological advancements in the future. The status of these technologies was determined through
consultations with stakeholders and industry [6, 7]. The cost contributions of various processes in
distributed water electrolysis based hydrogen production system are given in Tables 6 and 7. Costs
for the forecourt station compression and storage are consistent. Storage capacity for 1579 kg of
hydrogen at the forecourt is included. It is assumed that the hydrogen refueling fill pressure is
10,000 psi in 2015 and 2020. The comparison of stationary hydrogen tanks under various pressures
is given in Fig. 9 based on $/kg price.
Fig. 9. Comparison of costs for stationary hydrogen gas storage tanks (data from Ref. [6])
As indicated in Fig. 9, various effective pressures are likely for stationary storage purposes
in a hydrogen delivery infrastructure. Low pressure storage will be necessary at terminals and
fueling stations supplied by pipelines. Moderate pressure storage will be necessary at 350 bar
refueling stations, and high-pressure storage will be necessary at 700 bar refueling stations. The
2015 values represent the packaged cost of standard steel and composite tanks, including the costs
of paint, cleaning, and mounting necessary to transport the tanks; this cost does not, however,
include installation at the final destination. Because the cost of storage is highly dependent on the
tank size. The ultimate target for tank size is smaller in order to create a more aggressive target on
a $/kg stored basis [6, 7].
Table 7. Distributed electrolysis cost contributions (estimated)
Characteristics 2015 2020
Electrolysis System ($/kg hydrogen) 0.5 0.5
Electricity ($/kg hydrogen) 3.1 1.6
Production Fixed O&M ($/kg hydrogen) 0.2 0.2
Production Other Variable Costs ($/kg hydrogen) 0.1 <0.10
Hydrogen Production ($/kg hydrogen) 3.9 2.3
Compression, Storage, and Dispensing ($/kg hydrogen) 1.7 1.7
Total Hydrogen Levelized Cost (Dispensed) ($/kg hydrogen) 5.6 4
Source: Data from Ref. [7]
850
1,100
2,000
500
600
600
0 500 1000 1500 2000
Low pressure 160 bar
Moderate pressure 430 bar
High pressure 925 bar
Purchased Capital Cost of Hydrogen Storage Tanks ($/kg hydrogen stored)
2020
2015
14 
 
The electricity cost is assumed to be 3.7¢/kWh for the year 2020 only. Distributed
electrolysis based hydrogen production cost contributions are given in Fig. 10. Furthermore, the
central water electrolysis in high amounts yield lower costs as seen in Table 8 and Table 9. The
cost of central electrolysis based hydrogen can decrease down to 3.2 $/kg as illustrated in Fig. 11.
Fig. 10. Distributed electrolysis cost contributions (estimated) (data from Ref. [7])
Note that system energy efficiency is defined as the energy in the hydrogen produced by
the system on a LHV basis divided by the sum of the feedstock energy as LHV plus all other
energy used in the process. Stack energy efficiency is defined as the energy in the hydrogen
produced by the stack on a LHV basis divided by the electricity entering the stack. Additional
electricity use for the balance of plant is not included in this calculation. Hydrogen cost is
calculated assuming purchase of industrial grid electricity. The average electricity price is taken
to be $0.070/kWh ($0.069/kWh effective).
Table 8. Central water electrolysis hydrogen production (estimated)
Characteristics 2015 2020
Hydrogen Levelized Cost (Plant Gate) ($/kg) 3.2 2
Total Capital Investment ($M) 51 40
System Energy Efficiency (%) 73 75
System Energy Consumption (kWh/kg) 46 44.7
Stack Energy Efficiency (%) 76 78
Stack Energy Consumption (kWh/kg) 45 44
Electricity Price 0.05 0.03
Source: Data from Ref. [7]
0.5
1.6
0.2
0.1
2.3
1.7
4
0.5
3.1
0.2
0.1
3.9
1.7
5.6
0 1 2 3 4 5 6
Electrolysis System
Electricity
Production Fixed O&M
Production Other Variable Costs
Hydrogen Production
Compression, Storage, and Dispensing
Total Hydrogen Levelized Cost (Dispensed)
Cost ($/kg)
2015 2020
15 
 
The H2A Distributed Production Model 3.0 was used with the standard economic
assumptions: all values are in 2007 US dollars, 1.9% inflation rate, 10% after tax real internal rate
of return, 100% equity financing, 20-year analysis period, 38.9% overall tax rate, and 1% working
capital. The plant design capacity is 1,500 kg/day of hydrogen. It is assumed that Design for
Manufacture and Assembly (DFMA) would be employed and that production would have realized
economies of scale.
Table 9. Central water electrolysis cost contributions (estimated)
Characteristics 2015 2020
Capital cost ($/kg) 0.5 0.4
Feedstock cost ($/kg) 2.3 1.4
Fixed O&M cost ($/kg) 0.1 0.1
Other variable costs ($/kg) 0.1 0.1
Total Hydrogen Levelized Cost (Plant Gate) ($/kg) 3.2 2
Source: Data from Ref. [7]
The plant production equipment availability is 98% including both planned and unplanned
outages; four unplanned outages of 14h duration per year; 1 planned outage of 5 days duration per
year. The plant usage factor is defined as the actual yearly production/equipment design production
capacity and is 90% based on over sizing of the production equipment to accommodate a summer
surge in demand of 10% above the yearly average demand. The levelized cost is equivalent to the
minimum required selling price to achieve a 10% annual rate of return over the life of the plant.
The electrolyzer cells capital replacement is 25% of total purchased capital every 7 years [7].
Fig. 11. Central water electrolysis cost contributions (estimated) (data from Ref. [7])
0.4
1.4
0.1
0.1
2
0.5
2.3
0.1
0.1
3.2
0 0.5 1 1.5 2 2.5 3 3.5
Capital cost
Feedstock cost
Fixed O&M cost
Other variable costs
Total Hydrogen Levelized Cost (Plant Gate)
Cost ($/kg)
2015 2020
16 
 
Fig. 12. Average electricity prices for large power consumers higher than 5 MW in North
America in Canadian cent/kWh (adapted from Ref. [8])
The electricity rates effective April 1, 2015 sets out Hydro-Québec’s rates, as approved by
the Québec energy board in accordance with Decision D-2015-033. Taxes are not included in the
calculations. These bills have been estimated by Hydro-Québec and may differ from actual bills.
The electricity prices in the tables and figures are based on Canadian dollars [7].
Fig. 13. Comparative index of electricity prices for large-power customers with a monthly
consumption of 3,060,000 kWh and a power demand of 5,000 kW (data from Ref. [8])
4.02
4.22
4.74
4.77
4.9
5.55
5.84
6.13
6.55
7.14
8.9
10.02
0 2 4 6 8 10
Average electricity price (CAD cent/kWh)
Halifax, NS
Charlottetown, PE
Moncton, NB
Regina, SK
Ottowa, ON
Vancouver, BC
Toronto, ON
Montreal, QC
St.John's, NL
Calgary, AB
Edmonton, AB
Winnipeg, MB
17 
 
The results presented in Fig. 13 and Table 10 show the total bill for various consumption
levels. If the bill is calculated according to an unbundled rate, it includes all components, including
supply, transmission and distribution. The electricity prices in Canada are given in Fig. 13 and
Table 10 in Canadian dollar. The lowest electricity cost is calculated for Winnipeg.
Table 10. Large power average electricity prices effective on April 1, 2015 in CAD cent/kWh
Power demand 5 MW 5 MW 10 MW 30 MW 50 MW 50 MW
Load factor 0.65 0.85 0.80 0.81 0.65 0.85
Price (CAD cent/kWh)
Montreal, QC 5.76 5.17 5 4.97 5.4 4.9
Calgary, AB 5.04 4.76 4.8 4.78 5.01 4.74
Charlottetown, PE 9.63 8.9 9.05 9.01 9.63 8.9
Edmonton, AB 7.61 6.97 4.47 4.32 4.57 4.22
Halifax, NS 10.66 10.02 10.15 10.12 10.66 10.02
Moncton, NB 8.24 7.48 7.27 7.24 7.81 7.14
Ottawa, ON 9.87 9.3 10.31 6.9 6.83 6.13
Regina, SK 8.36 7.81 6.72 6.63 6.94 6.55
St. John’s, NL 8.93 8.65 8.61 4.82 5.1 4.77
Toronto, ON 9.28 9.22 5.7 5.64 6.05 5.55
Vancouver, BC 7.58 7.04 5.93 5.91 6.25 5.84
Winnipeg, MB 5.08 4.67 4.08 4.07 4.33 4.02
Source: Data from Ref. [8]
1.1 Economic analysis of high pressure PEM electrolyzer based hydrogen and ammonia
production
The DOE H2A model was used to project the cost of hydrogen production with the high pressure
electrolysis technology and to determine the lowest cost system design. The costs are given in US
dollars in this section. The H2A model was run for production of 1500 kg H2/day at a forecourt
filling station.
The capital and operating costs include a compressor for increasing the hydrogen pressure
from the stack operating pressure to the DOE target storage pressure of 6250 psig (43.2 MPa). The
cost of hydrogen produced using the high pressure PEM electrolysis technology was analyzed as
a function of four operating pressures, ranging from 100 psig (0.79 MPa) to 5000 psig (34.6 MPa),
and three current densities: 1000, 2000 and 3000 A/ft2
(929, 1858 and 2787 mA/cm2
, respectively).
Analysis was conducted for two electricity rates: (i) $0.05/kWh for industrial electricity where the
results are shown in Table 11; and (ii) a lower cost of $0.035/kWh. Where the results are shown
in Table 12. At the higher electricity cost ($0.05/kWh), the lowest projected cost for hydrogen
production is $3.77/kg, for an electrolyzer designed to operate at 100 psig (0.79 MPa) and a
moderate current density of 1858 mA/cm2
[2].
18 
 
Table 11. Cost of hydrogen for high pressure electrolysis based on electricity price of 5
cents/kWhPressure(bar)
Currentdensity
(mA/cm2
)
Cellvoltage(V)
Cellpower
consumption
(kWh/kgH2)
StackProjected
Capital
Costs($K)
Compressor
Capital
Costs($K)
TotalProjected
Capital
Costs($K)
H2cost($/kg)
Capital
H2cost($/kg)
Electricity
H2cost($/kg)
O&M
H2cost($/kg)
Total
345 929 1.807 52.9 2204 0 5050 2.23 3.02 0.86 5.95
345 1858 2.016 52.9 1054 0 3085 1.37 3.26 0.59 5.06
345 2787 2.218 61.2 691 0 2474 1.1 3.56 0.51 5.01
Source: Data from Ref. [2]
Table 12. Cost of hydrogen for high pressure electrolysis based on electricity price of 3.5
cents/kWh
Pressure(bar)
Current
density
(mA/cm2
)
Cellvoltage(V)
Cellpower
consumption
(kWh/kgH2)
StackProjected
Capital
Costs($K)
Compressor
Capital
Costs($K)
TotalProjected
Capital
Costs($K)
H2cost($/kg)
Capital
H2cost($/kg)
Electricity
H2cost($/kg)
O&M
H2cost($/kg)
Total
345 929 1.80 52.9 2204 0 5050 2.2 2.01 0.86 4.92
345 1858 2.01 52.9 1054 0 3085 1.3 2.17 0.59 3.95
345 2787 2.28 61.2 691 0 2474 1.0 2.37 0.51 3.8
Source: Data from Ref. [2]
Fig. 14. Cost comparison of hydrogen production from high pressure PEM electrolysis based on
various electricity price and current densities at 345 bar (data from Ref. [2])
4.92
3.95 3.8
5.95
5.06 5.01
0
1
2
3
4
5
6
929 mA/cm2 1858 mA/cm2 2787 mA/cm2
Cost of high pressure electrolysis 
based hydrogen production ($/kg)
Current density
Electricity (US 3.5 cent/kWh) Electricity (US 5 cent/kWh)
19 
 
The projected cost of hydrogen increases with increasing stack and system operating
pressure. For an electrolyzer stack producing hydrogen at 5000 psig (34.6 MPa), the lowest
projected hydrogen cost is approximately $5.00/kg, a 25% increase over the 333-psig (2.4 MPa)
case. Higher pressure operation reduces the compressor costs, but significantly increases the
capital cost of the electrolyzer stack and system. This is particularly true for operation at 5000 psig
(34.6 MPa), where the high pressure limits the practical size (active area) of the individual cells
and reinforced sealing is required for each cell.
As the results shown in Fig. 14, the larger number of cells and the higher cost per cell, as
well as a higher cost for the balance-of-plant components rated for 5000-psig (34.6 MPa)
operation, result in a significantly higher capital cost for the 5000-psig (34.6 MPa) electrolyzer
compared to lower pressure designs. The estimated cost of the present stack design in large-scale
production is less than $1000/kW. A future development path has been identified that would
decrease the capital cost to less than $550/kW. Economic analysis indicates that hydrogen could
be produced for $3.79 per gge at an electricity cost of $0.05/kWh by the lower-cost PEM
electrolyzer assuming high-volume production of large-scale electrolyzer systems [2].
2. Feasibility analysis of cryogenic air separation for nitrogen production in ammonia
synthesis
Cryogenic air separation methods are regularly used in medium to large scale facilities to yield
nitrogen, oxygen, and argon as gases or liquid products. Cryogenic air separation is generally
favored technology for generating very high purity oxygen and nitrogen. Currently, it yields the
most cost effective technology for high amounts. There are numerous plants producing liquefied
industrial gas products using cryogenic technology.
The plants which produce nitrogen only are less complicated and need less power to
operate than an oxygen-only plant making the same amount of product. Producing these products
in liquid form requires extra apparatus and more than doubles the amount of power required per
unit of delivered product [9].
If a high percentage of facility produces liquid products, an additional refrigeration element
must be added to a standard air separation plant (ASU). These units are called liquefiers and they
use nitrogen as the primary working fluid. The needed liquefier volume is decided by considering
the estimated average daily demand for bulk liquid products and the need to produce some
additional liquid to back up on-site gas customers served out of the same air separation plant [9].
If the liquefier is being added to an existing ASU, the ASU may not have been designed to
allow high rates of liquid oxygen withdrawal. In this case, one solution is to add extra heat
exchanger circuit to liquefy gaseous oxygen while vaporizing liquid nitrogen. Refrigeration is
transmitted to the air separation section of the plant via heat exchangers and injection of liquid
nitrogen as distillation column reflux [9].
The general process design of a cryogenic air separation plant involves the following steps:
 Air is compressed and cooled with intercoolers to remove any water vapor
 The dry air stream is purified to remove contaminants such as carbon dioxide and residual
water vapor
 The air is cooled using the waste product oxygen and purified nitrogen from the distillation
column, further deducing contaminants
 The air is further cooled down to about 97 K (the dew point of air)
 The air is distilled into its components using a single distillation column
20 
 
The cost of reciprocating compressors is proportional to plant capacity while the cost of
centrifugal compressors varies very little over a wide range of large plant sizes [10]. Therefore,
when centrifugal compressors were first introduced, the threshold for switching from reciprocating
compressors to centrifugal compressors was estimated to be between 550 and 600 ton/day [10].
Today with improved manufacturing techniques, improved catalysts and lower synthesis pressures
in some plants, centrifugal compressors are economical down to 220 ton/day [11].
Nearly all contemporary ammonia plants use centrifugal compressors for syngas
compression, though reciprocating compressors were used until the mid-1960s. The compressors
utilize intercoolers to minimize the compression work and operate at constant throughput,
delivering the syngas at constant pressure and temperature to the synthesis reactor. The synthesis
loop operates adiabatically at constant pressure with a slight pressure drop across the reactor beds
[12].
2.1 Air separation unit cost analysis
Air separation units are rated in terms of normal cubic meters per hour which is the volume of the
gas at standard temperature and pressure. An ammonia production facility with a capacity of 300
ton/day is considered in the analysis. Using the ideal gas law at STP to convert a mass of 246.7
tons of nitrogen to units of meters cubed gives a volume of 214,500 m3
/day or about 8,940 m3
/h.
The molecular mass of water is approximately 16 g/mol and 1 g of water equals one mL so the
total volume of water required can be calculated. A 300 ton per day ammonia plant will require
about 476 tons of distilled water/day. The flow rates of nitrogen, ammonia, hydrogen and water
are summarized in Table 13, respectively.
Table 13. The mass flow rates of feed gases, water and ammonia product in a 300 ton/day
ammonia production facility
Product Daily Amount (ton/day) Flow Rate (kg/h)
Nitrogen 246.7 10,280
Hydrogen 53.3 2,220
Water 476 19,830
Ammonia 300 12,500
Note that the power required for air separation is almost solely from the compression train
used at the inlet and depends on the design of the plant. The assumptions for the air separation
plant are: the intake temperature is 298 K, there are 3 stages of compression to raise the pressure
to 8 bar and the recovery ratio of the air separation plant is 70% by volume. The total volumetric
flow rate of air into the compression train is the total nitrogen production capacity divided by the
recovery ratio:
A 300 ton/day ammonia plant will require 247 ton/day or 8940 Nm3
/h of nitrogen. Thus,
the air intake into the first compressor of the ASU will be 352.8 ton/day which corresponds to 4.08
21 
 
kg/s. The fluid power required is 792 kW. If an adiabatic compressor efficiency of 75% is assumed
together with a driver efficiency of 95%, the total power required will be 1.112 MW. Specifications
and costs of heat exchangers used in ASU plant are shown in Table 14 with 2010 US $ prices.
Table 14. Specifications and cost of heat exchangers used in ASU plant based on 2010 US$
Type Area (m2
) Pressure (bar) Uninstalled Cost ($) Installed Cost ($)
Floating head 121.32 2 38,340 83,200
Floating head 127.56 4 39,280 85,240
Floating head 188.19 8 48,550 105,350
Plate fin 2855.69 8 514,910 1,428,880
Total 3292.76 641,080 1,702,670
Source: Data from Ref. [13]
The main heat exchanger in a cryogenic air separation facility is the cold box which is a
large multi stream brazed aluminum heat exchanger that cools incoming warm air against the
cooler waste and product streams. The intercoolers are standard, water cooled, liquid-gas heat
exchangers. The process air stream is assumed to be cooled to the inlet temperature at each step,
which is a function of the pressure increase across the compressor.
Table 15. Specifications and cost of compressors and drivers used in ASU plant based on 2010
US$
Type Number
Compressor
power
(MW)
Driver
Power
(MW)
Uninstalled
Cost ($)
Installed
Cost ($)
Centrifugal & Driver 1 379 505.3 285,770 654,560
Centrifugal & Driver 1 362.3 483.1 277,430 633,730
Centrifugal & Driver 1 413.5 551.3 302,540 696,580
Total 3 1,984,870
Source: Data from Ref. [13]
22 
 
Table 16. Specifications and cost of towers used in 250 ton N2/day ASU plant based on 2010
US$
Type
Volume
(m3
)
Pressure
(bar)
Installed Cost
($)
Installed
Cost ($)
High pressure distillation column 134.9 6 120,800 1,658,670
High pressure distillation column 175.3 1.8 153,700 1,260,050
Argon distillation column 22.5 1.3 27,710 227,170
Total 302,210 3,145,890
Source: Data from Ref. [13]
It is assumed that standard carbon steel, centrifugal compressors are used since air is
relatively inert and non-corrosive. The cost of these machines is related to the fluid power required
in the application. The cost of compressors, towers and turbines used in ASU plant are given in
Tables 15, 16 and 17, respectively. The drivers are assumed to be totally enclosed all electric
motors made of carbon steel. They are subjected only to ambient pressures and temperatures, and
do not come into contact with any corrosive substances.
Table 17. Specifications and cost of turbine used in 250 ton N2/day ASU plant based on 2010
US$
Type Material Power (kW) Uninstalled Cost ($) Installed Cost ($)
Radial gas Carbon steel 25 14,590 89,000
Source: Data from Ref. [13]
In total, the capital cost of 250 ton N2/day ASU plant corresponds to 6,922,430 $.
3. Feasibility analysis of Haber-Bosch ammonia synthesis loop
The major process equipment in an ammonia synloop consist of compressors, heat exchangers,
pumps and the reactor. The compressor sizing is straightforward and is primarily driven by the
flow rates and pressure ratios. The cost of the process equipment depends on three major factors:
the size, the material of construction and the operating pressure. Also, pressure affects the cost of
process equipment because higher pressures often require more material and heavier frames. While
there are a many of ammonia synthesis loop configurations some basic assumptions enable an
economic analysis which is valid for any synthesis loop. The assumptions are as follows: A
centrifugal compressor train takes the feed gas from 1 bar to operating pressure. A recycle
compressor is used to compensate for the pressure drops in the loop. The operating pressures and
temperatures are valid for any size ammonia plant. The calculations for a 300 ton/day ammonia
production facility are based on Ref. [13]. Compression work for hydrogen can be done within the
electrolyzer instead of by compressors. This approach simplifies the overall process and saves
capital cost expenses for the compression machinery including drivers and compressors. The
23 
 
compression work must be the same for both processes, and the derivation that appeared in
Larminie and Dicks [14] is given below:
Δ 	 	ln	
Δ 	 	
Δ Δ ∙
Δ Δ ∙ ∙
Δ 	 ∙ ∙ 	ln	
Here, for the feed stream, it is assumed that the hydrogen is available at STP from the electrolyzer
bank, nitrogen is at standard temperature and 8 bar from the ASU. The fluid compression power
required is given by following equation:
1
	 	 1
where is the temperature of the feed gases incoming the compressor in Kelvin; N is the number
of stages in the compression train; n is the polytrophic exponent; R is the specific gas constant in
kJ/kgK; 	is the mass flow rate in kg/s; is the final pressure in bar; is the initial pressure in
bar. The term gives the compression ratio across each compressor. If isentropic compression is
assumed, the temperature is raised across each compressor. Intercooling is utilized between the
stages to minimize the compressor work. Thus, each intercooler must remove the heat imparted on
the feed gas by the compressors. It is assumed that the intercoolers cool the gas down to the inlet
temperature of the compressor. In this case, each compressor has the same conditions and uses the
same amount of power. The hydrogen and nitrogen are available at the compressor inlet at two
different pressures. The total compression power is the sum of the compression for each
component. The conditions for each component of the feed are given in Table 18.
Table 18. Assumptions of operating conditions for the capital cost analysis in the ammonia
synthesis loop
Parameter Value
Tin (°C) 25
Pout (bar) 150
Pin Nitrogen (bar) 8
Pin Hydrogen (bar) 1
RH2 (kJ/kgK) 4.124
RN2 (kJ/kgK) 0.2968
24 
 
The compression power required is linear with the flow rate of feed gas, given any synloop
operating pressure. This further implies that the size of the compressors and the drivers for the
compressors is also linear with flow rate. Following figure shows the fluid compression power
required for various ammonia plant capacities.
The power required to drive the compressor is the fluid power divided by the isentropic
efficiency of the compressor, as shown in the following equation:
The isentropic efficiency is taken to be 75%. Thus, the actual power needed at the shaft is about
25% higher than required by the fluid.
The recycle compressor is tasked with compressing more mass than the feed stream but
with a smaller pressure ratio. The conversion efficiency refers to the conversion rate of ammonia
in the synthesis reactor and is generally about 15%. Therefore, the synloop has roughly 6 times the
flow rate of the feed gas and contains ammonia as well as the hydrogen and nitrogen from the feed.
The pressure drop around the synthesis loop varies with the configuration, and operating
parameters of the entire plant. However, a total pressure drop of about 6% can be assumed as a
baseline to determine the total compression power of the recycle compressor [15].
Fig. 15. The required compression power for hydrogen and nitrogen gases in the ammonia
synthesis loop (adapted from Ref. [13])
Each compressor is driven by its own drivers. The power requirements for the compression
are determined by dividing the shaft power of the compressor by the efficiency of the electric
motor. The electric motor efficiency is generally more than 90% and rises with the rated operating
power and the turndown ratio. Because the ammonia synthesis occurs at steady state and the
compression power required for small plants is in the MW range, an efficiency of 95% is assumed
for this analysis. The isentropic efficiency is taken to be 75%, and the efficiency of the driver is
25 
 
taken to be 95%. The power requirements of the compressors in synloop are given in Table 19.
The driver power can be written as follows:
∙
Table 19. The power requirements for the compressors in the synloop based on various ammonia
production capacities
Ammonia plant capacity
(ton/day)
Total fluid power
(MW)
Shaft power
(MW)
Driver power
(MW)
100 1.88 2.50 2.64
200 3.76 5.01 5.27
300 5.62 7.51 7.91
400 7.51 10.02 10.54
500 9.39 12.52 13.18
Source: Data from Ref. [13]
For any ammonia plant size, the flows of reactants and products throughout the plant can
be calculated. The flow rates through the system are determined from the stoichiometry of
ammonia. The chemical formula for ammonia is NH3, its molecular mass is 17.03 g/mol of which
nitrogen is approximately 14 g/mol. NH3 consists of 82.4% nitrogen and 17.6% hydrogen by
weight. Thus, nitrogen and hydrogen must be mixed in the proper proportions and reacted together
to form ammonia. Therefore, for 300 ton/day ammonia plant will require about 246.7 tons of
nitrogen and 53.3 tons of hydrogen per day. Specifications and cost of heat exchangers and
compressors used in the synloop are given in Tables 20 and 21, respectively.
Table 20. Specifications and cost of heat exchangers used in the synloop based on 2010US$
Type Area (m2
) Capacity (MW) Installed Cost ($)
Floating head 1690 4.60 3,016,600
Floating head 28.5 3.31 219,610
Floating head 332.2 5.72 610,520
Floating head 197.5 10.67 427,770
Floating head 176.8 4.35 400,450
Total 2425 28.64 4,674,950
Source: Data from Ref. [13]
The heat exchangers are required to integrate the heat throughout the synthesis loop. There
are assumed to be four major heat exchangers in the loop that are tasked with heating up the feed
gases that enter the reactor and cooling down the product streams as they leave the reactor. There
26 
 
are also intercoolers that cool the gases between compression stages to minimize the compressor
work.
Table 21. Specifications and cost of compressors and drivers used in the synloop based on 2010
US$
Type Number
Fluid Power
(MW)
Shaft Power
(MW)
Installed Cost ($)
Centrifugal & Driver 5 1.02 1.54 2,499,210
Centrifugal & Driver 1 0.52 0.78 1,630,920
Total 6 5.62 8.48 14,126,970
Source: Data from Ref. [13]
Table 22. Specifications and cost of reactors used in the synloop based on 2010 US$
Type Volume (m3
) Pressure (bar) Installed Cost ($)
Packed bed 7.54 150 1,686,900
Flush drum 6.1 150 1,477,900
Total 3,164,800
Source: Data from Ref. [13]
The installed costs of Haber-Bosch reactor and reciprocating pumps are given in Table 22 and 23,
respectively.
Table 23. Specifications and cost of pump used in the synloop based on 2010 US$
Type Material Power (kW) Installed Cost ($)
Reciprocating Carbon steel 112 581,840
Source: Data from Ref. [13]
In total, ammonia synthesis loop capital cost yields 22,548,560 US$.
4. Feasibility analysis of electrolyzers in hydrogen production process
The power requirements for electrolysis of water can be calculated using the manufacturer
specifications for the specific power requirements. For example the specific power for Norsk
Hydro Atmospheric Type 5040 electrolyzers is listed as 4.8 kWh/Nm3
of hydrogen, of which 4.3
kWh/Nm3
is for electrolysis and the remaining 0.5 kWh/Nm3
is for the balance of plant. The
calculation for the power requirements for a 26,800 Nm3
/h of hydrogen consuming ammonia plant
is:
4.8 26,800 129 MW
27 
 
This is the direct current (DC) power requirement for electrolysis. The alternating current
(AC) power requirements are calculated by dividing the DC power requirement by a rectifier
efficiency of 95% [16] to obtain 135.4 MW.
Fig. 16. The capital cost distribution of all electric 300 ton/day ammonia production plant (data
from Ref. [13])
Fig. 17. Capital cost curve for an all-electric ammonia plant (adapted from Ref. [13])
65%
21%
6%
5% 3% Electrolyzer
Synthesis loop
ASU
Mechanical vapor compression
Storage
28 
 
On the other hand, for the central electrolysis which was given in the previous section, the
average energy consumption rate is 46 kWh/kg which corresponds to 4.14 kWh/Nm3
. In this case,
the required power is:
4.14 26,800 111 MW
Fig. 18. Power requirements of all-electric ammonia plants for various capacities (adapted from
Ref. [13])
When electrolyzer scaling is used, the electrolyzer stacks share common industrial
equipment to reduce costs. The best case scenario is has a cost curve with a scaling factor of 0.5,
and overall capital costs are drastically reduced. The power requirements are almost entirely for
the electrolysis of water. For a 300 ton/day ammonia plant, the power requirements are calculated
to be 145 MW total with 135 MW being required for the electrolysis which corresponds to 93%
as shown in Fig. 18. The synthesis loop requires about 8 MW of power, or about 5.5% of the total
power requirements. The power required for a 300 ton/day ammonia plant is about 145 MW. Thus,
the plant will consume 1,148,400,000 kWh of energy annually. The overall capital cost distribution
in a 300 ton/day ammonia production facility can be seen in Figs. 16 and 17 (with electrolyzer
scaling).
29 
 
II. CASE STUDIES
In this section, various case studies ranging from high pressure electrolysis process to thermal
methane plasma disassociation are comparatively studied. Possible improvements in Haber-Bosch
process are investigated by eliminating the main feed gas compressor and utilizing the excess heat
in the reactor. The feasibility study of the selected options have been conducted.
Case 1: Ammonia production via low cost hydropower electricity + high pressure electrolysis
+ cryogenic air separation + Haber-Bosch plant without compressor
The average cost of ammonia production from the electrolysis based systems are approximately
20-25% of hydrogen production cost as previously given in Ref. [17] for various ammonia
production methods. 17.8% of ammonia is hydrogen in weight, and about 3% of ammonia
production cost comes from air separation based nitrogen production. In the proposed system, the
lower limit has been taken to calculate the cost of ammonia production from high pressure
electrolysis based systems. Therefore, ammonia production costs are calculated as the 20% of
hydrogen production cost. The schematic diagram of high pressure electrolysis based ammonia
production system is given in Figs. 19 and 20. In this case, hydrogen compressor is eliminated by
using pressurized water and high pressure electrolysis system. However, the nitrogen is used as
gaseous form and still need to be compressed by the compressor. The amount of work decreases
substantially because nitrogen constitutes about 82% of the feed gases. The required electricity is
supplied via low cost hydroelectric plant to the electrolyzer, cryogenic air separation unit, external
nitrogen compressor, pump and recycling compressor inside the Haber Bosch process.
Hydroelectric	
Power	Plant
High	Pressure	
PEM	
Electrolyzer
Cryogenic	Air	
Separatioin
Low	cost	hydropower
Air
ElectricityElectricity
High	Pressure	
H2
High	Pressure		
N2
Haber	Bosch	
Ammonia	
Synthesis	
(No	Main		Compressor)
Ammonia	
Storage
NH3
Water
O2
O2
Pump
High	Pressure	
Water
Compessor
Fig. 19. Schematic diagram of high pressure electrolysis based ammonia production system
30 
 
High	Pressure	Electrolysis
Haber‐Bosch	with	No	Main	Compressor
Ammonia	Synthesis
Low	Cost	Hydropower
Electricity
Water
Hydroelectric	
Power	Plant
Nitrogen	(N2)
Ammonia	
(NH3)
High	Pressure	
Water
Fig. 20. A diagram of energy and material flows of high pressure electrolysis based ammonia
production system
Using the data from the previous chapter given in high pressure electrolysis hydrogen
production prices, the costs of ammonia production via high pressure electrolysis based
electrolysis at two different electricity prices are illustrated in Fig. 21.
Fig. 21. Cost comparison of ammonia production from high pressure PEM electrolysis and
Haber-Bosch plant based on various electricity price and current electrolyzer densities at 345 bar
(data from Ref. [2])
0.98
0.79
0.76
1.19
1.01
1.00
0.00 0.20 0.40 0.60 0.80 1.00 1.20
929
1858
2787
Ammonia production cost ($/kg)
HP electrolyzer current density (mA/cm2)
Total ammonia cost ($/kg) (Electricity : US 5 cent/kWh) Total ammonia cost ($/kg) (Electricity : US 3.5 cent/kWh)
31 
 
Case 2: Ammonia production via low cost hydropower electricity + high pressure electrolysis
+ cryogenic air separation with liquid nitrogen pumping + Haber-Bosch plant without main
compressor
In this case, opportunities of utilizing the excess heat of Haber Bosch process are investigated as
illustrated in Fig. 22 and 23. The negative value of enthalpy in the ammonia synthesis process
indicates that the reaction is exothermic, releasing approximately 2.7 GJ/ton NH3 heat in ammonia
production. This is equivalent to about 8% of the energy input for the entire process. It means that
heat dissipation is about , 2700	kJ/kg	 ammonia. For the ammonia production
facility with a capacity of 300 ton/day, the amount of required nitrogen mass flow rate is 246.7
ton/day which corresponds to about 2.90 kg/s.
250 ∙
	∙
	kg/s
Excess heat
Hydroelectric	
Power	Plant
High	Pressure	
PEM	
Electrolyzer
Cryogenic	Air	
Separatioin
Low	cost	hydropower
Air
ElectricityElectricity
High	Pressure	
H2
High	Pressure	
Liquid		N2
Haber	Bosch	
Ammonia	
Synthesis	
(No	Main	Compressor)
Ammonia	
Storage
NH3
Water
O2
O2
Pump
High	Pressure	
Water
Cryogenic
Pump
Evaporator
Fig. 22. Schematic diagram of high pressure electrolysis and liquid nitrogen pumping based
ammonia production system
32 
 
In this case, hydrogen is produced via high pressure electrolysis and sent to Haber-Bosch
reactor. Nitrogen is produced by cryogenic air separation as liquid end product. The liquefaction
of nitrogen process will require more energy compared to gaseous end product. The liquid nitrogen
is pumped to reaction pressure about 200 bar by cryogenic pump.
High	Pressure	Electrolysis
Haber‐Bosch	with	No	Main	Compressor
Ammonia	Synthesis
Low	Cost	Hydropower
Electricity
Water
Hydroelectric	
Power	Plant
Liquid	
Nitrogen	(N2)
Ammonia	
(NH3)
High	Pressure	
Water
Evaporator
Excess heat
Fig. 23. A diagram of energy and material flows of high pressure electrolysis and liquid nitrogen
pumping based ammonia production system
The excess heat in Haber-Bosch reactor is utilized for the vaporization of high pressure
liquid nitrogen to obtain high pressure gaseous nitrogen for ammonia synthesis reaction. The
required electricity is supplied via low cost hydroelectric power plant to the electrolyzer, cryogenic
air separation unit, pumps and recycling compressor inside the Haber Bosch process.
An air separation facility with a capacity of about 250 ton/day is considered. The outlet
pressure of air separation unit is generally at 8 bar. The liquid nitrogen at 8 bar is pressurized using
cryogenic pumps up to 200 bar.
∙ 	 	 ∙ 	 	
The required pump power is calculated as 52.36 kW. The liquid nitrogen enters to vaporizer
which utilizes the excess heat in Haber-Bosch process. The outlet temperature of vaporized unit is
set to 25°C.
33 
 
300 ∙
	∙
	 kg/s
53.3 ∙
	∙
	kg/s
	 ∙ ,
When 300 ton/day ammonia is produced, the Haber-Bosch reactor releases 9375 kW heat. The
hydrogen and nitrogen gas mixture is sent to reactor. The reaction temperature for Haber-Bosch
process is about 450°C. The temperature of hydrogen is assumed as 100°C after high pressure
electrolysis. The required heat of vaporization for nitrogen at 2 180°C is calculated as 506.1
kW.
	 ∆ , 	 ∙
Besides, the mixture gasses hydrogen and nitrogen require 4589 kW heat in order to reach the
reaction temperature.
∙ 	 	
∙ 	 	
where initial temperature of hydrogen is 100°C and initial temperature of nitrogen is 25°C, and
final temperature is 450°C.
	
	 	 	
Therefore, 4786 kW excess heat is available which can be utilized in vaporization of liquid
nitrogen. Finally, the amount of excess heat from Haber-Bosch reactor is satisfactorily enough for
the vaporization of liquid nitrogen. On the other hand, if gaseous nitrogen is pressurized to the
reaction temperature instead of liquid pumping, the required compressor power to have
compressed nitrogen from 8 bar to 200 bar is calculated to be 1057 kW. In total, liquid nitrogen
pumping and vaporization require about 559 kW power. This indicates that there is about 52%
reduction in energy requirement by using liquid nitrogen pumping and vaporization obtained by
the excess reactor heat. As it can been seen in previous tables, the cost of 5 centrifugal compressors
in the 300 ton/day ammonia synthesis synloop represent 50% of the overall installed cost of
synthesis loop. When these compressors are eliminated, nearly 11 million $ capital cost reduction
will be achieved.
The required power for 300 ton / day ammonia plant was calculated as 145 MW.
Approximately 7.7 MW of this power is used for synloop compressors. Therefore, the required
power will decrease 5.3% for the overall plant.
34 
 
Case 3: Pressurization of LNG to 200 atm and vaporization of LNG using waste heat from
Haber-Bosch reactor + Plasma dissociation of methane for hydrogen production via low cost
hydropower electricity + Cryogenic air separation with liquid nitrogen pumping + Haber-
Bosch plant without main compressor
In this case, methane is utilized as a source of hydrogen which is required for ammonia production
as shown in Fig. 24. Rather than steam methane reforming, thermal plasma cracking of ammonia
is an important option for clean ammonia production.
Methane (CH4) is dissociated to carbon (C) black and hydrogen (H2) according to:
CH4 → C + 2 H2		∆ 74.9 	25° .
Here, methane is a favored option for H2 production from a hydrocarbon because of its high H to
C ratio, availability and low cost. Furthermore, the C produced can be sold as a co-product into
the carbon black market which could be utilized in inks, paints, tires, batteries, etc. or sequestered,
stored, and used as a clean fuel for electricity production. The sequestering or storing of solid C
requires much less development than sequestering gaseous CO2 [18].
Haber‐Bosch	
with	No	Main	Compressor
Ammonia	Synthesis
Low	Cost	Hydropower
Electricity
Hydroelectric	
Power	Plant
Liquid	
Natural	
Gas	(LNG)
Ammonia	
(NH3)
Evaporator
Excess	heat
Microwave	Plasma	
Disassociation	
High	
Pressure	
Natural	Gas Carbon
High	
Pressure	
Hydrogen
Evaporator
Liquid	
nitrogen	(N2)
High	Pressure	
Nitrogen
Excess	
heat
Power
Electricity
Electricity
Fig. 24. The schematic diagram of thermal plasma disassociation of methane integrated to
ammonia production
35 
 
As seen in Fig. 24, liquid natural gas and liquefied natural gas is pressurized using
cryogenic pumps. The available excess heat from Haber-Bosch reactor is utilized for vaporization
of both liquid nitrogen and LNG. The high pressure LNG is sent to thermal plasma disassociation
process which divides methane into hydrogen and carbon. Carbon black is stored for further
utilization is various industries. The obtained hydrogen gas is transferred to Haber-Bosch process
together with high pressure nitrogen gas.
It is a plasma-arc process that decarbonizes natural gas in a compact reactor that is in-line
with the fuel delivery system. The carbon has applications in metallurgy, tires and manufactured
rubber goods. Carbon black is a form of carbon that is usually created by the incomplete
combustion of heavy petroleum products. It is primarily used as a rubber reinforcing agent in the
production of automobile tires, belts and hoses, as well as a pigment in plastics and dyes [19].
The commercial microwave disassociation of methane requires the equivalent of between
3-4 kWh/m3
of pure H2 [19]. The voltage required to produce the plasma depends on many factors
such as the plasma distance, the type of media used, the operating pressure, and the operating
temperature. Typically the system plasma voltages change from 1 kV – 20 kV. The actual plasma
temperature is between 1500°C-2500°C. The exiting gas temperature may reach 300°C and the
reactor surface temperature is generally less than 200°C. The theoretical efficiency limit for the
plasma technology is less than 1 kWh/m3
of pure H2 [19]. The estimated cost would be equivalent
to $0.05 per 28.2 m3
of natural gas or about a 1% premium paid on the price of gas [19]. The
carbon can be sold to foundry industry with an average price of 900 US$/ton.
Thermal plasma disassociation of methane would bring some problems under high pressure
since there is not much study about even moderate pressure systems. In the analysis, it is assumed
that the pressure will not affect the conversion process.
The calculations are carried out for a 300 ton/day ammonia production plant which utilizes
thermal plasma disassociation of methane for hydrogen production based on the data in Ref. [20].
The following assumptions are made:
 The thermal efficiency of DC-RF microwave unit is assumed to be 60% [20].
 The methane is totally converted to hydrogen and carbon black.
 Hydrogen and methane is assumed to be at ambient temperature at 25°C and pressure P=100
kPa.
 Carbon yield is 0.49 kg/m3
natural gas at STP.
 The price of carbon black is assumed to be 1 US$/kg in economic calculations.
The outlet pressure of air separation unit is generally at 8 bar. The liquid nitrogen at 8 bar is
pressurized using cryogenic pumps up to 200 bar.
∙ 	 	 ∙ 	 	
The required pump power is calculated as 52.36 kW. The liquid nitrogen enters to vaporizer
which utilizes the excess heat in Haber-Bosch process. The outlet temperature of vaporized unit is
set to 25°C. When 300 ton/day ammonia is produced, the Haber-Bosch reactor releases 9375 kW
heat. The hydrogen and nitrogen gas mixture is sent to reactor. The reaction temperature for Haber-
Bosch process is about 450°C. The temperature of hydrogen is assumed as 100°C after high
pressure electrolysis. The required heat of vaporization for nitrogen at 180° calculated as
506.1 kW.
∆ , , _ 2
, ∆ ,
36 
 
The required energy for vaporization of LNG is found to be , 1257 kW
for LNG at 161° .
The mass flow rate of natural gas and carbon can be found as per following formula:
	 0.49 kg/s


, 	 	
The required pump work for LNG from 1 bar to 200 bar kPa is found to be , 47.09
kW.
∙ ∙
If a compressor is used from ambient temperature and pressure at 25°C and 1 bar to 200 bar for
natural gas instead of LNG pumping, the required power would be ,
518.8	kW. If the compressor works under same conditions with pump which is from -162°C, the
outlet temperature becomes 147°C and the required power yields 1503 kW.
Table 24. The mass flow rates of the streams in the process
Product/Feed Mass Flow Rate (kg/s)
Carbon 1.863
Hydrogen 0.6169
Natural gas 2.465
Nitrogen 2.894
Ammonia 3.472
For the 300 ton/day ammonia plant, the mass flow rates of the streams in the thermal
plasma disassociation process are given in Table 24. As previously calculated, 4786 kW excess
heat was available which can be utilized in vaporization of both liquid nitrogen and LNG. The
total required heat for vaporization processes is 1,257 kW+ 506.1 kW=1,763.1 kW. Finally, the
amount of excess heat from Haber-Bosch reactor is satisfactorily enough for the vaporization of
both liquid nitrogen and LNG.
Thermal plasma disassociation balance equation can be written as follows:
∙ , 	 	 ∙ ∙
The required power input to the thermal plasma disassociation system is calculated to be
, 	 	 115,853 kW.
The total required power for a high pressure electrolysis based ammonia production plant
with a capacity of 300 ton/day ammonia was calculated to be about 145 MW. For this case, it is
about 116 MW which is 20% less.
37 
 
The cost of hydrogen production via thermal plasma disassociation is given in Table 25
based on the previously mentioned assumptions. The hydrogen purity from methane disassociation
is 98%. PSA unit included in CarbonSaver plant cost to achieve 99.9% hydrogen purity. In the
cost analysis, it is assumed that the plant has a capacity of 1,500 kg/day, plant life is 20 years and
capacity factor is 70%.
Based on the assumption that ammonia production cost will be about 20% of hydrogen
production cost, the price is calculated as 1.01 $/kg ammonia. However, when the carbon black
sales are taken into account, it decreases down to 0.412 $/kg.
Table 25. Cost of hydrogen production using thermal plasma disassociation of methane
Category Cost (US$/kg H2)
Capital 0.46
O&M 1.40
Feedstock 3.19
Total 5.05
Carbon Black Sales -2.99
Net Cost 2.06
Source: Data from Ref. [21]
Case 4: Using pumped hydro or producing ammonia from the excess power in Niagara
Pumped hydroelectric storage plants store energy in the form of water in an upper reservoir,
pumped from another reservoir at a lower elevation. During periods of high electricity demand,
power is produced by releasing the stored water through turbines with the same method of
hydropower plants. During low demand periods which are generally nights or weekends, the upper
reservoir is charged via low cost electricity from the grid to pump the water back to upper reservoir.
The efficiency values of pumped storage systems are high where the average efficiency values of
system components in pumped storage plants are shown in Table 26.
Table 26. Average efficiency values of system components in pumped storage plants
Efficiency of generating cycle in
average (%)
Efficiency of pump cycle in
average (%)
Water conductors 98.3 98.3
Pump 83 91
Motor 98.1 98
Transformer 99.3 99.3
Overall 78.5 87.1
Source: Data from Ref. [22]
The Ontario Power Generation operates a pumped storage plant near Niagara. It was
constructed when Ontario projected excess nuclear production. Although it wastes one unit of
electricity for each unit finally delivered, the storage system reserves some of the nightly water
flow over Niagara for daytime use. This time-shifting optimizes power production by the main
38 
 
generators, while maintaining the scenic daytime water flow over Niagara Falls as required under
international agreement.
Table 27. Three year average O&M costs of various hydro pumped storage projects in 2009
$/MWh
Project 3 Year Average O&M Cost in 2009 $/MWh
Bad Creek 3.41
Bath Country 2.43
Cabin Creek 15.42
Fairfield 4.11
Helms 19.44
Jocasse 5.07
Ludington 5.55
Rocky Mountain 6.64
Yards Creek 5.28
Source: Data from Ref. [22]
In Table 27, the O&M cost data do not include energy for pumping purposes. The average
O&M cost is about $9.95/MWh as shown in Table 27 and Table 28. It is expected that specific
construction and equipment procurement cost for a 1000 MW pumped storage project is a little
under 2000 $/kW. The specific cost is close to 4000 $/kW for small projects on the order of 30
MW. The current capital cost of new pumped hydro facilities is estimated to range between USD
2 000-4 000/kW as shown in Table 28.
Table 28. Specific installation and estimated annual O&M costs for pumped storage hydro plants
Capacity
(MW)
Specific Installation Cost
($/kW)
Estimated Annual O&M Cost (million $ in
2009)
50 3000 1.5
100 2940 2.9
250 2750 6.9
500 2500 12.5
750 2250 16.9
1000 2000 20
Source: Data from Ref. [22]
The Lewiston Pump-Generating Plant located in Niagara has an installed power of 240
MW. The water is pumped at night since the demand for electricity is much lower than during the
day. In addition to the lower demand for electricity at night, less water can be diverted from the
river during the day because of the desire to preserve the appearance of the falls. During the
following day, when electrical demand is high, water is released from the upper reservoir through
the pump-generators in the Lewiston Dam. In Ontario, there is only one pumped hydro storage
facility in operation, the Sir Adam Beck Pumped Storage Facility in Niagara Falls. During off-
peak periods (night time), Ontario Power Generation diverts water from the Niagara River, filling
its 300 hectare reservoir. During peak periods, this water is released, creating up to 174 MW of
39 
 
hydro power. The capacity factor of the pumped storage power plants is about 6
hours/24hours=25%.
For a pumped storage hydro plant with a capacity of 142 MW, a reversible Francis pump
turbine system is necessary to pump back the water to the upper reservoir. Each pump/turbine will
have a flow rate of 38.857 m3
/s. The system is planned to charge for 7 hours; with 81%
,
∙ ∙ ∙ 	
where ρ stands for the density of the fluid to be pumped, g is for acceleration due to gravity and
H, Q stands for both gross head in meters and volumetric flow rate, respectively. Here η is the
efficiency of pump considering all components water conductors, pump, motor, transformers. The
pump power needed is calculated to be about 142 MW. The cost of storage unit is directly
dependent on the stored energy and inversely proportional to the efficiency of the system.
As an example, the tariff of electricity is taken as follows: 0.4736 $/kWh for peak hour and
0.3664 $/kWh for off-peak hour. The power for the pump will be used from off-peak hours starting
from midnight.
	 	 	 	 	 	 	 	 	 	 	
There are 5.67 hours of discharge and it works for the whole year.
	 	 	 	 	5.7
365	 0.4736	$ 980.1$


There are seven hours of charging.
	 	 	 7 	365 	 	0.3664
$
	936.2
$
The cost reduction available is 43.9 $/kW year.
For a 145 MW pumped storage power plant, the overall yearly benefit would be calculated
as 43.986
$
145000	 	 6,377,970	$.
Here, the specific installation cost of pumped storage plants is about 2,750 $/kW which yields
398.75 million $ capital cost for installation. Annual estimated O&M cost of 150 MW pumped
storage power plant is about 4.2 million $.
As it was analyzed in the previous cases, ammonia production facility requiring about 145
MW installed power would produce 300 ton/day ammonia. This will correspond to 109,500
ton/year. The lowest ammonia production cost which was calculated in high pressure electrolysis
based system yields 760 US$/ton. If the selling price of ammonia is assumed to be about 800
US$/ton in the current market, there is 40 US$/ton profit from ammonia trade. Yearly, there is
about 4,380,000 US$ profit. The O&M cost of ammonia plant is calculated by multiplying the
number of operating hours which is about 8000 hours/year by the electricity price by the operating
power. Thus, the operating cost in year 1 is approximately $931,000 which is much lower than
pumped storage hydro plant.
40 
 
Case 5: Wind based ammonia production cost analysis
The offshore wind energy is an alternative source for power generation which can be utilized in
high pressure electrolyzers. The baseline offshore wind powered ammonia plant was simulated
using the wind data from the Gulf of Maine. The simulation was done for a three year period using
wind and grid from 2005-2007 [13]. The results are averaged over the three year period to get one
representative year of system outputs as shown in Table 29. The 300 MW plant, which includes
the NH3 facility and the offshore wind farm, had a total capital cost of $1.39 billion 2010 dollars
[13].
The LCOA (levelized cost of ammonia) calculation requires several economic assumptions
be made about the loan and the interest rates associated with the investment. The levelized cost
calculation has several parts. First, the down payment on the investment is assumed to be in year
0 and is already in present value. For simplicity, the down payment is assumed to be 10% of the
capital expenditure, or $139 million for the base case. The second term in the equation calculates
the present value of the payments on the loan. Four parameters are required: the total value of the
in present dollars, the interest rate on the loan, the inflation rate over the lifetime of the system,
and the lifetime of the loan. The total amount of the loan is simply the total capital expenditure
minus the down payment, or $1.251 billion dollars. The interest rate is assumed to be 4% with the
inflation rate at 3%; the discount rate is assumed to be 7%. The lifetime of the project is assumed
to be 20 years, which is typical for wind farms and chemical processing plants. The loan life is 15
years. The third term in the LCOA equation calculates the present value the operations and
maintenance costs for the lifetime of the system - 20 years in this case. Recently, the operations
and maintenance cost for onshore wind farms was found to be $10/MWh, corresponding to about
2.4% of the capital expenditure [23]. Because the wind farms are offshore rather than onshore, a
higher value of 3% of the capital expenditure is assumed for this analysis.
Table 29. Offshore wind based ammonia production plant details
Parameter Value
Capacity factor (%) 40.92
Average wind speed (m/s) 9.62
Average power (MW) 122.75
Annual electricity sold (MWh) 296,300
Annual electricity purchased (MWh) 492,000
Ammonia sold (ton) 109,500
Overall ammonia conversion efficiency (%) 50
Total cost (billion $) 1.39
Source: Data from Ref. [13]
The wind farm achieved a capacity factor of over 40% and required more than 534 GWh of
electricity from the grid to sustain the ammonia production process. At the same time, a substantial
amount of energy could be sold back to the grid, totaling more than 268 GWh. The capital cost
distribution of offshore wind based ammonia production plant is shown in Fig. 25.
41 
 
The cost of manufacture for the ammonia facility is of principal importance: a large fraction
of the overall costs will come from purchasing electricity, assumed to be the utility cost. The cost
of manufacture is the sum of waste disposal, labor costs, utilities, general expenses, raw materials,
taxes, maintenance costs as well as other minor costs. The waste disposal is assumed to be
negligible because the waste is oxygen or brine both of which can be discharged safely into the
environment with little or no processing. The following economic assumptions are made: Discount
rate is 7%, inflation rate is 3%, interest rate is 4%, loan life is 15 Years, project life is 20 Years, O
& M fraction for wind is 3% of capital expenditure and down payment is 10% of total capital cost
[13].
Fig. 25. Capital cost distribution of offshore wind based ammonia production plant (adapted
from Ref. [13])
The utility costs are the sum of the electricity costs and the raw material costs multiplied
by 1.23. The utility costs include all of the purchased electricity costs minus the revenue from the
electricity. Thus, if the electricity revenue is higher than the costs, the cost of manufacture
decreases. The general expenses include administration, research and development, and
distribution and marketing costs. Since the electrolyzers offer unattended, continuous operation,
the multiplier for the determining the general expenses from the labor costs was reduced from 19%
to 10%. The multipliers for the fixed capital investment and the cost of manufacture were held at
0.9% and 16%, respectively [13].
The LCOA (levelized cost of ammonia) for the selected offshore wind based ammonia
production facility is calculated to be $1224/ton which is substantially higher than ammonia
produced from a conventional natural gas based ammonia plant [13].
42 
 
Case 6: Nuclear based ammonia production
Steam electrolysis is the primary choice for hydrogen production in nuclear based ammonia
production. The efficiency is comparable to the practical efficiencies of thermochemical processes
if powered by an HTGR. Steam electrolysis can be powered by a pressurized water reactor (PWR)
or a boiling water reactor (BWR). Capital costs of steam electrolysis and water electrolysis differ
by less than 10% [24].
Table 30. Comparison of performance and costs of large nuclear powered ammonia plants
Type of Reactor
Hydrogen
Production
Method
Efficiency (MJ
Fuel/MJTin %)
Capital
Investment Cost
(million $)
Production
Cost ($/ton)
HTGR with heat
integration
Steam
Electrolysis
48 1440 172
HTGR without
heat integration
Steam
Electrolysis
41 1570 189
HTGR
Water
Electrolysis
37 1590 187
ABWR with heat
integration
Steam
Electrolysis
29 1540 196
ABWR
Water
Electrolysis
23 1680 200
Source: Data from Ref. [24]
The capital investment cost and production cost of ammonia via nuclear systems are
illustrated in Table 30 and Fig. 26. Nuclear based ammonia production has the lowest operating
costs which corresponds to 10-20% less than partial oxidation of coal and 40-50% less than steam
methane reforming process as shown in Table 31. Nuclear based ammonia production has the
highest capital costs which is 65-75% more than partial oxidation of coal 400-430% more than
steam reforming methane as given in Table 31.
In the ammonia synthesis loop, it is assumed that multiple intercoolers are used for
compressor, ammonia reactor is at 200 bar and 20% of ammonia reactor in one cycle. Using the
dissolved argon prevents excessive accumulation. In addition, for HTGR powered ammonia
production system, 84% of is used for electricity, 10% is used for compressors and 6% is utilized
as heat.
43 
 
Table 31. Comparison of ammonia production and capital investment costs for various methods
Process
Ammonia
Production
(ton/day)
Efficiency
(%)
Capital Investment
(million $)
Ammonia Production
Cost ($/ton)
Natural Gas 2100 79 360 331
Natural Gas
with
Sequestration
2100 76.4 420 356
IRIS 1120 28.7 580 201
GTHTR 1080 41.5 700 227
Coal 2100 42.7 870 218
Coal with
Sequestration
2100 39.5 1000 291
HTGR 2100 48.3 1440 172
ABWR 2100 29.4 1540 196
Wind 2100 4000 321
Source: Data from Ref. [24]
Fig. 26. The capital investment cost of various ammonia production methods (data from Ref.
[24])
360 420
580
700
870
1000
1440
1540
4000
0
500
1000
1500
2000
2500
3000
3500
4000
Capital investment cost (million $)
Natural Gas
Natural Gas with Sequestration
IRIS
GTHTR
Coal
Coal with Sequestration
HTGR
ABWR
Wind
44 
 
The main advantages of nuclear powered ammonia production could be listed as follows:
 readily available raw materials air and water
 low and constant operating costs
 no co2 emissions
High capital costs are the major disadvantage of nuclear powered ammonia production
however, by enabling smaller and standardized modular reactors, it could be reduced the capital
costs, construction cost and time, licensing cost and time [24].
High-temperature gas-cooled reactor (HTGR)-integrated high-temperature steam electrolysis
(HTSE) was also considered to supply hydrogen to the ammonia process. In this scenario, coal
usage for hydrogen production can be completely eliminated; hence, the process configuration is
radically altered and no longer resembles the conventional coal-to-ammonia case. Two such
configurations were considered in this study, and results indicate that approximately four 600 MWt
HTGRs are required to support production of 3,360 ton/day of ammonia. Substituting hydrogen
from water via nuclear-integrated HTSE instead of natural gas reforming or coal gasification
(followed by shift conversion) eliminates fossil fuel consumption and the CO2 emissions
associated with these processes.
Fig. 27. HTSE based ammonia and various products synthesis from nuclear electricity (adapted
from Ref. [25])
45 
 
High temperature steam electrolysis (HTSE) based ammonia production method uses
cryogenic air separation as the nitrogen source. Hydrogen for ammonia synthesis is produced by
HTSE. Nuclear HTGRs supply heat and power for the electrolysis units [25].
Urea production requires CO2 as a feed to the process. For this case, a CO2 supply is not
readily available and must be produced to support urea manufacture; hence, natural gas is burned
with oxygen to produce the required CO2. While coal could have been selected for this purpose,
natural gas is preferred because of the much simpler gas cleanup requirements [25].
Fig. 27 and Fig. 28 show an example of ammonia production facility including nitric acid,
urea and ammonium nitrate synthesis by utilizing the nuclear waste heat and nuclear electricity.
Nuclear electricity is used for high temperature electrolysis, air separation unit, feed gases
compression for ammonia synthesis and other auxiliary equipment. Nuclear heat at temperature
700°C is used as supporter for high temperature steam electrolysis process.
As HTGR technology matures and reactor outlet temperatures increase, the nuclear
reactors may be able to supply electrolysis topping heat. However, because of the upper limit of
700°C deliverable heat assumed in this study, supplying topping heat from the burner to the
electrolyzers is an attractive means of increasing electrolyzer efficiency [25]
Fig. 28. Inputs and outputs of the plant via HTSE to ammonia method (adapted from Ref. [24])
The proposed high temperature steam electrolysis based ammonia and derivatives
production yield 2,939 ton/day urea, 3,779 ton/day ammonium nitrate, 2,435 ton/day oxygen. The
required heat and electricity for the process are 222 MWt and 770 MWe, respectively.
The economic modeling calculations for HTGR technology were based on capital cost
scenarios for current best estimate of US$2,000/kWt where kWt is the thermal rating of the plant.
In comparison, light water nuclear reactor costs are approximately US$1,333/kWt. Based on the
capital cost scenarios for HTGR technology, the nominal capital cost for a 600 MWt HTGR would
be US$1.2 billion [25].
46 
 
Fig. 29. Distribution of total capital investment for a plant including urea, ammonium nitrate and
nitrite acid production via HTSE ammonia production method (adapted from Ref. [25])
The total capital investment (TCI), based on the total equipment costs, annual revenues,
and annual manufacturing costs were first calculated for the case. The present worth (PW) of the
annual cash flows (after taxes) was then calculated for the TCI, as well as the TCI at + 50% and –
30% of the HTGR cost, with the debt to equity ratios equal to 80%/20% and 55%/45%. Gas
cleanup includes costs for water gas shift reactors, the Selexol process, sulfur recovery, pressure
swing absorption, methanation, and CO2 compression/liquefaction as appropriate for the various
process configurations. The fixed capital costs were estimated from literature estimates and scaled
estimates (capacity, year, and material). Finally, an engineering fee of 10% and a project
contingency of 18% were assumed to determine the TCI. The capital cost provided for the HTGR
represents a complete and operable system, engineering fees and contingencies were not applied
to this cost. The total investment cost of this HTSE plant was calculated as US$6,302,210,656
[25]. The results for the HTSE hydrogen cases look promising. However, integrating with nuclear
power significantly increase the capital cost of the plant as seen in Fig. 29. This is due principally
to the need for four nuclear reactors to support both hydrogen and electrical demands of the plant.
Finally, in order to determine the most attractive options for ammonia production, various
perspectives [26-31] such as life cycle, efficiency, cost and sustainability need to be addressed for
the overall assessment of the selected options.
47 
 
Conclusions
The following concluding remarks are extracted from this comprehensive feasibility study
covering a variety of methods, systems and applications:
 Atmospheric pressure electrolysis systems produce the hydrogen at 1 atm and then
pressurizes for further usage to about 20 bar. The compression cost of hydrogen to about
20 bar is 1.03$/kg H2 which corresponds to 15% of overall cost. In order to increase the
pressure to Haber-Bosch reaction temperature, more energy input are then required.
 High pressure water electrolysis system is an alternative option for reducing the required
power of ammonia synthesis process by eliminating the main compressors in the system.
It also reduces the cost to $0.40 from $1.03 (corresponding to approximately 40% after
deducting the compression cost) for hydrogen production cost as compared to mechanical
compression when the high pressure PEM electrolyzers are utilized.
 Hydrogen produced by using pressurized water require less power than using hydrogen
compressor. The required power difference is about 15% which brings lower cost hydrogen
and ammonia.
 Producing ammonia directly from high pressure electrolysis near the ammonia production
facility eliminates the compression, storage and delivery processes of hydrogen which
brings down the overall ammonia production cost.
 For standard central water electrolysis with an electricity price of 3.7 US¢/kWh, plant gate
hydrogen production is calculated to be 3.2 $/kg although it is 5.6 $/kg for dispended
hydrogen.
 The lowest average electricity price in Canada for large-power customers is observed in
Winnipeg, Edmonton and Calgary with 3 US cent/kWh, 3.2 US cent/kWh and 3.60 US
cent/kWh, respectively.
 The lowest cost of high pressure electrolysis based hydrogen is calculated to be 3.8 US
cent/kg at 2787 mA/cm2
current density for 3.5 US cent/kWh electricity price resulting in
0.76 US $/kg ammonia end product price.
 In total, the capital cost of 250 ton N2/day air separation plant corresponds to 6,922,430 $
which is only 3% of overall ammonia production plant cost.
 The excess heat in Haber-Bosch reactor can be utilized for liquid nitrogen vaporization and
liquefied natural gas vaporization in order to decrease mechanical compression costs.
 Nearly 65% of overall capital cost of 300 ton/day ammonia production plant comes from
electrolyzer.
 Thermal plasma disassociation of methane is an alternative option for hydrogen production
which brings approximately 20% less power input for 300 ton/day ammonia production
plant. However, the effect of high pressure on plasma disassociation of methane needs to
be further studied.
 In thermal plasma disassociation of methane, carbon black is also obtained as a valuable
product for various industries which can be sold about 0.9-1 US$/kg.
 In thermal plasma disassociation option, the production of liquefied natural gas should also
be included in feasibility and cost studies in order to compare the overall performance.
 When carbon black sales are considered, the cost of ammonia can decrease down to 0.42
$/kg which is quite lower than other methods. Therefore, in any cases, producing by
products may bring higher revenues and therefore lower ammonia costs.
48 
 
 If 60 US$/ton profit from ammonia trade is considered, pumped storage hydro plant yearly
profit would be nearly same with a 300 ton/day ammonia production plant profit. However,
the capital installation cost of pumped storage hydro plant is nearly twice of ammonia plant.
 The offshore wind based ammonia is also an environmentally friendly solution for
ammonia production however, the unit cost for ammonia is still higher.
 Nuclear based ammonia production options appear to be cost competitive than other
methods however the initial investment costs are much higher. High capital costs are the
major disadvantage of nuclear powered ammonia production however, by enabling smaller
and standardized modular reactors, it could be reduced the capital costs, construction cost
and time, licensing cost and time.
 Mature Haber-Bosch technology would be optimized using liquid pumping instead of feed
gases compression, high pressure electrolysis and vaporization via excess heat of Haber-
Bosch reactor.
Nomenclature
F Faraday constant
h Specific enthalpy (kJ/kg)
H gross head (m)
HHV Higher heating value (kJ/kg)
m Mass (kg)
m Mass flow rate (kg/s)
N Number
N Polytrophic exponent
P Pressure (bar)
Q Heat rate (kW)
Q Volumetric flow rate (m3
/s)
R Universal gas constant (8.314 kJ/kmol K)
s Specific entropy (kJ/kg K)
T Temperature (˚C)
v Specific volume (m3
/kg)
V Volume (m3
)
W Work rate (kW)
z Number of electrons
Greek letters
η Efficiency
η Isentropic efficiency
ρ Density (kg/m3
)
Acronyms
AC Alternating current
ABWR Advanced boiling water reactor
ASU Air separation unit
BWR boiling water reactor
C Compressor
49 
 
CCS Carbon capture storage
DC Direct current
DOE Department of energy
DFMA Design for manufacture and assembly
FRP Fiber reinforced composite piping
GGE Gasoline gallon equivalent
HP High pressure
HTGR High temperature gas cooling reactor
HTSE High temperature steam electrolysis
IRIS International reactor innovative and secure
GHG Greenhouse gas
GTHR Gas Turbine High Temperature Gas-cooled Reactor
HB Haber-Bosch
LNG Liquefied natural gas
MEA Membrane electrode assembly
O&M Operation and maintenance
PEM Proton exchange membrane
PW Present worth
PWR Pressurized water reactor
RF Radio frequency
SMR Steam methane reforming
STP Standard temperature and pressure
UCG Underground coal gasification
TCI Total capital investment
References
1. Hamdan M. Electrolytic Hydrogen Production Workshop, NREL, Golden, Colorado, February
27-28th, 2014
2. Cropley CC, Norman TJ. Low-Cost High-Pressure Hydrogen Generator. 2008
DOE/GO/13029-20, United States;
3. Fateev V. High pressure PEM electrolysers: efficiency, life-time and safety issues, First
International Workshop Durability and Degradation Issues in PEM Electrolysis Cells and Its
Components, March 12th-13th, 2013, Fraunhofer ISE, Freiburg, Germany
4. Kazuo Onda, Takahiro Kyakuno, Kikuo Hattori and Kohei Ito, ‘Prediction of Production
Power for High Pressure Hydrogen by High-Pressure Water Electrolysis’, Journal of Power
Sources, Vol. 132, pp. 64 -70, 2004.
5. Laoun B. Thermodynamics aspect of high pressure hydrogen production by water electrolysis.
Revue des energies renouvelables. 2007;10(3):435-44.
6. Multi-year research, development, and demonstration plan. 2015 Delivery Section. Fuel cell
technologies office. Office of Energy efficiency & Renewable Energy. US Department of
Energy. Washington, US, 2015.
7. Multi-year research, development, and demonstration plan. 2015 Production Section. Fuel cell
technologies office. Office of Energy efficiency & Renewable Energy. US Department of
Energy. 2015 Delivery Section. Washington, US, 2015.
8. Comparison of electricity prices in major North American cities, Rates in effect April 1, 2015,
Hydro Quebec, 2015, ISBN 978-2-550-73559-5 (PDF).
Mitacs hydrofuel-uoit nov 2015 200 pp cost and tech analysis of a wide variety of integrated ammonia production method

Weitere ähnliche Inhalte

Was ist angesagt?

Cd5663 syed mazwan_bin_syed_abd_rashid
Cd5663 syed mazwan_bin_syed_abd_rashidCd5663 syed mazwan_bin_syed_abd_rashid
Cd5663 syed mazwan_bin_syed_abd_rashid
Chrishenson Ang
 
Coal to Methanol Senior Design Project Final Report
Coal to Methanol Senior Design Project Final ReportCoal to Methanol Senior Design Project Final Report
Coal to Methanol Senior Design Project Final Report
Kyle Mattson, EIT
 
Hydrogen Production steam reforming
Hydrogen Production steam reformingHydrogen Production steam reforming
Hydrogen Production steam reforming
Tanay_Bobde
 
ChE184B - FinalDesign
ChE184B - FinalDesignChE184B - FinalDesign
ChE184B - FinalDesign
Russell Wong
 
PRESENTATION
PRESENTATIONPRESENTATION
PRESENTATION
Ganesh ps
 
ChE184b Final Design
ChE184b Final DesignChE184b Final Design
ChE184b Final Design
Russell Wong
 

Was ist angesagt? (19)

Ammonia Synthesis - Zero Emission Design Project
Ammonia Synthesis - Zero Emission Design ProjectAmmonia Synthesis - Zero Emission Design Project
Ammonia Synthesis - Zero Emission Design Project
 
Cd5663 syed mazwan_bin_syed_abd_rashid
Cd5663 syed mazwan_bin_syed_abd_rashidCd5663 syed mazwan_bin_syed_abd_rashid
Cd5663 syed mazwan_bin_syed_abd_rashid
 
PRESENTATION ON HYDROGEN GAS PRODUCTION BY PARTIAL OXIDATION OF HEAVY FUEL OI...
PRESENTATION ON HYDROGEN GAS PRODUCTION BY PARTIAL OXIDATION OF HEAVY FUEL OI...PRESENTATION ON HYDROGEN GAS PRODUCTION BY PARTIAL OXIDATION OF HEAVY FUEL OI...
PRESENTATION ON HYDROGEN GAS PRODUCTION BY PARTIAL OXIDATION OF HEAVY FUEL OI...
 
Coal to Methanol Senior Design Project Final Report
Coal to Methanol Senior Design Project Final ReportCoal to Methanol Senior Design Project Final Report
Coal to Methanol Senior Design Project Final Report
 
I1303066270
I1303066270I1303066270
I1303066270
 
10.1016@j.ijhydene.2015.09.064
10.1016@j.ijhydene.2015.09.06410.1016@j.ijhydene.2015.09.064
10.1016@j.ijhydene.2015.09.064
 
Energy audit of boiler
Energy audit of boilerEnergy audit of boiler
Energy audit of boiler
 
HYDROGEN GAS PRODUCTION BY PARTIAL OXIDATION OF HEAVY FUEL OIL
HYDROGEN GAS PRODUCTION BY PARTIAL OXIDATION OF HEAVY FUEL OILHYDROGEN GAS PRODUCTION BY PARTIAL OXIDATION OF HEAVY FUEL OIL
HYDROGEN GAS PRODUCTION BY PARTIAL OXIDATION OF HEAVY FUEL OIL
 
Nitric Acid Production Plant
Nitric Acid Production Plant Nitric Acid Production Plant
Nitric Acid Production Plant
 
Hydrogen Production steam reforming
Hydrogen Production steam reformingHydrogen Production steam reforming
Hydrogen Production steam reforming
 
ChE184B - FinalDesign
ChE184B - FinalDesignChE184B - FinalDesign
ChE184B - FinalDesign
 
IRJET- LPG based Refrigeration System
IRJET-  	  LPG based Refrigeration SystemIRJET-  	  LPG based Refrigeration System
IRJET- LPG based Refrigeration System
 
IJSRED-V2I5P17
IJSRED-V2I5P17IJSRED-V2I5P17
IJSRED-V2I5P17
 
Maximizing the Gas Processing Market by Combining NGL Recovery with LNG
Maximizing the Gas Processing Market by Combining NGL Recovery with LNGMaximizing the Gas Processing Market by Combining NGL Recovery with LNG
Maximizing the Gas Processing Market by Combining NGL Recovery with LNG
 
PRESENTATION
PRESENTATIONPRESENTATION
PRESENTATION
 
ChE184b Final Design
ChE184b Final DesignChE184b Final Design
ChE184b Final Design
 
Heatreflex
HeatreflexHeatreflex
Heatreflex
 
Topsoe large scale_methanol_prod_paper
Topsoe large scale_methanol_prod_paperTopsoe large scale_methanol_prod_paper
Topsoe large scale_methanol_prod_paper
 
Burr mach - georgeson air emissions modeling advances - to gpa
Burr   mach - georgeson air emissions modeling advances - to gpaBurr   mach - georgeson air emissions modeling advances - to gpa
Burr mach - georgeson air emissions modeling advances - to gpa
 

Andere mochten auch

PEM Water Electrolysis
PEM Water ElectrolysisPEM Water Electrolysis
PEM Water Electrolysis
Richard Smith
 
ETOGAS company presentation Dr. Karl Maria Grünauer
ETOGAS company presentation Dr. Karl Maria GrünauerETOGAS company presentation Dr. Karl Maria Grünauer
ETOGAS company presentation Dr. Karl Maria Grünauer
Dr. Karl Maria Grünauer
 
social media marketing tools and it impact on youth
social media marketing tools and it impact on youth social media marketing tools and it impact on youth
social media marketing tools and it impact on youth
Swati Sharma
 
Electrolysis part 3 aqueous solution
Electrolysis part 3 aqueous solutionElectrolysis part 3 aqueous solution
Electrolysis part 3 aqueous solution
kaiying
 
Impact of Social media on Consumer Preferences in Fashion Trends
Impact of Social media on Consumer Preferences in Fashion TrendsImpact of Social media on Consumer Preferences in Fashion Trends
Impact of Social media on Consumer Preferences in Fashion Trends
Rohina Banerjee
 
Solar collectors
Solar collectorsSolar collectors
Solar collectors
Vivek Khare
 
6564845 flat-plate-collector
6564845 flat-plate-collector6564845 flat-plate-collector
6564845 flat-plate-collector
zia khan
 
Solar collectors nces
Solar collectors ncesSolar collectors nces
Solar collectors nces
Anu71
 
OPERATION MANAGEMENT REPORT: A CASE-STUDY ON THE KEY STRATEGIC AND OPERATIONA...
OPERATION MANAGEMENT REPORT: A CASE-STUDY ON THE KEY STRATEGIC AND OPERATIONA...OPERATION MANAGEMENT REPORT: A CASE-STUDY ON THE KEY STRATEGIC AND OPERATIONA...
OPERATION MANAGEMENT REPORT: A CASE-STUDY ON THE KEY STRATEGIC AND OPERATIONA...
Maxie Tran
 

Andere mochten auch (20)

PEM Water Electrolysis
PEM Water ElectrolysisPEM Water Electrolysis
PEM Water Electrolysis
 
Building information modeling
Building information modelingBuilding information modeling
Building information modeling
 
Renewable hydrogen electrolyzer
Renewable hydrogen electrolyzerRenewable hydrogen electrolyzer
Renewable hydrogen electrolyzer
 
Production management and material management project report on GOMA Engineer...
Production management and material management project report on GOMA Engineer...Production management and material management project report on GOMA Engineer...
Production management and material management project report on GOMA Engineer...
 
Spectracarb porous graphite current collectors for pem electrolyzers
Spectracarb porous graphite current collectors for pem electrolyzersSpectracarb porous graphite current collectors for pem electrolyzers
Spectracarb porous graphite current collectors for pem electrolyzers
 
ETOGAS company presentation Dr. Karl Maria Grünauer
ETOGAS company presentation Dr. Karl Maria GrünauerETOGAS company presentation Dr. Karl Maria Grünauer
ETOGAS company presentation Dr. Karl Maria Grünauer
 
Analysis and optimization of maintenances management of instruments
Analysis and optimization of maintenances management of instrumentsAnalysis and optimization of maintenances management of instruments
Analysis and optimization of maintenances management of instruments
 
social media marketing tools and it impact on youth
social media marketing tools and it impact on youth social media marketing tools and it impact on youth
social media marketing tools and it impact on youth
 
Electrolysis part 3 aqueous solution
Electrolysis part 3 aqueous solutionElectrolysis part 3 aqueous solution
Electrolysis part 3 aqueous solution
 
Impact of Social media on Consumer Preferences in Fashion Trends
Impact of Social media on Consumer Preferences in Fashion TrendsImpact of Social media on Consumer Preferences in Fashion Trends
Impact of Social media on Consumer Preferences in Fashion Trends
 
Factors affecting electrolysis
Factors affecting electrolysisFactors affecting electrolysis
Factors affecting electrolysis
 
Project report on just in time production
Project report on just in time productionProject report on just in time production
Project report on just in time production
 
Solar collectors
Solar collectorsSolar collectors
Solar collectors
 
6564845 flat-plate-collector
6564845 flat-plate-collector6564845 flat-plate-collector
6564845 flat-plate-collector
 
Solar collectors nces
Solar collectors ncesSolar collectors nces
Solar collectors nces
 
MBA -Project Study Report
MBA -Project Study Report MBA -Project Study Report
MBA -Project Study Report
 
OPERATION MANAGEMENT REPORT: A CASE-STUDY ON THE KEY STRATEGIC AND OPERATIONA...
OPERATION MANAGEMENT REPORT: A CASE-STUDY ON THE KEY STRATEGIC AND OPERATIONA...OPERATION MANAGEMENT REPORT: A CASE-STUDY ON THE KEY STRATEGIC AND OPERATIONA...
OPERATION MANAGEMENT REPORT: A CASE-STUDY ON THE KEY STRATEGIC AND OPERATIONA...
 
“A comparative study on consumer preference between Whatsapp and Hike messeng...
“A comparative study on consumer preference between Whatsapp and Hike messeng...“A comparative study on consumer preference between Whatsapp and Hike messeng...
“A comparative study on consumer preference between Whatsapp and Hike messeng...
 
Solar flat plate collector
Solar flat plate collectorSolar flat plate collector
Solar flat plate collector
 
A Winter Project Report on Production Department Analysis of "Italia Ceramics...
A Winter Project Report on Production Department Analysis of "Italia Ceramics...A Winter Project Report on Production Department Analysis of "Italia Ceramics...
A Winter Project Report on Production Department Analysis of "Italia Ceramics...
 

Ähnlich wie Mitacs hydrofuel-uoit nov 2015 200 pp cost and tech analysis of a wide variety of integrated ammonia production method

AICHE Senior Design Project
AICHE Senior Design ProjectAICHE Senior Design Project
AICHE Senior Design Project
Jonathan Sherwin
 
DoE_Final_Report_H2_Electrolyzer_PUBLIC_version
DoE_Final_Report_H2_Electrolyzer_PUBLIC_versionDoE_Final_Report_H2_Electrolyzer_PUBLIC_version
DoE_Final_Report_H2_Electrolyzer_PUBLIC_version
Dana Ray Nilsson (Swalla)
 
Ureap lant energy improved with operation philosophyand reactor internals
Ureap lant energy improved with operation philosophyand reactor internalsUreap lant energy improved with operation philosophyand reactor internals
Ureap lant energy improved with operation philosophyand reactor internals
Prem Baboo
 

Ähnlich wie Mitacs hydrofuel-uoit nov 2015 200 pp cost and tech analysis of a wide variety of integrated ammonia production method (20)

Low energy consumption_ammonia_production_2011_paper
Low energy consumption_ammonia_production_2011_paperLow energy consumption_ammonia_production_2011_paper
Low energy consumption_ammonia_production_2011_paper
 
A case study on Process Condensate Stripper in Ammonia Plant by Prem Baboo.pdf
A case study on Process Condensate Stripper in Ammonia Plant by Prem Baboo.pdfA case study on Process Condensate Stripper in Ammonia Plant by Prem Baboo.pdf
A case study on Process Condensate Stripper in Ammonia Plant by Prem Baboo.pdf
 
AICHE Senior Design Project
AICHE Senior Design ProjectAICHE Senior Design Project
AICHE Senior Design Project
 
IRJET- Performance Analysis of Gasoline Engine using HHO Gas as Fuel
IRJET- Performance Analysis of Gasoline Engine using HHO Gas as FuelIRJET- Performance Analysis of Gasoline Engine using HHO Gas as Fuel
IRJET- Performance Analysis of Gasoline Engine using HHO Gas as Fuel
 
Energy Auditing of Thermal Power plant
Energy Auditing of Thermal Power plantEnergy Auditing of Thermal Power plant
Energy Auditing of Thermal Power plant
 
289109277 design-project-1-final
289109277 design-project-1-final289109277 design-project-1-final
289109277 design-project-1-final
 
Hydrogen as a fuel additive to increase the efficiency by reducing the fuel c...
Hydrogen as a fuel additive to increase the efficiency by reducing the fuel c...Hydrogen as a fuel additive to increase the efficiency by reducing the fuel c...
Hydrogen as a fuel additive to increase the efficiency by reducing the fuel c...
 
hydrogen as a fuel additive to increase overall efficiency of vehicle by red...
hydrogen as a fuel additive to increase overall efficiency of  vehicle by red...hydrogen as a fuel additive to increase overall efficiency of  vehicle by red...
hydrogen as a fuel additive to increase overall efficiency of vehicle by red...
 
DoE_Final_Report_H2_Electrolyzer_PUBLIC_version
DoE_Final_Report_H2_Electrolyzer_PUBLIC_versionDoE_Final_Report_H2_Electrolyzer_PUBLIC_version
DoE_Final_Report_H2_Electrolyzer_PUBLIC_version
 
Experimental Analysis of an Regenerative Air Preheater In Boiler TPS- 1 Expan...
Experimental Analysis of an Regenerative Air Preheater In Boiler TPS- 1 Expan...Experimental Analysis of an Regenerative Air Preheater In Boiler TPS- 1 Expan...
Experimental Analysis of an Regenerative Air Preheater In Boiler TPS- 1 Expan...
 
IRJET- Enhancement of Performance of Catalytic Converter using Phase Change M...
IRJET- Enhancement of Performance of Catalytic Converter using Phase Change M...IRJET- Enhancement of Performance of Catalytic Converter using Phase Change M...
IRJET- Enhancement of Performance of Catalytic Converter using Phase Change M...
 
A1 Dispenser Stations 1.pdf
A1 Dispenser Stations 1.pdfA1 Dispenser Stations 1.pdf
A1 Dispenser Stations 1.pdf
 
ie5032056
ie5032056ie5032056
ie5032056
 
IRJET- Performance and Evaluation of Aqua Ammonia Air Conditioner System ...
IRJET-  	  Performance and Evaluation of Aqua Ammonia Air Conditioner System ...IRJET-  	  Performance and Evaluation of Aqua Ammonia Air Conditioner System ...
IRJET- Performance and Evaluation of Aqua Ammonia Air Conditioner System ...
 
Biomass gassification based ammonia plant
Biomass gassification based ammonia plantBiomass gassification based ammonia plant
Biomass gassification based ammonia plant
 
Pnw 5pp 02
Pnw 5pp 02Pnw 5pp 02
Pnw 5pp 02
 
Performance comparison of PEMFC hydrogen reformer with different controllers
Performance comparison of PEMFC hydrogen reformer with different controllersPerformance comparison of PEMFC hydrogen reformer with different controllers
Performance comparison of PEMFC hydrogen reformer with different controllers
 
IRJET- Co2 Mitigation
IRJET- Co2 MitigationIRJET- Co2 Mitigation
IRJET- Co2 Mitigation
 
Ureap lant energy improved with operation philosophyand reactor internals
Ureap lant energy improved with operation philosophyand reactor internalsUreap lant energy improved with operation philosophyand reactor internals
Ureap lant energy improved with operation philosophyand reactor internals
 
Projecct for linkedin
Projecct for linkedinProjecct for linkedin
Projecct for linkedin
 

Mehr von Steve Wittrig

Atlas v-2015 Department of Energy (DOE) Carbon Storage Atlas Julio et al 2015
Atlas v-2015 Department of Energy (DOE) Carbon Storage Atlas Julio et al 2015Atlas v-2015 Department of Energy (DOE) Carbon Storage Atlas Julio et al 2015
Atlas v-2015 Department of Energy (DOE) Carbon Storage Atlas Julio et al 2015
Steve Wittrig
 
Mitacs hydrofuel-uoit comparative assessment of nh3 production and utilizatio...
Mitacs hydrofuel-uoit comparative assessment of nh3 production and utilizatio...Mitacs hydrofuel-uoit comparative assessment of nh3 production and utilizatio...
Mitacs hydrofuel-uoit comparative assessment of nh3 production and utilizatio...
Steve Wittrig
 
mitacs uoit study it05701 july 2015 vezina comparative ammonia costs producti...
mitacs uoit study it05701 july 2015 vezina comparative ammonia costs producti...mitacs uoit study it05701 july 2015 vezina comparative ammonia costs producti...
mitacs uoit study it05701 july 2015 vezina comparative ammonia costs producti...
Steve Wittrig
 
Greg vezina-key-life-cycle-numbers-for-nh3-green-and-brown-energy-nh3fa20161
Greg vezina-key-life-cycle-numbers-for-nh3-green-and-brown-energy-nh3fa20161Greg vezina-key-life-cycle-numbers-for-nh3-green-and-brown-energy-nh3fa20161
Greg vezina-key-life-cycle-numbers-for-nh3-green-and-brown-energy-nh3fa20161
Steve Wittrig
 
Air liquide lurgi 2016 overview of coal heavy oil ch4 to syngas h2 ammonia me...
Air liquide lurgi 2016 overview of coal heavy oil ch4 to syngas h2 ammonia me...Air liquide lurgi 2016 overview of coal heavy oil ch4 to syngas h2 ammonia me...
Air liquide lurgi 2016 overview of coal heavy oil ch4 to syngas h2 ammonia me...
Steve Wittrig
 
Floating city-project-report-4 25-2014 seasteading institute white paper
Floating city-project-report-4 25-2014 seasteading institute white paperFloating city-project-report-4 25-2014 seasteading institute white paper
Floating city-project-report-4 25-2014 seasteading institute white paper
Steve Wittrig
 

Mehr von Steve Wittrig (20)

HYDROFUEL KINETIC EMERGY BROCHURE AICHE
HYDROFUEL KINETIC EMERGY BROCHURE AICHEHYDROFUEL KINETIC EMERGY BROCHURE AICHE
HYDROFUEL KINETIC EMERGY BROCHURE AICHE
 
Mitacs comprehensive evaluation of nh3 production and utilization options for...
Mitacs comprehensive evaluation of nh3 production and utilization options for...Mitacs comprehensive evaluation of nh3 production and utilization options for...
Mitacs comprehensive evaluation of nh3 production and utilization options for...
 
Ammonia (nh3) as a potential transportation solution for ontario uoit dincer ...
Ammonia (nh3) as a potential transportation solution for ontario uoit dincer ...Ammonia (nh3) as a potential transportation solution for ontario uoit dincer ...
Ammonia (nh3) as a potential transportation solution for ontario uoit dincer ...
 
Ammonia (nh3) as a carbon free fuel uoit vezina white paper hydrofuel
Ammonia (nh3) as a carbon free fuel uoit vezina white paper hydrofuelAmmonia (nh3) as a carbon free fuel uoit vezina white paper hydrofuel
Ammonia (nh3) as a carbon free fuel uoit vezina white paper hydrofuel
 
KINETIC EMERGY OVERVIEW AND RESUME DR STEVE WITTRIG SEP17
KINETIC EMERGY OVERVIEW AND RESUME DR STEVE WITTRIG SEP17KINETIC EMERGY OVERVIEW AND RESUME DR STEVE WITTRIG SEP17
KINETIC EMERGY OVERVIEW AND RESUME DR STEVE WITTRIG SEP17
 
Tsinghua bp clean energy centre established time magazine tony blair 2003
Tsinghua bp clean energy centre established time magazine tony blair 2003Tsinghua bp clean energy centre established time magazine tony blair 2003
Tsinghua bp clean energy centre established time magazine tony blair 2003
 
Resume Dr T Stephen Wittrig
Resume Dr T Stephen WittrigResume Dr T Stephen Wittrig
Resume Dr T Stephen Wittrig
 
Atlas v-2015 Department of Energy (DOE) Carbon Storage Atlas Julio et al 2015
Atlas v-2015 Department of Energy (DOE) Carbon Storage Atlas Julio et al 2015Atlas v-2015 Department of Energy (DOE) Carbon Storage Atlas Julio et al 2015
Atlas v-2015 Department of Energy (DOE) Carbon Storage Atlas Julio et al 2015
 
Mitacs hydrofuel-uoit comparative assessment of nh3 production and utilizatio...
Mitacs hydrofuel-uoit comparative assessment of nh3 production and utilizatio...Mitacs hydrofuel-uoit comparative assessment of nh3 production and utilizatio...
Mitacs hydrofuel-uoit comparative assessment of nh3 production and utilizatio...
 
mitacs uoit study it05701 july 2015 vezina comparative ammonia costs producti...
mitacs uoit study it05701 july 2015 vezina comparative ammonia costs producti...mitacs uoit study it05701 july 2015 vezina comparative ammonia costs producti...
mitacs uoit study it05701 july 2015 vezina comparative ammonia costs producti...
 
Greg vezina-key-life-cycle-numbers-for-nh3-green-and-brown-energy-nh3fa20161
Greg vezina-key-life-cycle-numbers-for-nh3-green-and-brown-energy-nh3fa20161Greg vezina-key-life-cycle-numbers-for-nh3-green-and-brown-energy-nh3fa20161
Greg vezina-key-life-cycle-numbers-for-nh3-green-and-brown-energy-nh3fa20161
 
2016 state-of-the-climate-report cfact
2016 state-of-the-climate-report cfact2016 state-of-the-climate-report cfact
2016 state-of-the-climate-report cfact
 
China automotive energy research center brief rr advisory committee ditan lab...
China automotive energy research center brief rr advisory committee ditan lab...China automotive energy research center brief rr advisory committee ditan lab...
China automotive energy research center brief rr advisory committee ditan lab...
 
Methanol institute 2016 overview of rapidly emerging methanol markets for fue...
Methanol institute 2016 overview of rapidly emerging methanol markets for fue...Methanol institute 2016 overview of rapidly emerging methanol markets for fue...
Methanol institute 2016 overview of rapidly emerging methanol markets for fue...
 
Air liquide lurgi 2016 overview of coal heavy oil ch4 to syngas h2 ammonia me...
Air liquide lurgi 2016 overview of coal heavy oil ch4 to syngas h2 ammonia me...Air liquide lurgi 2016 overview of coal heavy oil ch4 to syngas h2 ammonia me...
Air liquide lurgi 2016 overview of coal heavy oil ch4 to syngas h2 ammonia me...
 
Floating city-project-report-4 25-2014 seasteading institute white paper
Floating city-project-report-4 25-2014 seasteading institute white paperFloating city-project-report-4 25-2014 seasteading institute white paper
Floating city-project-report-4 25-2014 seasteading institute white paper
 
Roles of cecc eil ceftf evolution and sources of value - china programs kinet...
Roles of cecc eil ceftf evolution and sources of value - china programs kinet...Roles of cecc eil ceftf evolution and sources of value - china programs kinet...
Roles of cecc eil ceftf evolution and sources of value - china programs kinet...
 
Shenhua ccs program strategy and accomplishments for China Ren Xiankun 2009
Shenhua ccs program strategy and accomplishments for China Ren Xiankun 2009Shenhua ccs program strategy and accomplishments for China Ren Xiankun 2009
Shenhua ccs program strategy and accomplishments for China Ren Xiankun 2009
 
Zhang wenjiang shenhua direct coal liquefaction project 6 billion usd first...
Zhang wenjiang   shenhua direct coal liquefaction project 6 billion usd first...Zhang wenjiang   shenhua direct coal liquefaction project 6 billion usd first...
Zhang wenjiang shenhua direct coal liquefaction project 6 billion usd first...
 
Zhang yuzhuo CEO 2011 china shenhua coal conversion powerpoint LARGEST COAL C...
Zhang yuzhuo CEO 2011 china shenhua coal conversion powerpoint LARGEST COAL C...Zhang yuzhuo CEO 2011 china shenhua coal conversion powerpoint LARGEST COAL C...
Zhang yuzhuo CEO 2011 china shenhua coal conversion powerpoint LARGEST COAL C...
 

Kürzlich hochgeladen

Call Now ≽ 9953056974 ≼🔝 Call Girls In New Ashok Nagar ≼🔝 Delhi door step de...
Call Now ≽ 9953056974 ≼🔝 Call Girls In New Ashok Nagar  ≼🔝 Delhi door step de...Call Now ≽ 9953056974 ≼🔝 Call Girls In New Ashok Nagar  ≼🔝 Delhi door step de...
Call Now ≽ 9953056974 ≼🔝 Call Girls In New Ashok Nagar ≼🔝 Delhi door step de...
9953056974 Low Rate Call Girls In Saket, Delhi NCR
 
Cara Menggugurkan Sperma Yang Masuk Rahim Biyar Tidak Hamil
Cara Menggugurkan Sperma Yang Masuk Rahim Biyar Tidak HamilCara Menggugurkan Sperma Yang Masuk Rahim Biyar Tidak Hamil
Cara Menggugurkan Sperma Yang Masuk Rahim Biyar Tidak Hamil
Cara Menggugurkan Kandungan 087776558899
 
VIP Call Girls Ankleshwar 7001035870 Whatsapp Number, 24/07 Booking
VIP Call Girls Ankleshwar 7001035870 Whatsapp Number, 24/07 BookingVIP Call Girls Ankleshwar 7001035870 Whatsapp Number, 24/07 Booking
VIP Call Girls Ankleshwar 7001035870 Whatsapp Number, 24/07 Booking
dharasingh5698
 
Call Girls In Bangalore ☎ 7737669865 🥵 Book Your One night Stand
Call Girls In Bangalore ☎ 7737669865 🥵 Book Your One night StandCall Girls In Bangalore ☎ 7737669865 🥵 Book Your One night Stand
Call Girls In Bangalore ☎ 7737669865 🥵 Book Your One night Stand
amitlee9823
 
Call Girls in Netaji Nagar, Delhi 💯 Call Us 🔝9953056974 🔝 Escort Service
Call Girls in Netaji Nagar, Delhi 💯 Call Us 🔝9953056974 🔝 Escort ServiceCall Girls in Netaji Nagar, Delhi 💯 Call Us 🔝9953056974 🔝 Escort Service
Call Girls in Netaji Nagar, Delhi 💯 Call Us 🔝9953056974 🔝 Escort Service
9953056974 Low Rate Call Girls In Saket, Delhi NCR
 
VIP Call Girls Palanpur 7001035870 Whatsapp Number, 24/07 Booking
VIP Call Girls Palanpur 7001035870 Whatsapp Number, 24/07 BookingVIP Call Girls Palanpur 7001035870 Whatsapp Number, 24/07 Booking
VIP Call Girls Palanpur 7001035870 Whatsapp Number, 24/07 Booking
dharasingh5698
 
Top Rated Call Girls In chittoor 📱 {7001035870} VIP Escorts chittoor
Top Rated Call Girls In chittoor 📱 {7001035870} VIP Escorts chittoorTop Rated Call Girls In chittoor 📱 {7001035870} VIP Escorts chittoor
Top Rated Call Girls In chittoor 📱 {7001035870} VIP Escorts chittoor
dharasingh5698
 

Kürzlich hochgeladen (20)

CCS335 _ Neural Networks and Deep Learning Laboratory_Lab Complete Record
CCS335 _ Neural Networks and Deep Learning Laboratory_Lab Complete RecordCCS335 _ Neural Networks and Deep Learning Laboratory_Lab Complete Record
CCS335 _ Neural Networks and Deep Learning Laboratory_Lab Complete Record
 
Booking open Available Pune Call Girls Koregaon Park 6297143586 Call Hot Ind...
Booking open Available Pune Call Girls Koregaon Park  6297143586 Call Hot Ind...Booking open Available Pune Call Girls Koregaon Park  6297143586 Call Hot Ind...
Booking open Available Pune Call Girls Koregaon Park 6297143586 Call Hot Ind...
 
Unit 2- Effective stress & Permeability.pdf
Unit 2- Effective stress & Permeability.pdfUnit 2- Effective stress & Permeability.pdf
Unit 2- Effective stress & Permeability.pdf
 
Call Now ≽ 9953056974 ≼🔝 Call Girls In New Ashok Nagar ≼🔝 Delhi door step de...
Call Now ≽ 9953056974 ≼🔝 Call Girls In New Ashok Nagar  ≼🔝 Delhi door step de...Call Now ≽ 9953056974 ≼🔝 Call Girls In New Ashok Nagar  ≼🔝 Delhi door step de...
Call Now ≽ 9953056974 ≼🔝 Call Girls In New Ashok Nagar ≼🔝 Delhi door step de...
 
Cara Menggugurkan Sperma Yang Masuk Rahim Biyar Tidak Hamil
Cara Menggugurkan Sperma Yang Masuk Rahim Biyar Tidak HamilCara Menggugurkan Sperma Yang Masuk Rahim Biyar Tidak Hamil
Cara Menggugurkan Sperma Yang Masuk Rahim Biyar Tidak Hamil
 
Online banking management system project.pdf
Online banking management system project.pdfOnline banking management system project.pdf
Online banking management system project.pdf
 
VIP Call Girls Ankleshwar 7001035870 Whatsapp Number, 24/07 Booking
VIP Call Girls Ankleshwar 7001035870 Whatsapp Number, 24/07 BookingVIP Call Girls Ankleshwar 7001035870 Whatsapp Number, 24/07 Booking
VIP Call Girls Ankleshwar 7001035870 Whatsapp Number, 24/07 Booking
 
chapter 5.pptx: drainage and irrigation engineering
chapter 5.pptx: drainage and irrigation engineeringchapter 5.pptx: drainage and irrigation engineering
chapter 5.pptx: drainage and irrigation engineering
 
Call Girls In Bangalore ☎ 7737669865 🥵 Book Your One night Stand
Call Girls In Bangalore ☎ 7737669865 🥵 Book Your One night StandCall Girls In Bangalore ☎ 7737669865 🥵 Book Your One night Stand
Call Girls In Bangalore ☎ 7737669865 🥵 Book Your One night Stand
 
Call Girls in Netaji Nagar, Delhi 💯 Call Us 🔝9953056974 🔝 Escort Service
Call Girls in Netaji Nagar, Delhi 💯 Call Us 🔝9953056974 🔝 Escort ServiceCall Girls in Netaji Nagar, Delhi 💯 Call Us 🔝9953056974 🔝 Escort Service
Call Girls in Netaji Nagar, Delhi 💯 Call Us 🔝9953056974 🔝 Escort Service
 
(INDIRA) Call Girl Meerut Call Now 8617697112 Meerut Escorts 24x7
(INDIRA) Call Girl Meerut Call Now 8617697112 Meerut Escorts 24x7(INDIRA) Call Girl Meerut Call Now 8617697112 Meerut Escorts 24x7
(INDIRA) Call Girl Meerut Call Now 8617697112 Meerut Escorts 24x7
 
Double rodded leveling 1 pdf activity 01
Double rodded leveling 1 pdf activity 01Double rodded leveling 1 pdf activity 01
Double rodded leveling 1 pdf activity 01
 
Call Girls Wakad Call Me 7737669865 Budget Friendly No Advance Booking
Call Girls Wakad Call Me 7737669865 Budget Friendly No Advance BookingCall Girls Wakad Call Me 7737669865 Budget Friendly No Advance Booking
Call Girls Wakad Call Me 7737669865 Budget Friendly No Advance Booking
 
VIP Call Girls Palanpur 7001035870 Whatsapp Number, 24/07 Booking
VIP Call Girls Palanpur 7001035870 Whatsapp Number, 24/07 BookingVIP Call Girls Palanpur 7001035870 Whatsapp Number, 24/07 Booking
VIP Call Girls Palanpur 7001035870 Whatsapp Number, 24/07 Booking
 
Intze Overhead Water Tank Design by Working Stress - IS Method.pdf
Intze Overhead Water Tank  Design by Working Stress - IS Method.pdfIntze Overhead Water Tank  Design by Working Stress - IS Method.pdf
Intze Overhead Water Tank Design by Working Stress - IS Method.pdf
 
Top Rated Call Girls In chittoor 📱 {7001035870} VIP Escorts chittoor
Top Rated Call Girls In chittoor 📱 {7001035870} VIP Escorts chittoorTop Rated Call Girls In chittoor 📱 {7001035870} VIP Escorts chittoor
Top Rated Call Girls In chittoor 📱 {7001035870} VIP Escorts chittoor
 
Unleashing the Power of the SORA AI lastest leap
Unleashing the Power of the SORA AI lastest leapUnleashing the Power of the SORA AI lastest leap
Unleashing the Power of the SORA AI lastest leap
 
Intro To Electric Vehicles PDF Notes.pdf
Intro To Electric Vehicles PDF Notes.pdfIntro To Electric Vehicles PDF Notes.pdf
Intro To Electric Vehicles PDF Notes.pdf
 
Generative AI or GenAI technology based PPT
Generative AI or GenAI technology based PPTGenerative AI or GenAI technology based PPT
Generative AI or GenAI technology based PPT
 
Work-Permit-Receiver-in-Saudi-Aramco.pptx
Work-Permit-Receiver-in-Saudi-Aramco.pptxWork-Permit-Receiver-in-Saudi-Aramco.pptx
Work-Permit-Receiver-in-Saudi-Aramco.pptx
 

Mitacs hydrofuel-uoit nov 2015 200 pp cost and tech analysis of a wide variety of integrated ammonia production method

  • 1.   Mitacs Accelerate Project Final Report Comparative assessment of NH3 production and utilization in transportation systems for Ontario Period: May-November 2015 Submission Date: November 23, 2015 Supervisor: Prof. Dr. Ibrahim Dincer Intern: Yusuf Bicer Partner Organization: Hydrofuel Inc. Application Ref: IT05701 Funding Request Ref: FR11885 Invoice Ref: 1516-10898 Mitacs File: ON – IRDI
  • 2. 1    TABLE OF CONTENTS Table of Contents...........................................................................................................................1 Acknowledgment............................................................................................................................2 Summary.........................................................................................................................................3 I. Feasibility Analysis.....................................................................................................................4 1. Feasibility analysis of high-pressure electrolysis based ammonia production............................4 1.1 Economic analysis of high pressure PEM electrolyzer based hydrogen and ammonia production ......................................................................................................................................17 2. Feasibility analysis of cryogenic air separation for nitrogen production in ammonia synthesis ........................................................................................................................................................19 2.1 Air separation unit cost analysis ..............................................................................................20 3. Feasibility analysis of Haber-Bosch ammonia synthesis loop...................................................22 4. Feasibility analysis of electrolyzers in hydrogen production process .......................................26 II. Case Studies.............................................................................................................................29 Conclusions...................................................................................................................................47 Nomenclature ...............................................................................................................................48 References.....................................................................................................................................49 Appendix 1: Progress Report 1 (May-August 2015).................................................................52 Appendix 2: Progress Report 2 (August-October 2015) ..........................................................96
  • 3. 2    ACKNOWLEDGEMENT The principal investigator and intern acknowledge the financial support provided by the Mitacs and Hydrofuel Inc.
  • 4. 3    SUMMARY In this final project report, detailed cost and feasibility analyses of selected cases are conducted. The case studies included in this report are as follows: (i) high pressure electrolysis using low cost hydropower electricity and Haber-Bosch based ammonia production; (ii) high pressure electrolysis using low cost hydropower electricity, liquefied nitrogen pumping and no main compressor Haber- Bosch based ammonia production; (iii) ammonia production using high pressure electrolysis via low cost hydropower electricity, liquefied nitrogen pumping, liquid nitrogen vaporization using Haber-Bosch excess heat without compressors; (iv) ammonia production using thermal plasma disassociation of methane and vaporization of high pressure liquid nitrogen via excess heat in Haber-Bosch process; (v) comparison of pumped hydro storage and ammonia production using excess power; (vi) wind based electrolysis based hydrogen production with Haber-Bosch process; (vii) nuclear high temperature electrolysis based ammonia production options. The results of this project report indicates that the compression cost of hydrogen to about 20 bar corresponds to 1.03 $/kg H2 which constitutes approximately 15% of the overall hydrogen production cost. Therefore, high pressure water electrolysis system is an alternative option for reducing the required power of ammonia synthesis process by eliminating the main compressors in the ammonia synthesis process. Utilizing high pressure PEM electrolyzers have the capability to reduce hydrogen production cost about 0.40 $/kg compared to mechanical compression. Using pressurized water require less power than using hydrogen compressor which decreases the required power. The lowest cost of high pressure electrolysis based ammonia production is calculated to be 0.76 US $/kg for 3.5 US cent/kWh electricity price. Thermal plasma disassociation of methane is an alternative option for ammonia production which brings approximately 20% less power input. When carbon black sales are considered, the cost of ammonia can decrease down to 0.42 $/kg which is quite lower than other methods. However, the process of liquefied natural gas production and the effect of high pressure need to be analyzed in detail in order to assess the overall performance. At present, the average ammonia selling price is about 770 US$/ton in the USA. In the case where the ammonia production cost was achieved under 700 US$/ton, the pumped hydro storage plant yearly profit would be nearly same with a 300 ton/day ammonia production plant profit with a power requirement of 145 MW. However, the capital installation cost of pumped storage hydro plant becomes nearly twice of ammonia plant. Nuclear based ammonia production options are cost competitive than other methods however the initial investment costs are much higher. The high capital costs are the major disadvantage of nuclear powered ammonia production however, by enabling smaller and standardized modular reactors, it could reduce the capital costs, construction cost and time, licensing cost and time. Developed Haber-Bosch technology would be optimized using liquid pumping instead of feed gases compression, high pressure electrolysis and liquid nitrogen and LNG vaporization via excess heat of Haber-Bosch reactor. Furthermore, the previously completed progress reports are appended to this current report.
  • 5. 4    I. FEASIBILITY ANALYSIS In this section, the feasibility analysis of high pressure electrolysis, Haber-Bosch process, cryogenic air separation, ammonia synthesis loop are conducted and the total investment costs are comparatively assessed. 1. Feasibility analysis of high-pressure electrolysis based ammonia production In high temperature electrolysis process, the modification to a normal proton exchange membrane electrolyzer is that instead of having an atmospheric pressure hydrogen as end product, compressed hydrogen is produced between 120–200 bar at 70°C-120°C. Therefore, by pressurizing the hydrogen in the electrolyzer instead of pressurizing in the compressor, the necessity for an external hydrogen compressor is eliminated. The advantages and disadvantages of high pressure PEM electrolysis can be listed as in Table 1. Table 1. The advantages and disadvantages of high pressure PEM electrolysis Advantages Disadvantages Elimination of multiple stage mechanical compression. Loss of stack seals and membrane extrusion into fluid ports Decrease in complexity of the system. Need of improved strength without effecting conductivity Lower drying requirement Increasing membrane degradation with operating pressure Less maintenance requirement Important growth in chemical degradation rate under high pressure operation No moving parts Low resistance because of thin membranes, allowing efficient operation at high current densities. No contaminants Similar faradaic losses in PEM fuel cells and electrochemical hydrogen compressors under same operating conditions and membrane selection Flexibility of hydrogen production at end user site High back diffusion Source: Data from Ref. [1]. Although there are some drawbacks of high pressure PEM electrolysis systems, together with the improvements, the advantages in cost reduction makes this technology promising for the near future hydrogen production options.
  • 6. 5    Fig. 1. Electrolysis based hydrogen production and delivery cost contribution from different processes in $/kg (data from Ref. [1]) As it can be seen in Fig. 1, delivery cost of hydrogen after production constitutes approximately 38 % of the overall cost. Delivery does not only include transmission but also compression of the hydrogen after production at standard pressures. The detailed cost distribution of delivery process for hydrogen is illustrated in Fig. 2. The compression cost of hydrogen to about 20 bar is 1.03$/kg which corresponds to 15% of the overall cost. The DOE Forecourt H2A Model (Ver. 3.0) was used to project the cost of hydrogen production with the high pressure electrolysis technology. Tradeoffs of operating pressure, system efficiency and capital costs were conducted using a standard set of assumptions and cost parameters. The cost of electricity is considered as US$0.061/kWh [1, 2]. Fig. 2. Hydrogen compression and delivery cost contribution from different sub-processes in $/kg (data from Ref. [1]) $0.10 $0.30 $0.70 $2.50 $3.00 Variable Costs Fixed O&M Capital Costs Compression,Storage and Dispensing Feedstock Costs $1.03 $1.04 $0.10 $0.16 $0.14 Compression Storage Dispenser Refrigiration Remainder of Station
  • 7. 6    Fig. 3. Cost of compression in high pressure PEM electrolyzer (data from Ref. [1]) Fig. 3 and Table 2 show that if high pressure electrolyzer is used at 432 bar, the compression cost decreases to 0.31 US$/kg but feedstock cost increase becomes 0.31 US$/kg. The cost of electricity is considered as US$0.061/kWh. As mentioned previously, The DOE Forecourt H2A Model was used for the cost calculations. Table 2. Cost comparison of using compressors or high pressure electrolyzers Pressure (bar) Compression Cost ($/kg) Additional Feedstock Cost ($/kg) Total Cost ($/kg) 21 1.03 0 1.03 431 0.31 0.31 0.62 874 0.12 0.49 0.61 Source: Data from Ref. [1] The cost of electricity is considered as US$0.061/kWh for this comparison. As seen in above Fig. 3 and Table 2, there is about US$0.40 (40%) cost reduction compared to mechanical compression when high pressure PEM electrolyzer is utilized. A differential pressure PEM electrolysis system consists of a number of bipolar cells stacked in electrical series, with each cell containing a membrane-electrode assembly (MEA) formed by bonding anode and cathode electrodes to opposing sides of the membrane. The MEA is in contact with electrically conductive anode and cathode support structures located in the oxygen and hydrogen chambers, respectively. An electrically conductive cell separator is located between the anode and cathode chambers of adjacent cells. In the process, high-purity water is pumped to the anode, where it is electrochemically decomposed to oxygen gas, hydrogen ions and electrons. The hydrogen ions move through the PEM and the electrons move through the external circuit to the cathode, where they recombine to form hydrogen. An excess of water is supplied to 1.03 0.31 0.12 1.03 0.62 0.61 0 0.2 0.4 0.6 0.8 1 1.2 21 bar 431 bar 874 bar Hydrogen compression cost ($/kg) PRESSURE Compression Cost ($/kg) Total Cost ($/kg)
  • 8. 7    the oxygen side of the cell and is recirculated to remove waste heat from the MEA. A portion of the excess water is electro-osmotically transported across the PEM with the hydrogen ions. The electrochemically-transported water is separated from the product hydrogen and returned to the water stream. PEM cells operate efficiently at current densities of 2000 to 3000 mA/cm2 , compared to alkaline electrolyzers that typically operate at less than 300 mA/cm2 . At this current density, the alkaline cell voltage is typically 1.9 V or higher. The operating cell voltage of the currently analyzed 15-kW PEM electrolyzer is lower, 1.85 V, at a current density nearly an order of magnitude higher, 2000 mA/cm2 at 300 psig (2170 kPa) H2. In the study, the electrolyzer demonstrated a PEM electrolysis cell based on an advanced membrane that operates at 1.7 V at 2000 mA/cm2 . Since the cost of electricity is the major contributor to the cost of hydrogen produced by electrolysis, efficient operation is a key to low-cost hydrogen production for large applications. Although the capital cost of PEM electrolyzer stacks is higher than that of alkaline stacks on an area basis, the much higher current density of PEM cells allows the stacks to be smaller by a factor of 5 to 10, while achieving high efficiency. Thus, in large-scale production, and with development of lower-cost materials and manufacturing methods for key components, the capital cost of a PEM stack is expected to be competitive with alkaline stacks, while the electricity consumption of the PEM stack will be significantly lower than that of the alkaline stack. Another key advantage of the PEM technology is the ability to operate the stack at a high differential pressure, allowing hydrogen to be produced at high pressure, while oxygen is produced, and the reactant water is supplied, at near atmospheric pressure. Production of hydrogen in the electrolyzer at elevated pressure provides some system advantages, decreasing the number of stages of mechanical compression required to store the product hydrogen at greater than 5000 psig (34.6 MPa) [2]. The price for electrolyzer with electrochemical and mechanical compression seems to be similar at large scale production [3]. Price advantage for electrochemical compression may be obtained at decentralized energy supply for < 1 MW [3]. High pressure hydrogen electrolysis at present time may be efficient or reasonable from economic point of view up to operating pressure 200-300 bar [3]. Electrochemical compression of hydrogen creates problems with gas purity, current efficiency, platinum metals loading and life-time mainly at often turn off - turn on cycles [3]. The change in current efficiency with varying pressure values in PEM electrolyzer are given in Fig. 4. If the pressure increases, current efficiency tends to decrease. The conditions in the Fig. 4 were: current density is 1000 mA/cm2 , operating voltage is 1.70-1.73 V and operating temperature is 80 °C with a modified membrane of 250 micrometers. Fig. 4. Pressure vs current efficiency in PEM electrolyzer under given conditions (data from Ref. [3]) 99 96 93 90 84 86 88 90 92 94 96 98 100 1 30 130 300 Current efficiency (%) Pressure (bar)
  • 9. 8    High pressure hydrogen could be generated by using compressor which will deliver hydrogen from 1 atm to higher pressure, or using pump to supply pressurized water. Using pump instead of compressor requires less power than compressor [4]. Therefore, the current industry trend is to greatly pressurized electrolyzers to abolish classical mechanical compressors for efficiency enhancement. When the efficiency of the compressor and the pump are assumed to be 50%, it is realized that hydrogen produced by using pressurized water require less power than using hydrogen compressor. The required power difference is about 15% which is a significant amount. The advantage of using pressurized water via pump instead of power consuming compressor was demonstrated as seen in Figs. 5 and 6. Fig. 5. Comparison of high pressure electrolysis and atmospheric electrolysis required work inputs (data from Ref. [5]) Fig. 6. Energy use of a solid polymer electrolyzer at different temperature and pressure values (data from Ref. [5]) 260 262 264 265 266 267 267.5 284 297 307 314 321 326 331 100 200 300 400 500 600 700 Required work rate (kW) Pressure (bar) Electrolyzer and Pump Work (kW) Electrolyzer and Compressor Work (kW) Linear (Electrolyzer and Pump Work (kW)) Linear (Electrolyzer and Compressor Work (kW)) 0 5 10 15 20 25 30 35 40 45 50 1 50 100 500 700 Energy use (kWh/kg H2) Pressure (bar) 320 K 373 K 523 K Linear (320 K)
  • 10. 9    Fig. 6 represents the increase in power consumption of a PEM electrolyzer when the pressure increases. However, rising temperature has positive effect on efficiency yielding lower power consumption. The electrolyzer consumes about 46 kWh/kg H2 energy at 100 bar and 320 K while the energy consumption goes down to about 38 kWh/kg H2 at same temperature and 523 K. Therefore, rising the temperature positively affect the electrolysis efficiency where high temperature and high pressure electrolysis can be combined. The following assumption are made for the cost calculations of electrolysis, transportation, storage and production systems in the next section as given in Ref. [6, 7]:  The H2A Distributed Production Model 3.0 used alkaline electrolysis parameters to generate the values.  The H2A Distributed Production Model 3.0 was used with the standard economic assumptions: all values are in 2007 dollars, 1.9% inflation rate, 10% after tax real internal rate of return, 100% equity financing, 20-year analysis period, 38.9% overall tax rate, and 1% working capital. The plant design capacity is 1,500 kg/day of hydrogen. It is assumed that Design for Manufacture and Assembly (DFMA) would be employed and that production would have realized economies of scale.  The plant production equipment availability is 98% including both planned and unplanned outages; four unplanned outages of 14h duration per year; 1 planned outage of 5 days duration per year. The plant usage factor is defined as the actual yearly production/equipment design production capacity and is 90% based on over sizing of the production equipment to accommodate a summer surge in demand of 10% above the yearly average demand.  The levelized cost is equivalent to the minimum required selling price to achieve a 10% annual rate of return over the life of the plant.  Electrolyzer cells capital replacement is 25% of total purchased capital every 7 years  The 2015 status of transmission pressure is based on the maximum operating pressure of hydrogen pipelines as of March 2015. The 2020 target is set to lower compression requirements at the forecourt.  Hydrogen leakage is hydrogen that permeates or leaks from fittings, etc., as a percent of the amount of hydrogen carried by the pipeline. The 2015 status and future targets are based on industry consultation, along with the assumption that leak rates from hydrogen pipelines will be no higher than those from current natural gas pipeline infrastructure.  Pipeline lifetime refers to the minimum time period that the pipeline must remain in service to justify the capital cost of its installation. The 2020 and ultimate targets are intended to be at least equivalent to that of natural gas pipeline infrastructure. The actual life of a pipeline can exceed its design life.  The leak rate refers to hydrogen losses through the pipeline material and/or fittings. The current status and future targets are based on the use of fiber-reinforced composite piping (FRP).  Tube trailer terminals large enough to serve a mature market (~ 70,000 kg/day) do not presently exist. Such terminals would likely be located near production plants and require storage capacity (at about 100 bar) to buffer differences between production rates and rates of trailer filling. The compressors in 2015 do not seem to have sufficient capacity to meet the needs of a terminal in a mature market. The 2020 target is based on the capacity that would be necessary to satisfy the truck refueling needs of a terminal in a mature market with about 20 compressors in parallel and 5 redundant compressors.
  • 11. 10    Fig. 7. Pipeline, terminal and geologic compressors based hydrogen transportation (adapted from Ref. [6]) In general, geological storage is typically employed to store a large amount of gas in the field of infrastructure for supplying natural gas 150-200 bar pressure medium. In order to reduce the gas loss, usually salt domes are used forming a cavity. One has been operating for several years, two more are recently built in Texas, the United States of America, Lake Jackson, Texas, as a salt cave site hydrogen storage. Demand for road transport fuel will be significantly higher in summer than in winter. In the summer the cost of the ban, there is the potential to meet this growing demand, by hydrogen storage capacity of hydrogen in the fuel system. Geological type storage is very cost-effective way, and the effective use of natural gas is also possible [6]. Note that the compression process may vary according to the capacity and use of pressurization. Transport pipelines, high flow rate of at least 10 MPa, at a relatively low pressure and compression ratio (10: 1) are required. On the other hand, at fueling stations, flow compressors 5-100 kg/h and the pressure can be as high as 100 MPa. Installation of terminals tend to have temporary needs. High flow rate of reciprocating compressors are often used to transport pipelines and terminals used for excitation of the hydrogen cell pressure vessel installation and high-pressure diaphragm compressors. The pipeline, terminal and geologic compressors based hydrogen transportation and the related cost analysis are given in Fig. 7 and Table 3. Table 3. Hydrogen delivery components cost analysis for pipeline, terminal and geologic compressors for 200,000 kg/day hydrogen capacity and 20 bar inlet pressure (estimated) Category 2015 2020 Compressor specific energy (kWh/kg) 0.82 0.82 Discharge pressure (bar) 100 100 Uninstalled capital cost (million $) 5.5 3.6 Availability 85% 90% Annual maintenance cost (% of installed capital cost) 6% 4% Source: Data from Ref. [6] The pipeline capital costs are from HDSAM (Hydrogen delivery scenario analysis model) V2.3 prepared by US DOE. The model assumes that a hydrogen pipeline costs 10% more to construct than a natural gas pipeline of the same diameter and length. The assumption of a 10% premium for hydrogen lines was based on discussions with industrial gas companies that build and operate the current system of hydrogen pipelines in the U.S [6, 7]. The 2015 status and future targets are based on distribution pipelines being built out of fiber-reinforced composite material. The 2015 distribution pressure is based on the current rating of fiber-reinforced composite pipe.
  • 12. 11    The ultimate target has been set to enable the pipeline delivery pathway to meet its ultimate cost target. Fig. 8. Tube trailer based hydrogen transportation system (adapted from Ref. [6]) Pipelines carrying large volumes for hydrogen perceived cost-effective way. Because of the high capital investment for pipelines, however, there must be a steady, high-volume gas demand to justify the investment cost. Distribution line pressure of 1-5 MPa (10-50 bar), while the transmission line pressures are generally in the range of 3-15 MPa (30-150 bar) are available. Materials are soft and low carbon steels. Embrittlement concerns for these materials are far less than for higher strength steels and are further mitigated by proper pipeline design. Long pipelines for liquid hydrogen are currently cost prohibitive. The compressor specific energy is calculated by energy consumption for every unit of hydrogen compressed (kWh/kg) at the specified inlet pressures, discharge pressures, and capacities. The current metric characterizes the isentropic efficiency, losses, motor efficiency, and motor size of a large compressor. Large compressor capital costs were derived from cost data supplied by various vendors for two- and three-stage reciprocating compressors. HDSAM V2.3 had been used to estimate the motor power that a reciprocating compressor of the specified size (200,000 kg/day from 20 bar to 100 bar) would require, and to then estimate the compressor cost corresponding to that power. The 2015 status is instead based on cost projections for an existing centrifugal design, which is likely to be preferable to reciprocating compression because of better reliability. The 2020 and ultimate targets are based on cost reductions. Hydrogen can leak through compressor seals. The 2015 status of leak rate was based on typical ratings of hydrogen compressor seals. Future targets are set to ensure leak rates do not exceed the current status. Annual maintenance cost status was derived from a reliability analysis completed by Concepts NREC for the 240,000 kg/day centrifugal compressor which is about $0.005/kWh. HDSAM V2.3 was used to determine the kWh the compressor would consume in a year [6, 7]. Table 4. Tube trailer terminal truck refueling compressors cost analysis for 300 kg/h hydrogen capacity and 100 bar inlet pressure (estimated) Category 2015 2020 Compressor specific energy (kWh/kg) 1.1 1.1 Capacity (kg/h) 40 300 Discharge pressure (bar) 550 550 Uninstalled capital cost ($) 250,000 450,000 Availability 90% 90% Annual maintenance cost (% of installed capital cost) 10% 2% Source: Data from Ref. [6]
  • 13. 12    The tube trailer based hydrogen transportation system and their cost analysis are given in Table 4 and Fig.8. The individual component targets for 2020 have been set such that the tube trailer delivery pathway meets the cost target of $2.00/gge of hydrogen. The ultimate targets have been set such that the pipeline delivery and liquid hydrogen delivery pathways both achieve a cost of <$2.00/gge. Ultimate targets were not set for the tube trailer pathway because it is expected that gaseous hydrogen will be delivered primarily by pipelines in a mature, high-volume market. The most common pressure vessel construction is the Type 1 steel tube. These are capable with a storage capacity of gaseous hydrogen under a pressure of 13.5 41 MPa (135-410 bar) and bonded together to increase the overall storage capacity. Storage pressure vessels, ships carrying container depends on the size and construction design is based on the regulations. Current carrying capacity of steel pipe trailer (~ 18 MPa or 180 bar) hydrogen is limited. Because of the limited amount of hydrogen that can be transported by steel tube trailer, this transport approach is economically constrained to a radius of ~300 km from the point of production. Hydrogen gas delivery can be with the railway or may be provided with vessels and barges. Composite pressure vessels are also available. Typically these cost more than steel vessels of equivalent size, but generally will store hydrogen at higher pressures and capacity, and storage costs on per kg of hydrogen stored basis are often lower [6, 7]. Table 5. Costs of stationary hydrogen gas storage tanks (estimated) Stationary hydrogen gas storage tanks 2015 ($/kg hydrogen stored) 2020 ($/kg hydrogen stored) Purchased capital cost for low pressure 160 bar 850 500 Purchased capital cost for moderate pressure 430 bar 1,100 600 Purchased capital cost for high pressure 925 bar 2,000 600 Source: Data from Ref. [6] If the hydrogen is produced at the required purity specifications, then design of the delivery infrastructure must either guard against contamination or provide for a final purification step just prior to dispensing. Alternatively, hydrogen could be produced at lower purity levels and purified to specification further downstream along the delivery pathway prior to dispensing. Purchased capital costs of stationary hydrogen gas storage tanks are given in Table 5. Table 6. Distributed forecourt water electrolysis hydrogen production (estimated) Characteristics 2015 2020 Hydrogen Levelized Cost (Production Only) ($/kg) 3.9 2.3 Electrolyzer System Capital Cost ($/kg) 0.5 0.5 System Energy Efficiency (%) 72 75 System Energy Consumption (kWh/kg) 46 44 Stack Energy Efficiency (%) 76 77 Stack Energy Consumption (kWh/kg) 44 43 Source: Data from Ref. [6]
  • 14. 13    These individual targets were based on the current status of the technology and the potential for technological advancements in the future. The status of these technologies was determined through consultations with stakeholders and industry [6, 7]. The cost contributions of various processes in distributed water electrolysis based hydrogen production system are given in Tables 6 and 7. Costs for the forecourt station compression and storage are consistent. Storage capacity for 1579 kg of hydrogen at the forecourt is included. It is assumed that the hydrogen refueling fill pressure is 10,000 psi in 2015 and 2020. The comparison of stationary hydrogen tanks under various pressures is given in Fig. 9 based on $/kg price. Fig. 9. Comparison of costs for stationary hydrogen gas storage tanks (data from Ref. [6]) As indicated in Fig. 9, various effective pressures are likely for stationary storage purposes in a hydrogen delivery infrastructure. Low pressure storage will be necessary at terminals and fueling stations supplied by pipelines. Moderate pressure storage will be necessary at 350 bar refueling stations, and high-pressure storage will be necessary at 700 bar refueling stations. The 2015 values represent the packaged cost of standard steel and composite tanks, including the costs of paint, cleaning, and mounting necessary to transport the tanks; this cost does not, however, include installation at the final destination. Because the cost of storage is highly dependent on the tank size. The ultimate target for tank size is smaller in order to create a more aggressive target on a $/kg stored basis [6, 7]. Table 7. Distributed electrolysis cost contributions (estimated) Characteristics 2015 2020 Electrolysis System ($/kg hydrogen) 0.5 0.5 Electricity ($/kg hydrogen) 3.1 1.6 Production Fixed O&M ($/kg hydrogen) 0.2 0.2 Production Other Variable Costs ($/kg hydrogen) 0.1 <0.10 Hydrogen Production ($/kg hydrogen) 3.9 2.3 Compression, Storage, and Dispensing ($/kg hydrogen) 1.7 1.7 Total Hydrogen Levelized Cost (Dispensed) ($/kg hydrogen) 5.6 4 Source: Data from Ref. [7] 850 1,100 2,000 500 600 600 0 500 1000 1500 2000 Low pressure 160 bar Moderate pressure 430 bar High pressure 925 bar Purchased Capital Cost of Hydrogen Storage Tanks ($/kg hydrogen stored) 2020 2015
  • 15. 14    The electricity cost is assumed to be 3.7¢/kWh for the year 2020 only. Distributed electrolysis based hydrogen production cost contributions are given in Fig. 10. Furthermore, the central water electrolysis in high amounts yield lower costs as seen in Table 8 and Table 9. The cost of central electrolysis based hydrogen can decrease down to 3.2 $/kg as illustrated in Fig. 11. Fig. 10. Distributed electrolysis cost contributions (estimated) (data from Ref. [7]) Note that system energy efficiency is defined as the energy in the hydrogen produced by the system on a LHV basis divided by the sum of the feedstock energy as LHV plus all other energy used in the process. Stack energy efficiency is defined as the energy in the hydrogen produced by the stack on a LHV basis divided by the electricity entering the stack. Additional electricity use for the balance of plant is not included in this calculation. Hydrogen cost is calculated assuming purchase of industrial grid electricity. The average electricity price is taken to be $0.070/kWh ($0.069/kWh effective). Table 8. Central water electrolysis hydrogen production (estimated) Characteristics 2015 2020 Hydrogen Levelized Cost (Plant Gate) ($/kg) 3.2 2 Total Capital Investment ($M) 51 40 System Energy Efficiency (%) 73 75 System Energy Consumption (kWh/kg) 46 44.7 Stack Energy Efficiency (%) 76 78 Stack Energy Consumption (kWh/kg) 45 44 Electricity Price 0.05 0.03 Source: Data from Ref. [7] 0.5 1.6 0.2 0.1 2.3 1.7 4 0.5 3.1 0.2 0.1 3.9 1.7 5.6 0 1 2 3 4 5 6 Electrolysis System Electricity Production Fixed O&M Production Other Variable Costs Hydrogen Production Compression, Storage, and Dispensing Total Hydrogen Levelized Cost (Dispensed) Cost ($/kg) 2015 2020
  • 16. 15    The H2A Distributed Production Model 3.0 was used with the standard economic assumptions: all values are in 2007 US dollars, 1.9% inflation rate, 10% after tax real internal rate of return, 100% equity financing, 20-year analysis period, 38.9% overall tax rate, and 1% working capital. The plant design capacity is 1,500 kg/day of hydrogen. It is assumed that Design for Manufacture and Assembly (DFMA) would be employed and that production would have realized economies of scale. Table 9. Central water electrolysis cost contributions (estimated) Characteristics 2015 2020 Capital cost ($/kg) 0.5 0.4 Feedstock cost ($/kg) 2.3 1.4 Fixed O&M cost ($/kg) 0.1 0.1 Other variable costs ($/kg) 0.1 0.1 Total Hydrogen Levelized Cost (Plant Gate) ($/kg) 3.2 2 Source: Data from Ref. [7] The plant production equipment availability is 98% including both planned and unplanned outages; four unplanned outages of 14h duration per year; 1 planned outage of 5 days duration per year. The plant usage factor is defined as the actual yearly production/equipment design production capacity and is 90% based on over sizing of the production equipment to accommodate a summer surge in demand of 10% above the yearly average demand. The levelized cost is equivalent to the minimum required selling price to achieve a 10% annual rate of return over the life of the plant. The electrolyzer cells capital replacement is 25% of total purchased capital every 7 years [7]. Fig. 11. Central water electrolysis cost contributions (estimated) (data from Ref. [7]) 0.4 1.4 0.1 0.1 2 0.5 2.3 0.1 0.1 3.2 0 0.5 1 1.5 2 2.5 3 3.5 Capital cost Feedstock cost Fixed O&M cost Other variable costs Total Hydrogen Levelized Cost (Plant Gate) Cost ($/kg) 2015 2020
  • 17. 16    Fig. 12. Average electricity prices for large power consumers higher than 5 MW in North America in Canadian cent/kWh (adapted from Ref. [8]) The electricity rates effective April 1, 2015 sets out Hydro-Québec’s rates, as approved by the Québec energy board in accordance with Decision D-2015-033. Taxes are not included in the calculations. These bills have been estimated by Hydro-Québec and may differ from actual bills. The electricity prices in the tables and figures are based on Canadian dollars [7]. Fig. 13. Comparative index of electricity prices for large-power customers with a monthly consumption of 3,060,000 kWh and a power demand of 5,000 kW (data from Ref. [8]) 4.02 4.22 4.74 4.77 4.9 5.55 5.84 6.13 6.55 7.14 8.9 10.02 0 2 4 6 8 10 Average electricity price (CAD cent/kWh) Halifax, NS Charlottetown, PE Moncton, NB Regina, SK Ottowa, ON Vancouver, BC Toronto, ON Montreal, QC St.John's, NL Calgary, AB Edmonton, AB Winnipeg, MB
  • 18. 17    The results presented in Fig. 13 and Table 10 show the total bill for various consumption levels. If the bill is calculated according to an unbundled rate, it includes all components, including supply, transmission and distribution. The electricity prices in Canada are given in Fig. 13 and Table 10 in Canadian dollar. The lowest electricity cost is calculated for Winnipeg. Table 10. Large power average electricity prices effective on April 1, 2015 in CAD cent/kWh Power demand 5 MW 5 MW 10 MW 30 MW 50 MW 50 MW Load factor 0.65 0.85 0.80 0.81 0.65 0.85 Price (CAD cent/kWh) Montreal, QC 5.76 5.17 5 4.97 5.4 4.9 Calgary, AB 5.04 4.76 4.8 4.78 5.01 4.74 Charlottetown, PE 9.63 8.9 9.05 9.01 9.63 8.9 Edmonton, AB 7.61 6.97 4.47 4.32 4.57 4.22 Halifax, NS 10.66 10.02 10.15 10.12 10.66 10.02 Moncton, NB 8.24 7.48 7.27 7.24 7.81 7.14 Ottawa, ON 9.87 9.3 10.31 6.9 6.83 6.13 Regina, SK 8.36 7.81 6.72 6.63 6.94 6.55 St. John’s, NL 8.93 8.65 8.61 4.82 5.1 4.77 Toronto, ON 9.28 9.22 5.7 5.64 6.05 5.55 Vancouver, BC 7.58 7.04 5.93 5.91 6.25 5.84 Winnipeg, MB 5.08 4.67 4.08 4.07 4.33 4.02 Source: Data from Ref. [8] 1.1 Economic analysis of high pressure PEM electrolyzer based hydrogen and ammonia production The DOE H2A model was used to project the cost of hydrogen production with the high pressure electrolysis technology and to determine the lowest cost system design. The costs are given in US dollars in this section. The H2A model was run for production of 1500 kg H2/day at a forecourt filling station. The capital and operating costs include a compressor for increasing the hydrogen pressure from the stack operating pressure to the DOE target storage pressure of 6250 psig (43.2 MPa). The cost of hydrogen produced using the high pressure PEM electrolysis technology was analyzed as a function of four operating pressures, ranging from 100 psig (0.79 MPa) to 5000 psig (34.6 MPa), and three current densities: 1000, 2000 and 3000 A/ft2 (929, 1858 and 2787 mA/cm2 , respectively). Analysis was conducted for two electricity rates: (i) $0.05/kWh for industrial electricity where the results are shown in Table 11; and (ii) a lower cost of $0.035/kWh. Where the results are shown in Table 12. At the higher electricity cost ($0.05/kWh), the lowest projected cost for hydrogen production is $3.77/kg, for an electrolyzer designed to operate at 100 psig (0.79 MPa) and a moderate current density of 1858 mA/cm2 [2].
  • 19. 18    Table 11. Cost of hydrogen for high pressure electrolysis based on electricity price of 5 cents/kWhPressure(bar) Currentdensity (mA/cm2 ) Cellvoltage(V) Cellpower consumption (kWh/kgH2) StackProjected Capital Costs($K) Compressor Capital Costs($K) TotalProjected Capital Costs($K) H2cost($/kg) Capital H2cost($/kg) Electricity H2cost($/kg) O&M H2cost($/kg) Total 345 929 1.807 52.9 2204 0 5050 2.23 3.02 0.86 5.95 345 1858 2.016 52.9 1054 0 3085 1.37 3.26 0.59 5.06 345 2787 2.218 61.2 691 0 2474 1.1 3.56 0.51 5.01 Source: Data from Ref. [2] Table 12. Cost of hydrogen for high pressure electrolysis based on electricity price of 3.5 cents/kWh Pressure(bar) Current density (mA/cm2 ) Cellvoltage(V) Cellpower consumption (kWh/kgH2) StackProjected Capital Costs($K) Compressor Capital Costs($K) TotalProjected Capital Costs($K) H2cost($/kg) Capital H2cost($/kg) Electricity H2cost($/kg) O&M H2cost($/kg) Total 345 929 1.80 52.9 2204 0 5050 2.2 2.01 0.86 4.92 345 1858 2.01 52.9 1054 0 3085 1.3 2.17 0.59 3.95 345 2787 2.28 61.2 691 0 2474 1.0 2.37 0.51 3.8 Source: Data from Ref. [2] Fig. 14. Cost comparison of hydrogen production from high pressure PEM electrolysis based on various electricity price and current densities at 345 bar (data from Ref. [2]) 4.92 3.95 3.8 5.95 5.06 5.01 0 1 2 3 4 5 6 929 mA/cm2 1858 mA/cm2 2787 mA/cm2 Cost of high pressure electrolysis  based hydrogen production ($/kg) Current density Electricity (US 3.5 cent/kWh) Electricity (US 5 cent/kWh)
  • 20. 19    The projected cost of hydrogen increases with increasing stack and system operating pressure. For an electrolyzer stack producing hydrogen at 5000 psig (34.6 MPa), the lowest projected hydrogen cost is approximately $5.00/kg, a 25% increase over the 333-psig (2.4 MPa) case. Higher pressure operation reduces the compressor costs, but significantly increases the capital cost of the electrolyzer stack and system. This is particularly true for operation at 5000 psig (34.6 MPa), where the high pressure limits the practical size (active area) of the individual cells and reinforced sealing is required for each cell. As the results shown in Fig. 14, the larger number of cells and the higher cost per cell, as well as a higher cost for the balance-of-plant components rated for 5000-psig (34.6 MPa) operation, result in a significantly higher capital cost for the 5000-psig (34.6 MPa) electrolyzer compared to lower pressure designs. The estimated cost of the present stack design in large-scale production is less than $1000/kW. A future development path has been identified that would decrease the capital cost to less than $550/kW. Economic analysis indicates that hydrogen could be produced for $3.79 per gge at an electricity cost of $0.05/kWh by the lower-cost PEM electrolyzer assuming high-volume production of large-scale electrolyzer systems [2]. 2. Feasibility analysis of cryogenic air separation for nitrogen production in ammonia synthesis Cryogenic air separation methods are regularly used in medium to large scale facilities to yield nitrogen, oxygen, and argon as gases or liquid products. Cryogenic air separation is generally favored technology for generating very high purity oxygen and nitrogen. Currently, it yields the most cost effective technology for high amounts. There are numerous plants producing liquefied industrial gas products using cryogenic technology. The plants which produce nitrogen only are less complicated and need less power to operate than an oxygen-only plant making the same amount of product. Producing these products in liquid form requires extra apparatus and more than doubles the amount of power required per unit of delivered product [9]. If a high percentage of facility produces liquid products, an additional refrigeration element must be added to a standard air separation plant (ASU). These units are called liquefiers and they use nitrogen as the primary working fluid. The needed liquefier volume is decided by considering the estimated average daily demand for bulk liquid products and the need to produce some additional liquid to back up on-site gas customers served out of the same air separation plant [9]. If the liquefier is being added to an existing ASU, the ASU may not have been designed to allow high rates of liquid oxygen withdrawal. In this case, one solution is to add extra heat exchanger circuit to liquefy gaseous oxygen while vaporizing liquid nitrogen. Refrigeration is transmitted to the air separation section of the plant via heat exchangers and injection of liquid nitrogen as distillation column reflux [9]. The general process design of a cryogenic air separation plant involves the following steps:  Air is compressed and cooled with intercoolers to remove any water vapor  The dry air stream is purified to remove contaminants such as carbon dioxide and residual water vapor  The air is cooled using the waste product oxygen and purified nitrogen from the distillation column, further deducing contaminants  The air is further cooled down to about 97 K (the dew point of air)  The air is distilled into its components using a single distillation column
  • 21. 20    The cost of reciprocating compressors is proportional to plant capacity while the cost of centrifugal compressors varies very little over a wide range of large plant sizes [10]. Therefore, when centrifugal compressors were first introduced, the threshold for switching from reciprocating compressors to centrifugal compressors was estimated to be between 550 and 600 ton/day [10]. Today with improved manufacturing techniques, improved catalysts and lower synthesis pressures in some plants, centrifugal compressors are economical down to 220 ton/day [11]. Nearly all contemporary ammonia plants use centrifugal compressors for syngas compression, though reciprocating compressors were used until the mid-1960s. The compressors utilize intercoolers to minimize the compression work and operate at constant throughput, delivering the syngas at constant pressure and temperature to the synthesis reactor. The synthesis loop operates adiabatically at constant pressure with a slight pressure drop across the reactor beds [12]. 2.1 Air separation unit cost analysis Air separation units are rated in terms of normal cubic meters per hour which is the volume of the gas at standard temperature and pressure. An ammonia production facility with a capacity of 300 ton/day is considered in the analysis. Using the ideal gas law at STP to convert a mass of 246.7 tons of nitrogen to units of meters cubed gives a volume of 214,500 m3 /day or about 8,940 m3 /h. The molecular mass of water is approximately 16 g/mol and 1 g of water equals one mL so the total volume of water required can be calculated. A 300 ton per day ammonia plant will require about 476 tons of distilled water/day. The flow rates of nitrogen, ammonia, hydrogen and water are summarized in Table 13, respectively. Table 13. The mass flow rates of feed gases, water and ammonia product in a 300 ton/day ammonia production facility Product Daily Amount (ton/day) Flow Rate (kg/h) Nitrogen 246.7 10,280 Hydrogen 53.3 2,220 Water 476 19,830 Ammonia 300 12,500 Note that the power required for air separation is almost solely from the compression train used at the inlet and depends on the design of the plant. The assumptions for the air separation plant are: the intake temperature is 298 K, there are 3 stages of compression to raise the pressure to 8 bar and the recovery ratio of the air separation plant is 70% by volume. The total volumetric flow rate of air into the compression train is the total nitrogen production capacity divided by the recovery ratio: A 300 ton/day ammonia plant will require 247 ton/day or 8940 Nm3 /h of nitrogen. Thus, the air intake into the first compressor of the ASU will be 352.8 ton/day which corresponds to 4.08
  • 22. 21    kg/s. The fluid power required is 792 kW. If an adiabatic compressor efficiency of 75% is assumed together with a driver efficiency of 95%, the total power required will be 1.112 MW. Specifications and costs of heat exchangers used in ASU plant are shown in Table 14 with 2010 US $ prices. Table 14. Specifications and cost of heat exchangers used in ASU plant based on 2010 US$ Type Area (m2 ) Pressure (bar) Uninstalled Cost ($) Installed Cost ($) Floating head 121.32 2 38,340 83,200 Floating head 127.56 4 39,280 85,240 Floating head 188.19 8 48,550 105,350 Plate fin 2855.69 8 514,910 1,428,880 Total 3292.76 641,080 1,702,670 Source: Data from Ref. [13] The main heat exchanger in a cryogenic air separation facility is the cold box which is a large multi stream brazed aluminum heat exchanger that cools incoming warm air against the cooler waste and product streams. The intercoolers are standard, water cooled, liquid-gas heat exchangers. The process air stream is assumed to be cooled to the inlet temperature at each step, which is a function of the pressure increase across the compressor. Table 15. Specifications and cost of compressors and drivers used in ASU plant based on 2010 US$ Type Number Compressor power (MW) Driver Power (MW) Uninstalled Cost ($) Installed Cost ($) Centrifugal & Driver 1 379 505.3 285,770 654,560 Centrifugal & Driver 1 362.3 483.1 277,430 633,730 Centrifugal & Driver 1 413.5 551.3 302,540 696,580 Total 3 1,984,870 Source: Data from Ref. [13]
  • 23. 22    Table 16. Specifications and cost of towers used in 250 ton N2/day ASU plant based on 2010 US$ Type Volume (m3 ) Pressure (bar) Installed Cost ($) Installed Cost ($) High pressure distillation column 134.9 6 120,800 1,658,670 High pressure distillation column 175.3 1.8 153,700 1,260,050 Argon distillation column 22.5 1.3 27,710 227,170 Total 302,210 3,145,890 Source: Data from Ref. [13] It is assumed that standard carbon steel, centrifugal compressors are used since air is relatively inert and non-corrosive. The cost of these machines is related to the fluid power required in the application. The cost of compressors, towers and turbines used in ASU plant are given in Tables 15, 16 and 17, respectively. The drivers are assumed to be totally enclosed all electric motors made of carbon steel. They are subjected only to ambient pressures and temperatures, and do not come into contact with any corrosive substances. Table 17. Specifications and cost of turbine used in 250 ton N2/day ASU plant based on 2010 US$ Type Material Power (kW) Uninstalled Cost ($) Installed Cost ($) Radial gas Carbon steel 25 14,590 89,000 Source: Data from Ref. [13] In total, the capital cost of 250 ton N2/day ASU plant corresponds to 6,922,430 $. 3. Feasibility analysis of Haber-Bosch ammonia synthesis loop The major process equipment in an ammonia synloop consist of compressors, heat exchangers, pumps and the reactor. The compressor sizing is straightforward and is primarily driven by the flow rates and pressure ratios. The cost of the process equipment depends on three major factors: the size, the material of construction and the operating pressure. Also, pressure affects the cost of process equipment because higher pressures often require more material and heavier frames. While there are a many of ammonia synthesis loop configurations some basic assumptions enable an economic analysis which is valid for any synthesis loop. The assumptions are as follows: A centrifugal compressor train takes the feed gas from 1 bar to operating pressure. A recycle compressor is used to compensate for the pressure drops in the loop. The operating pressures and temperatures are valid for any size ammonia plant. The calculations for a 300 ton/day ammonia production facility are based on Ref. [13]. Compression work for hydrogen can be done within the electrolyzer instead of by compressors. This approach simplifies the overall process and saves capital cost expenses for the compression machinery including drivers and compressors. The
  • 24. 23    compression work must be the same for both processes, and the derivation that appeared in Larminie and Dicks [14] is given below: Δ ln Δ Δ Δ ∙ Δ Δ ∙ ∙ Δ ∙ ∙ ln Here, for the feed stream, it is assumed that the hydrogen is available at STP from the electrolyzer bank, nitrogen is at standard temperature and 8 bar from the ASU. The fluid compression power required is given by following equation: 1 1 where is the temperature of the feed gases incoming the compressor in Kelvin; N is the number of stages in the compression train; n is the polytrophic exponent; R is the specific gas constant in kJ/kgK; is the mass flow rate in kg/s; is the final pressure in bar; is the initial pressure in bar. The term gives the compression ratio across each compressor. If isentropic compression is assumed, the temperature is raised across each compressor. Intercooling is utilized between the stages to minimize the compressor work. Thus, each intercooler must remove the heat imparted on the feed gas by the compressors. It is assumed that the intercoolers cool the gas down to the inlet temperature of the compressor. In this case, each compressor has the same conditions and uses the same amount of power. The hydrogen and nitrogen are available at the compressor inlet at two different pressures. The total compression power is the sum of the compression for each component. The conditions for each component of the feed are given in Table 18. Table 18. Assumptions of operating conditions for the capital cost analysis in the ammonia synthesis loop Parameter Value Tin (°C) 25 Pout (bar) 150 Pin Nitrogen (bar) 8 Pin Hydrogen (bar) 1 RH2 (kJ/kgK) 4.124 RN2 (kJ/kgK) 0.2968
  • 25. 24    The compression power required is linear with the flow rate of feed gas, given any synloop operating pressure. This further implies that the size of the compressors and the drivers for the compressors is also linear with flow rate. Following figure shows the fluid compression power required for various ammonia plant capacities. The power required to drive the compressor is the fluid power divided by the isentropic efficiency of the compressor, as shown in the following equation: The isentropic efficiency is taken to be 75%. Thus, the actual power needed at the shaft is about 25% higher than required by the fluid. The recycle compressor is tasked with compressing more mass than the feed stream but with a smaller pressure ratio. The conversion efficiency refers to the conversion rate of ammonia in the synthesis reactor and is generally about 15%. Therefore, the synloop has roughly 6 times the flow rate of the feed gas and contains ammonia as well as the hydrogen and nitrogen from the feed. The pressure drop around the synthesis loop varies with the configuration, and operating parameters of the entire plant. However, a total pressure drop of about 6% can be assumed as a baseline to determine the total compression power of the recycle compressor [15]. Fig. 15. The required compression power for hydrogen and nitrogen gases in the ammonia synthesis loop (adapted from Ref. [13]) Each compressor is driven by its own drivers. The power requirements for the compression are determined by dividing the shaft power of the compressor by the efficiency of the electric motor. The electric motor efficiency is generally more than 90% and rises with the rated operating power and the turndown ratio. Because the ammonia synthesis occurs at steady state and the compression power required for small plants is in the MW range, an efficiency of 95% is assumed for this analysis. The isentropic efficiency is taken to be 75%, and the efficiency of the driver is
  • 26. 25    taken to be 95%. The power requirements of the compressors in synloop are given in Table 19. The driver power can be written as follows: ∙ Table 19. The power requirements for the compressors in the synloop based on various ammonia production capacities Ammonia plant capacity (ton/day) Total fluid power (MW) Shaft power (MW) Driver power (MW) 100 1.88 2.50 2.64 200 3.76 5.01 5.27 300 5.62 7.51 7.91 400 7.51 10.02 10.54 500 9.39 12.52 13.18 Source: Data from Ref. [13] For any ammonia plant size, the flows of reactants and products throughout the plant can be calculated. The flow rates through the system are determined from the stoichiometry of ammonia. The chemical formula for ammonia is NH3, its molecular mass is 17.03 g/mol of which nitrogen is approximately 14 g/mol. NH3 consists of 82.4% nitrogen and 17.6% hydrogen by weight. Thus, nitrogen and hydrogen must be mixed in the proper proportions and reacted together to form ammonia. Therefore, for 300 ton/day ammonia plant will require about 246.7 tons of nitrogen and 53.3 tons of hydrogen per day. Specifications and cost of heat exchangers and compressors used in the synloop are given in Tables 20 and 21, respectively. Table 20. Specifications and cost of heat exchangers used in the synloop based on 2010US$ Type Area (m2 ) Capacity (MW) Installed Cost ($) Floating head 1690 4.60 3,016,600 Floating head 28.5 3.31 219,610 Floating head 332.2 5.72 610,520 Floating head 197.5 10.67 427,770 Floating head 176.8 4.35 400,450 Total 2425 28.64 4,674,950 Source: Data from Ref. [13] The heat exchangers are required to integrate the heat throughout the synthesis loop. There are assumed to be four major heat exchangers in the loop that are tasked with heating up the feed gases that enter the reactor and cooling down the product streams as they leave the reactor. There
  • 27. 26    are also intercoolers that cool the gases between compression stages to minimize the compressor work. Table 21. Specifications and cost of compressors and drivers used in the synloop based on 2010 US$ Type Number Fluid Power (MW) Shaft Power (MW) Installed Cost ($) Centrifugal & Driver 5 1.02 1.54 2,499,210 Centrifugal & Driver 1 0.52 0.78 1,630,920 Total 6 5.62 8.48 14,126,970 Source: Data from Ref. [13] Table 22. Specifications and cost of reactors used in the synloop based on 2010 US$ Type Volume (m3 ) Pressure (bar) Installed Cost ($) Packed bed 7.54 150 1,686,900 Flush drum 6.1 150 1,477,900 Total 3,164,800 Source: Data from Ref. [13] The installed costs of Haber-Bosch reactor and reciprocating pumps are given in Table 22 and 23, respectively. Table 23. Specifications and cost of pump used in the synloop based on 2010 US$ Type Material Power (kW) Installed Cost ($) Reciprocating Carbon steel 112 581,840 Source: Data from Ref. [13] In total, ammonia synthesis loop capital cost yields 22,548,560 US$. 4. Feasibility analysis of electrolyzers in hydrogen production process The power requirements for electrolysis of water can be calculated using the manufacturer specifications for the specific power requirements. For example the specific power for Norsk Hydro Atmospheric Type 5040 electrolyzers is listed as 4.8 kWh/Nm3 of hydrogen, of which 4.3 kWh/Nm3 is for electrolysis and the remaining 0.5 kWh/Nm3 is for the balance of plant. The calculation for the power requirements for a 26,800 Nm3 /h of hydrogen consuming ammonia plant is: 4.8 26,800 129 MW
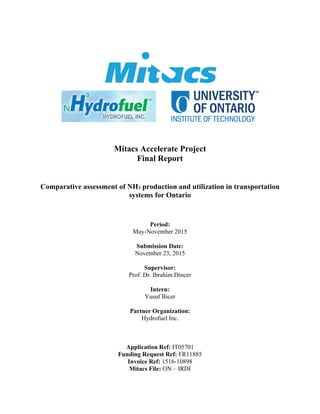
  • 28. 27    This is the direct current (DC) power requirement for electrolysis. The alternating current (AC) power requirements are calculated by dividing the DC power requirement by a rectifier efficiency of 95% [16] to obtain 135.4 MW. Fig. 16. The capital cost distribution of all electric 300 ton/day ammonia production plant (data from Ref. [13]) Fig. 17. Capital cost curve for an all-electric ammonia plant (adapted from Ref. [13]) 65% 21% 6% 5% 3% Electrolyzer Synthesis loop ASU Mechanical vapor compression Storage
  • 29. 28    On the other hand, for the central electrolysis which was given in the previous section, the average energy consumption rate is 46 kWh/kg which corresponds to 4.14 kWh/Nm3 . In this case, the required power is: 4.14 26,800 111 MW Fig. 18. Power requirements of all-electric ammonia plants for various capacities (adapted from Ref. [13]) When electrolyzer scaling is used, the electrolyzer stacks share common industrial equipment to reduce costs. The best case scenario is has a cost curve with a scaling factor of 0.5, and overall capital costs are drastically reduced. The power requirements are almost entirely for the electrolysis of water. For a 300 ton/day ammonia plant, the power requirements are calculated to be 145 MW total with 135 MW being required for the electrolysis which corresponds to 93% as shown in Fig. 18. The synthesis loop requires about 8 MW of power, or about 5.5% of the total power requirements. The power required for a 300 ton/day ammonia plant is about 145 MW. Thus, the plant will consume 1,148,400,000 kWh of energy annually. The overall capital cost distribution in a 300 ton/day ammonia production facility can be seen in Figs. 16 and 17 (with electrolyzer scaling).
  • 30. 29    II. CASE STUDIES In this section, various case studies ranging from high pressure electrolysis process to thermal methane plasma disassociation are comparatively studied. Possible improvements in Haber-Bosch process are investigated by eliminating the main feed gas compressor and utilizing the excess heat in the reactor. The feasibility study of the selected options have been conducted. Case 1: Ammonia production via low cost hydropower electricity + high pressure electrolysis + cryogenic air separation + Haber-Bosch plant without compressor The average cost of ammonia production from the electrolysis based systems are approximately 20-25% of hydrogen production cost as previously given in Ref. [17] for various ammonia production methods. 17.8% of ammonia is hydrogen in weight, and about 3% of ammonia production cost comes from air separation based nitrogen production. In the proposed system, the lower limit has been taken to calculate the cost of ammonia production from high pressure electrolysis based systems. Therefore, ammonia production costs are calculated as the 20% of hydrogen production cost. The schematic diagram of high pressure electrolysis based ammonia production system is given in Figs. 19 and 20. In this case, hydrogen compressor is eliminated by using pressurized water and high pressure electrolysis system. However, the nitrogen is used as gaseous form and still need to be compressed by the compressor. The amount of work decreases substantially because nitrogen constitutes about 82% of the feed gases. The required electricity is supplied via low cost hydroelectric plant to the electrolyzer, cryogenic air separation unit, external nitrogen compressor, pump and recycling compressor inside the Haber Bosch process. Hydroelectric Power Plant High Pressure PEM Electrolyzer Cryogenic Air Separatioin Low cost hydropower Air ElectricityElectricity High Pressure H2 High Pressure N2 Haber Bosch Ammonia Synthesis (No Main Compressor) Ammonia Storage NH3 Water O2 O2 Pump High Pressure Water Compessor Fig. 19. Schematic diagram of high pressure electrolysis based ammonia production system
  • 31. 30    High Pressure Electrolysis Haber‐Bosch with No Main Compressor Ammonia Synthesis Low Cost Hydropower Electricity Water Hydroelectric Power Plant Nitrogen (N2) Ammonia (NH3) High Pressure Water Fig. 20. A diagram of energy and material flows of high pressure electrolysis based ammonia production system Using the data from the previous chapter given in high pressure electrolysis hydrogen production prices, the costs of ammonia production via high pressure electrolysis based electrolysis at two different electricity prices are illustrated in Fig. 21. Fig. 21. Cost comparison of ammonia production from high pressure PEM electrolysis and Haber-Bosch plant based on various electricity price and current electrolyzer densities at 345 bar (data from Ref. [2]) 0.98 0.79 0.76 1.19 1.01 1.00 0.00 0.20 0.40 0.60 0.80 1.00 1.20 929 1858 2787 Ammonia production cost ($/kg) HP electrolyzer current density (mA/cm2) Total ammonia cost ($/kg) (Electricity : US 5 cent/kWh) Total ammonia cost ($/kg) (Electricity : US 3.5 cent/kWh)
  • 32. 31    Case 2: Ammonia production via low cost hydropower electricity + high pressure electrolysis + cryogenic air separation with liquid nitrogen pumping + Haber-Bosch plant without main compressor In this case, opportunities of utilizing the excess heat of Haber Bosch process are investigated as illustrated in Fig. 22 and 23. The negative value of enthalpy in the ammonia synthesis process indicates that the reaction is exothermic, releasing approximately 2.7 GJ/ton NH3 heat in ammonia production. This is equivalent to about 8% of the energy input for the entire process. It means that heat dissipation is about , 2700 kJ/kg ammonia. For the ammonia production facility with a capacity of 300 ton/day, the amount of required nitrogen mass flow rate is 246.7 ton/day which corresponds to about 2.90 kg/s. 250 ∙ ∙ kg/s Excess heat Hydroelectric Power Plant High Pressure PEM Electrolyzer Cryogenic Air Separatioin Low cost hydropower Air ElectricityElectricity High Pressure H2 High Pressure Liquid N2 Haber Bosch Ammonia Synthesis (No Main Compressor) Ammonia Storage NH3 Water O2 O2 Pump High Pressure Water Cryogenic Pump Evaporator Fig. 22. Schematic diagram of high pressure electrolysis and liquid nitrogen pumping based ammonia production system
  • 33. 32    In this case, hydrogen is produced via high pressure electrolysis and sent to Haber-Bosch reactor. Nitrogen is produced by cryogenic air separation as liquid end product. The liquefaction of nitrogen process will require more energy compared to gaseous end product. The liquid nitrogen is pumped to reaction pressure about 200 bar by cryogenic pump. High Pressure Electrolysis Haber‐Bosch with No Main Compressor Ammonia Synthesis Low Cost Hydropower Electricity Water Hydroelectric Power Plant Liquid Nitrogen (N2) Ammonia (NH3) High Pressure Water Evaporator Excess heat Fig. 23. A diagram of energy and material flows of high pressure electrolysis and liquid nitrogen pumping based ammonia production system The excess heat in Haber-Bosch reactor is utilized for the vaporization of high pressure liquid nitrogen to obtain high pressure gaseous nitrogen for ammonia synthesis reaction. The required electricity is supplied via low cost hydroelectric power plant to the electrolyzer, cryogenic air separation unit, pumps and recycling compressor inside the Haber Bosch process. An air separation facility with a capacity of about 250 ton/day is considered. The outlet pressure of air separation unit is generally at 8 bar. The liquid nitrogen at 8 bar is pressurized using cryogenic pumps up to 200 bar. ∙ ∙ The required pump power is calculated as 52.36 kW. The liquid nitrogen enters to vaporizer which utilizes the excess heat in Haber-Bosch process. The outlet temperature of vaporized unit is set to 25°C.
  • 34. 33    300 ∙ ∙ kg/s 53.3 ∙ ∙ kg/s ∙ , When 300 ton/day ammonia is produced, the Haber-Bosch reactor releases 9375 kW heat. The hydrogen and nitrogen gas mixture is sent to reactor. The reaction temperature for Haber-Bosch process is about 450°C. The temperature of hydrogen is assumed as 100°C after high pressure electrolysis. The required heat of vaporization for nitrogen at 2 180°C is calculated as 506.1 kW. ∆ , ∙ Besides, the mixture gasses hydrogen and nitrogen require 4589 kW heat in order to reach the reaction temperature. ∙ ∙ where initial temperature of hydrogen is 100°C and initial temperature of nitrogen is 25°C, and final temperature is 450°C. Therefore, 4786 kW excess heat is available which can be utilized in vaporization of liquid nitrogen. Finally, the amount of excess heat from Haber-Bosch reactor is satisfactorily enough for the vaporization of liquid nitrogen. On the other hand, if gaseous nitrogen is pressurized to the reaction temperature instead of liquid pumping, the required compressor power to have compressed nitrogen from 8 bar to 200 bar is calculated to be 1057 kW. In total, liquid nitrogen pumping and vaporization require about 559 kW power. This indicates that there is about 52% reduction in energy requirement by using liquid nitrogen pumping and vaporization obtained by the excess reactor heat. As it can been seen in previous tables, the cost of 5 centrifugal compressors in the 300 ton/day ammonia synthesis synloop represent 50% of the overall installed cost of synthesis loop. When these compressors are eliminated, nearly 11 million $ capital cost reduction will be achieved. The required power for 300 ton / day ammonia plant was calculated as 145 MW. Approximately 7.7 MW of this power is used for synloop compressors. Therefore, the required power will decrease 5.3% for the overall plant.
  • 35. 34    Case 3: Pressurization of LNG to 200 atm and vaporization of LNG using waste heat from Haber-Bosch reactor + Plasma dissociation of methane for hydrogen production via low cost hydropower electricity + Cryogenic air separation with liquid nitrogen pumping + Haber- Bosch plant without main compressor In this case, methane is utilized as a source of hydrogen which is required for ammonia production as shown in Fig. 24. Rather than steam methane reforming, thermal plasma cracking of ammonia is an important option for clean ammonia production. Methane (CH4) is dissociated to carbon (C) black and hydrogen (H2) according to: CH4 → C + 2 H2 ∆ 74.9 25° . Here, methane is a favored option for H2 production from a hydrocarbon because of its high H to C ratio, availability and low cost. Furthermore, the C produced can be sold as a co-product into the carbon black market which could be utilized in inks, paints, tires, batteries, etc. or sequestered, stored, and used as a clean fuel for electricity production. The sequestering or storing of solid C requires much less development than sequestering gaseous CO2 [18]. Haber‐Bosch with No Main Compressor Ammonia Synthesis Low Cost Hydropower Electricity Hydroelectric Power Plant Liquid Natural Gas (LNG) Ammonia (NH3) Evaporator Excess heat Microwave Plasma Disassociation High Pressure Natural Gas Carbon High Pressure Hydrogen Evaporator Liquid nitrogen (N2) High Pressure Nitrogen Excess heat Power Electricity Electricity Fig. 24. The schematic diagram of thermal plasma disassociation of methane integrated to ammonia production
  • 36. 35    As seen in Fig. 24, liquid natural gas and liquefied natural gas is pressurized using cryogenic pumps. The available excess heat from Haber-Bosch reactor is utilized for vaporization of both liquid nitrogen and LNG. The high pressure LNG is sent to thermal plasma disassociation process which divides methane into hydrogen and carbon. Carbon black is stored for further utilization is various industries. The obtained hydrogen gas is transferred to Haber-Bosch process together with high pressure nitrogen gas. It is a plasma-arc process that decarbonizes natural gas in a compact reactor that is in-line with the fuel delivery system. The carbon has applications in metallurgy, tires and manufactured rubber goods. Carbon black is a form of carbon that is usually created by the incomplete combustion of heavy petroleum products. It is primarily used as a rubber reinforcing agent in the production of automobile tires, belts and hoses, as well as a pigment in plastics and dyes [19]. The commercial microwave disassociation of methane requires the equivalent of between 3-4 kWh/m3 of pure H2 [19]. The voltage required to produce the plasma depends on many factors such as the plasma distance, the type of media used, the operating pressure, and the operating temperature. Typically the system plasma voltages change from 1 kV – 20 kV. The actual plasma temperature is between 1500°C-2500°C. The exiting gas temperature may reach 300°C and the reactor surface temperature is generally less than 200°C. The theoretical efficiency limit for the plasma technology is less than 1 kWh/m3 of pure H2 [19]. The estimated cost would be equivalent to $0.05 per 28.2 m3 of natural gas or about a 1% premium paid on the price of gas [19]. The carbon can be sold to foundry industry with an average price of 900 US$/ton. Thermal plasma disassociation of methane would bring some problems under high pressure since there is not much study about even moderate pressure systems. In the analysis, it is assumed that the pressure will not affect the conversion process. The calculations are carried out for a 300 ton/day ammonia production plant which utilizes thermal plasma disassociation of methane for hydrogen production based on the data in Ref. [20]. The following assumptions are made:  The thermal efficiency of DC-RF microwave unit is assumed to be 60% [20].  The methane is totally converted to hydrogen and carbon black.  Hydrogen and methane is assumed to be at ambient temperature at 25°C and pressure P=100 kPa.  Carbon yield is 0.49 kg/m3 natural gas at STP.  The price of carbon black is assumed to be 1 US$/kg in economic calculations. The outlet pressure of air separation unit is generally at 8 bar. The liquid nitrogen at 8 bar is pressurized using cryogenic pumps up to 200 bar. ∙ ∙ The required pump power is calculated as 52.36 kW. The liquid nitrogen enters to vaporizer which utilizes the excess heat in Haber-Bosch process. The outlet temperature of vaporized unit is set to 25°C. When 300 ton/day ammonia is produced, the Haber-Bosch reactor releases 9375 kW heat. The hydrogen and nitrogen gas mixture is sent to reactor. The reaction temperature for Haber- Bosch process is about 450°C. The temperature of hydrogen is assumed as 100°C after high pressure electrolysis. The required heat of vaporization for nitrogen at 180° calculated as 506.1 kW. ∆ , , _ 2 , ∆ ,
  • 37. 36    The required energy for vaporization of LNG is found to be , 1257 kW for LNG at 161° . The mass flow rate of natural gas and carbon can be found as per following formula: 0.49 kg/s , The required pump work for LNG from 1 bar to 200 bar kPa is found to be , 47.09 kW. ∙ ∙ If a compressor is used from ambient temperature and pressure at 25°C and 1 bar to 200 bar for natural gas instead of LNG pumping, the required power would be , 518.8 kW. If the compressor works under same conditions with pump which is from -162°C, the outlet temperature becomes 147°C and the required power yields 1503 kW. Table 24. The mass flow rates of the streams in the process Product/Feed Mass Flow Rate (kg/s) Carbon 1.863 Hydrogen 0.6169 Natural gas 2.465 Nitrogen 2.894 Ammonia 3.472 For the 300 ton/day ammonia plant, the mass flow rates of the streams in the thermal plasma disassociation process are given in Table 24. As previously calculated, 4786 kW excess heat was available which can be utilized in vaporization of both liquid nitrogen and LNG. The total required heat for vaporization processes is 1,257 kW+ 506.1 kW=1,763.1 kW. Finally, the amount of excess heat from Haber-Bosch reactor is satisfactorily enough for the vaporization of both liquid nitrogen and LNG. Thermal plasma disassociation balance equation can be written as follows: ∙ , ∙ ∙ The required power input to the thermal plasma disassociation system is calculated to be , 115,853 kW. The total required power for a high pressure electrolysis based ammonia production plant with a capacity of 300 ton/day ammonia was calculated to be about 145 MW. For this case, it is about 116 MW which is 20% less.
  • 38. 37    The cost of hydrogen production via thermal plasma disassociation is given in Table 25 based on the previously mentioned assumptions. The hydrogen purity from methane disassociation is 98%. PSA unit included in CarbonSaver plant cost to achieve 99.9% hydrogen purity. In the cost analysis, it is assumed that the plant has a capacity of 1,500 kg/day, plant life is 20 years and capacity factor is 70%. Based on the assumption that ammonia production cost will be about 20% of hydrogen production cost, the price is calculated as 1.01 $/kg ammonia. However, when the carbon black sales are taken into account, it decreases down to 0.412 $/kg. Table 25. Cost of hydrogen production using thermal plasma disassociation of methane Category Cost (US$/kg H2) Capital 0.46 O&M 1.40 Feedstock 3.19 Total 5.05 Carbon Black Sales -2.99 Net Cost 2.06 Source: Data from Ref. [21] Case 4: Using pumped hydro or producing ammonia from the excess power in Niagara Pumped hydroelectric storage plants store energy in the form of water in an upper reservoir, pumped from another reservoir at a lower elevation. During periods of high electricity demand, power is produced by releasing the stored water through turbines with the same method of hydropower plants. During low demand periods which are generally nights or weekends, the upper reservoir is charged via low cost electricity from the grid to pump the water back to upper reservoir. The efficiency values of pumped storage systems are high where the average efficiency values of system components in pumped storage plants are shown in Table 26. Table 26. Average efficiency values of system components in pumped storage plants Efficiency of generating cycle in average (%) Efficiency of pump cycle in average (%) Water conductors 98.3 98.3 Pump 83 91 Motor 98.1 98 Transformer 99.3 99.3 Overall 78.5 87.1 Source: Data from Ref. [22] The Ontario Power Generation operates a pumped storage plant near Niagara. It was constructed when Ontario projected excess nuclear production. Although it wastes one unit of electricity for each unit finally delivered, the storage system reserves some of the nightly water flow over Niagara for daytime use. This time-shifting optimizes power production by the main
  • 39. 38    generators, while maintaining the scenic daytime water flow over Niagara Falls as required under international agreement. Table 27. Three year average O&M costs of various hydro pumped storage projects in 2009 $/MWh Project 3 Year Average O&M Cost in 2009 $/MWh Bad Creek 3.41 Bath Country 2.43 Cabin Creek 15.42 Fairfield 4.11 Helms 19.44 Jocasse 5.07 Ludington 5.55 Rocky Mountain 6.64 Yards Creek 5.28 Source: Data from Ref. [22] In Table 27, the O&M cost data do not include energy for pumping purposes. The average O&M cost is about $9.95/MWh as shown in Table 27 and Table 28. It is expected that specific construction and equipment procurement cost for a 1000 MW pumped storage project is a little under 2000 $/kW. The specific cost is close to 4000 $/kW for small projects on the order of 30 MW. The current capital cost of new pumped hydro facilities is estimated to range between USD 2 000-4 000/kW as shown in Table 28. Table 28. Specific installation and estimated annual O&M costs for pumped storage hydro plants Capacity (MW) Specific Installation Cost ($/kW) Estimated Annual O&M Cost (million $ in 2009) 50 3000 1.5 100 2940 2.9 250 2750 6.9 500 2500 12.5 750 2250 16.9 1000 2000 20 Source: Data from Ref. [22] The Lewiston Pump-Generating Plant located in Niagara has an installed power of 240 MW. The water is pumped at night since the demand for electricity is much lower than during the day. In addition to the lower demand for electricity at night, less water can be diverted from the river during the day because of the desire to preserve the appearance of the falls. During the following day, when electrical demand is high, water is released from the upper reservoir through the pump-generators in the Lewiston Dam. In Ontario, there is only one pumped hydro storage facility in operation, the Sir Adam Beck Pumped Storage Facility in Niagara Falls. During off- peak periods (night time), Ontario Power Generation diverts water from the Niagara River, filling its 300 hectare reservoir. During peak periods, this water is released, creating up to 174 MW of
  • 40. 39    hydro power. The capacity factor of the pumped storage power plants is about 6 hours/24hours=25%. For a pumped storage hydro plant with a capacity of 142 MW, a reversible Francis pump turbine system is necessary to pump back the water to the upper reservoir. Each pump/turbine will have a flow rate of 38.857 m3 /s. The system is planned to charge for 7 hours; with 81% , ∙ ∙ ∙ where ρ stands for the density of the fluid to be pumped, g is for acceleration due to gravity and H, Q stands for both gross head in meters and volumetric flow rate, respectively. Here η is the efficiency of pump considering all components water conductors, pump, motor, transformers. The pump power needed is calculated to be about 142 MW. The cost of storage unit is directly dependent on the stored energy and inversely proportional to the efficiency of the system. As an example, the tariff of electricity is taken as follows: 0.4736 $/kWh for peak hour and 0.3664 $/kWh for off-peak hour. The power for the pump will be used from off-peak hours starting from midnight. There are 5.67 hours of discharge and it works for the whole year. 5.7 365 0.4736 $ 980.1$ There are seven hours of charging. 7 365 0.3664 $ 936.2 $ The cost reduction available is 43.9 $/kW year. For a 145 MW pumped storage power plant, the overall yearly benefit would be calculated as 43.986 $ 145000 6,377,970 $. Here, the specific installation cost of pumped storage plants is about 2,750 $/kW which yields 398.75 million $ capital cost for installation. Annual estimated O&M cost of 150 MW pumped storage power plant is about 4.2 million $. As it was analyzed in the previous cases, ammonia production facility requiring about 145 MW installed power would produce 300 ton/day ammonia. This will correspond to 109,500 ton/year. The lowest ammonia production cost which was calculated in high pressure electrolysis based system yields 760 US$/ton. If the selling price of ammonia is assumed to be about 800 US$/ton in the current market, there is 40 US$/ton profit from ammonia trade. Yearly, there is about 4,380,000 US$ profit. The O&M cost of ammonia plant is calculated by multiplying the number of operating hours which is about 8000 hours/year by the electricity price by the operating power. Thus, the operating cost in year 1 is approximately $931,000 which is much lower than pumped storage hydro plant.
  • 41. 40    Case 5: Wind based ammonia production cost analysis The offshore wind energy is an alternative source for power generation which can be utilized in high pressure electrolyzers. The baseline offshore wind powered ammonia plant was simulated using the wind data from the Gulf of Maine. The simulation was done for a three year period using wind and grid from 2005-2007 [13]. The results are averaged over the three year period to get one representative year of system outputs as shown in Table 29. The 300 MW plant, which includes the NH3 facility and the offshore wind farm, had a total capital cost of $1.39 billion 2010 dollars [13]. The LCOA (levelized cost of ammonia) calculation requires several economic assumptions be made about the loan and the interest rates associated with the investment. The levelized cost calculation has several parts. First, the down payment on the investment is assumed to be in year 0 and is already in present value. For simplicity, the down payment is assumed to be 10% of the capital expenditure, or $139 million for the base case. The second term in the equation calculates the present value of the payments on the loan. Four parameters are required: the total value of the in present dollars, the interest rate on the loan, the inflation rate over the lifetime of the system, and the lifetime of the loan. The total amount of the loan is simply the total capital expenditure minus the down payment, or $1.251 billion dollars. The interest rate is assumed to be 4% with the inflation rate at 3%; the discount rate is assumed to be 7%. The lifetime of the project is assumed to be 20 years, which is typical for wind farms and chemical processing plants. The loan life is 15 years. The third term in the LCOA equation calculates the present value the operations and maintenance costs for the lifetime of the system - 20 years in this case. Recently, the operations and maintenance cost for onshore wind farms was found to be $10/MWh, corresponding to about 2.4% of the capital expenditure [23]. Because the wind farms are offshore rather than onshore, a higher value of 3% of the capital expenditure is assumed for this analysis. Table 29. Offshore wind based ammonia production plant details Parameter Value Capacity factor (%) 40.92 Average wind speed (m/s) 9.62 Average power (MW) 122.75 Annual electricity sold (MWh) 296,300 Annual electricity purchased (MWh) 492,000 Ammonia sold (ton) 109,500 Overall ammonia conversion efficiency (%) 50 Total cost (billion $) 1.39 Source: Data from Ref. [13] The wind farm achieved a capacity factor of over 40% and required more than 534 GWh of electricity from the grid to sustain the ammonia production process. At the same time, a substantial amount of energy could be sold back to the grid, totaling more than 268 GWh. The capital cost distribution of offshore wind based ammonia production plant is shown in Fig. 25.
  • 42. 41    The cost of manufacture for the ammonia facility is of principal importance: a large fraction of the overall costs will come from purchasing electricity, assumed to be the utility cost. The cost of manufacture is the sum of waste disposal, labor costs, utilities, general expenses, raw materials, taxes, maintenance costs as well as other minor costs. The waste disposal is assumed to be negligible because the waste is oxygen or brine both of which can be discharged safely into the environment with little or no processing. The following economic assumptions are made: Discount rate is 7%, inflation rate is 3%, interest rate is 4%, loan life is 15 Years, project life is 20 Years, O & M fraction for wind is 3% of capital expenditure and down payment is 10% of total capital cost [13]. Fig. 25. Capital cost distribution of offshore wind based ammonia production plant (adapted from Ref. [13]) The utility costs are the sum of the electricity costs and the raw material costs multiplied by 1.23. The utility costs include all of the purchased electricity costs minus the revenue from the electricity. Thus, if the electricity revenue is higher than the costs, the cost of manufacture decreases. The general expenses include administration, research and development, and distribution and marketing costs. Since the electrolyzers offer unattended, continuous operation, the multiplier for the determining the general expenses from the labor costs was reduced from 19% to 10%. The multipliers for the fixed capital investment and the cost of manufacture were held at 0.9% and 16%, respectively [13]. The LCOA (levelized cost of ammonia) for the selected offshore wind based ammonia production facility is calculated to be $1224/ton which is substantially higher than ammonia produced from a conventional natural gas based ammonia plant [13].
  • 43. 42    Case 6: Nuclear based ammonia production Steam electrolysis is the primary choice for hydrogen production in nuclear based ammonia production. The efficiency is comparable to the practical efficiencies of thermochemical processes if powered by an HTGR. Steam electrolysis can be powered by a pressurized water reactor (PWR) or a boiling water reactor (BWR). Capital costs of steam electrolysis and water electrolysis differ by less than 10% [24]. Table 30. Comparison of performance and costs of large nuclear powered ammonia plants Type of Reactor Hydrogen Production Method Efficiency (MJ Fuel/MJTin %) Capital Investment Cost (million $) Production Cost ($/ton) HTGR with heat integration Steam Electrolysis 48 1440 172 HTGR without heat integration Steam Electrolysis 41 1570 189 HTGR Water Electrolysis 37 1590 187 ABWR with heat integration Steam Electrolysis 29 1540 196 ABWR Water Electrolysis 23 1680 200 Source: Data from Ref. [24] The capital investment cost and production cost of ammonia via nuclear systems are illustrated in Table 30 and Fig. 26. Nuclear based ammonia production has the lowest operating costs which corresponds to 10-20% less than partial oxidation of coal and 40-50% less than steam methane reforming process as shown in Table 31. Nuclear based ammonia production has the highest capital costs which is 65-75% more than partial oxidation of coal 400-430% more than steam reforming methane as given in Table 31. In the ammonia synthesis loop, it is assumed that multiple intercoolers are used for compressor, ammonia reactor is at 200 bar and 20% of ammonia reactor in one cycle. Using the dissolved argon prevents excessive accumulation. In addition, for HTGR powered ammonia production system, 84% of is used for electricity, 10% is used for compressors and 6% is utilized as heat.
  • 44. 43    Table 31. Comparison of ammonia production and capital investment costs for various methods Process Ammonia Production (ton/day) Efficiency (%) Capital Investment (million $) Ammonia Production Cost ($/ton) Natural Gas 2100 79 360 331 Natural Gas with Sequestration 2100 76.4 420 356 IRIS 1120 28.7 580 201 GTHTR 1080 41.5 700 227 Coal 2100 42.7 870 218 Coal with Sequestration 2100 39.5 1000 291 HTGR 2100 48.3 1440 172 ABWR 2100 29.4 1540 196 Wind 2100 4000 321 Source: Data from Ref. [24] Fig. 26. The capital investment cost of various ammonia production methods (data from Ref. [24]) 360 420 580 700 870 1000 1440 1540 4000 0 500 1000 1500 2000 2500 3000 3500 4000 Capital investment cost (million $) Natural Gas Natural Gas with Sequestration IRIS GTHTR Coal Coal with Sequestration HTGR ABWR Wind
  • 45. 44    The main advantages of nuclear powered ammonia production could be listed as follows:  readily available raw materials air and water  low and constant operating costs  no co2 emissions High capital costs are the major disadvantage of nuclear powered ammonia production however, by enabling smaller and standardized modular reactors, it could be reduced the capital costs, construction cost and time, licensing cost and time [24]. High-temperature gas-cooled reactor (HTGR)-integrated high-temperature steam electrolysis (HTSE) was also considered to supply hydrogen to the ammonia process. In this scenario, coal usage for hydrogen production can be completely eliminated; hence, the process configuration is radically altered and no longer resembles the conventional coal-to-ammonia case. Two such configurations were considered in this study, and results indicate that approximately four 600 MWt HTGRs are required to support production of 3,360 ton/day of ammonia. Substituting hydrogen from water via nuclear-integrated HTSE instead of natural gas reforming or coal gasification (followed by shift conversion) eliminates fossil fuel consumption and the CO2 emissions associated with these processes. Fig. 27. HTSE based ammonia and various products synthesis from nuclear electricity (adapted from Ref. [25])
  • 46. 45    High temperature steam electrolysis (HTSE) based ammonia production method uses cryogenic air separation as the nitrogen source. Hydrogen for ammonia synthesis is produced by HTSE. Nuclear HTGRs supply heat and power for the electrolysis units [25]. Urea production requires CO2 as a feed to the process. For this case, a CO2 supply is not readily available and must be produced to support urea manufacture; hence, natural gas is burned with oxygen to produce the required CO2. While coal could have been selected for this purpose, natural gas is preferred because of the much simpler gas cleanup requirements [25]. Fig. 27 and Fig. 28 show an example of ammonia production facility including nitric acid, urea and ammonium nitrate synthesis by utilizing the nuclear waste heat and nuclear electricity. Nuclear electricity is used for high temperature electrolysis, air separation unit, feed gases compression for ammonia synthesis and other auxiliary equipment. Nuclear heat at temperature 700°C is used as supporter for high temperature steam electrolysis process. As HTGR technology matures and reactor outlet temperatures increase, the nuclear reactors may be able to supply electrolysis topping heat. However, because of the upper limit of 700°C deliverable heat assumed in this study, supplying topping heat from the burner to the electrolyzers is an attractive means of increasing electrolyzer efficiency [25] Fig. 28. Inputs and outputs of the plant via HTSE to ammonia method (adapted from Ref. [24]) The proposed high temperature steam electrolysis based ammonia and derivatives production yield 2,939 ton/day urea, 3,779 ton/day ammonium nitrate, 2,435 ton/day oxygen. The required heat and electricity for the process are 222 MWt and 770 MWe, respectively. The economic modeling calculations for HTGR technology were based on capital cost scenarios for current best estimate of US$2,000/kWt where kWt is the thermal rating of the plant. In comparison, light water nuclear reactor costs are approximately US$1,333/kWt. Based on the capital cost scenarios for HTGR technology, the nominal capital cost for a 600 MWt HTGR would be US$1.2 billion [25].
  • 47. 46    Fig. 29. Distribution of total capital investment for a plant including urea, ammonium nitrate and nitrite acid production via HTSE ammonia production method (adapted from Ref. [25]) The total capital investment (TCI), based on the total equipment costs, annual revenues, and annual manufacturing costs were first calculated for the case. The present worth (PW) of the annual cash flows (after taxes) was then calculated for the TCI, as well as the TCI at + 50% and – 30% of the HTGR cost, with the debt to equity ratios equal to 80%/20% and 55%/45%. Gas cleanup includes costs for water gas shift reactors, the Selexol process, sulfur recovery, pressure swing absorption, methanation, and CO2 compression/liquefaction as appropriate for the various process configurations. The fixed capital costs were estimated from literature estimates and scaled estimates (capacity, year, and material). Finally, an engineering fee of 10% and a project contingency of 18% were assumed to determine the TCI. The capital cost provided for the HTGR represents a complete and operable system, engineering fees and contingencies were not applied to this cost. The total investment cost of this HTSE plant was calculated as US$6,302,210,656 [25]. The results for the HTSE hydrogen cases look promising. However, integrating with nuclear power significantly increase the capital cost of the plant as seen in Fig. 29. This is due principally to the need for four nuclear reactors to support both hydrogen and electrical demands of the plant. Finally, in order to determine the most attractive options for ammonia production, various perspectives [26-31] such as life cycle, efficiency, cost and sustainability need to be addressed for the overall assessment of the selected options.
  • 48. 47    Conclusions The following concluding remarks are extracted from this comprehensive feasibility study covering a variety of methods, systems and applications:  Atmospheric pressure electrolysis systems produce the hydrogen at 1 atm and then pressurizes for further usage to about 20 bar. The compression cost of hydrogen to about 20 bar is 1.03$/kg H2 which corresponds to 15% of overall cost. In order to increase the pressure to Haber-Bosch reaction temperature, more energy input are then required.  High pressure water electrolysis system is an alternative option for reducing the required power of ammonia synthesis process by eliminating the main compressors in the system. It also reduces the cost to $0.40 from $1.03 (corresponding to approximately 40% after deducting the compression cost) for hydrogen production cost as compared to mechanical compression when the high pressure PEM electrolyzers are utilized.  Hydrogen produced by using pressurized water require less power than using hydrogen compressor. The required power difference is about 15% which brings lower cost hydrogen and ammonia.  Producing ammonia directly from high pressure electrolysis near the ammonia production facility eliminates the compression, storage and delivery processes of hydrogen which brings down the overall ammonia production cost.  For standard central water electrolysis with an electricity price of 3.7 US¢/kWh, plant gate hydrogen production is calculated to be 3.2 $/kg although it is 5.6 $/kg for dispended hydrogen.  The lowest average electricity price in Canada for large-power customers is observed in Winnipeg, Edmonton and Calgary with 3 US cent/kWh, 3.2 US cent/kWh and 3.60 US cent/kWh, respectively.  The lowest cost of high pressure electrolysis based hydrogen is calculated to be 3.8 US cent/kg at 2787 mA/cm2 current density for 3.5 US cent/kWh electricity price resulting in 0.76 US $/kg ammonia end product price.  In total, the capital cost of 250 ton N2/day air separation plant corresponds to 6,922,430 $ which is only 3% of overall ammonia production plant cost.  The excess heat in Haber-Bosch reactor can be utilized for liquid nitrogen vaporization and liquefied natural gas vaporization in order to decrease mechanical compression costs.  Nearly 65% of overall capital cost of 300 ton/day ammonia production plant comes from electrolyzer.  Thermal plasma disassociation of methane is an alternative option for hydrogen production which brings approximately 20% less power input for 300 ton/day ammonia production plant. However, the effect of high pressure on plasma disassociation of methane needs to be further studied.  In thermal plasma disassociation of methane, carbon black is also obtained as a valuable product for various industries which can be sold about 0.9-1 US$/kg.  In thermal plasma disassociation option, the production of liquefied natural gas should also be included in feasibility and cost studies in order to compare the overall performance.  When carbon black sales are considered, the cost of ammonia can decrease down to 0.42 $/kg which is quite lower than other methods. Therefore, in any cases, producing by products may bring higher revenues and therefore lower ammonia costs.
  • 49. 48     If 60 US$/ton profit from ammonia trade is considered, pumped storage hydro plant yearly profit would be nearly same with a 300 ton/day ammonia production plant profit. However, the capital installation cost of pumped storage hydro plant is nearly twice of ammonia plant.  The offshore wind based ammonia is also an environmentally friendly solution for ammonia production however, the unit cost for ammonia is still higher.  Nuclear based ammonia production options appear to be cost competitive than other methods however the initial investment costs are much higher. High capital costs are the major disadvantage of nuclear powered ammonia production however, by enabling smaller and standardized modular reactors, it could be reduced the capital costs, construction cost and time, licensing cost and time.  Mature Haber-Bosch technology would be optimized using liquid pumping instead of feed gases compression, high pressure electrolysis and vaporization via excess heat of Haber- Bosch reactor. Nomenclature F Faraday constant h Specific enthalpy (kJ/kg) H gross head (m) HHV Higher heating value (kJ/kg) m Mass (kg) m Mass flow rate (kg/s) N Number N Polytrophic exponent P Pressure (bar) Q Heat rate (kW) Q Volumetric flow rate (m3 /s) R Universal gas constant (8.314 kJ/kmol K) s Specific entropy (kJ/kg K) T Temperature (˚C) v Specific volume (m3 /kg) V Volume (m3 ) W Work rate (kW) z Number of electrons Greek letters η Efficiency η Isentropic efficiency ρ Density (kg/m3 ) Acronyms AC Alternating current ABWR Advanced boiling water reactor ASU Air separation unit BWR boiling water reactor C Compressor
  • 50. 49    CCS Carbon capture storage DC Direct current DOE Department of energy DFMA Design for manufacture and assembly FRP Fiber reinforced composite piping GGE Gasoline gallon equivalent HP High pressure HTGR High temperature gas cooling reactor HTSE High temperature steam electrolysis IRIS International reactor innovative and secure GHG Greenhouse gas GTHR Gas Turbine High Temperature Gas-cooled Reactor HB Haber-Bosch LNG Liquefied natural gas MEA Membrane electrode assembly O&M Operation and maintenance PEM Proton exchange membrane PW Present worth PWR Pressurized water reactor RF Radio frequency SMR Steam methane reforming STP Standard temperature and pressure UCG Underground coal gasification TCI Total capital investment References 1. Hamdan M. Electrolytic Hydrogen Production Workshop, NREL, Golden, Colorado, February 27-28th, 2014 2. Cropley CC, Norman TJ. Low-Cost High-Pressure Hydrogen Generator. 2008 DOE/GO/13029-20, United States; 3. Fateev V. High pressure PEM electrolysers: efficiency, life-time and safety issues, First International Workshop Durability and Degradation Issues in PEM Electrolysis Cells and Its Components, March 12th-13th, 2013, Fraunhofer ISE, Freiburg, Germany 4. Kazuo Onda, Takahiro Kyakuno, Kikuo Hattori and Kohei Ito, ‘Prediction of Production Power for High Pressure Hydrogen by High-Pressure Water Electrolysis’, Journal of Power Sources, Vol. 132, pp. 64 -70, 2004. 5. Laoun B. Thermodynamics aspect of high pressure hydrogen production by water electrolysis. Revue des energies renouvelables. 2007;10(3):435-44. 6. Multi-year research, development, and demonstration plan. 2015 Delivery Section. Fuel cell technologies office. Office of Energy efficiency & Renewable Energy. US Department of Energy. Washington, US, 2015. 7. Multi-year research, development, and demonstration plan. 2015 Production Section. Fuel cell technologies office. Office of Energy efficiency & Renewable Energy. US Department of Energy. 2015 Delivery Section. Washington, US, 2015. 8. Comparison of electricity prices in major North American cities, Rates in effect April 1, 2015, Hydro Quebec, 2015, ISBN 978-2-550-73559-5 (PDF).